Wednesday Aug. 23, 2006

No, not very much. Not much physics, math, biology, or geology
either. But, stay open minded, you might find that these subjects
are more interesting
than you might have thought and not necessarily that difficult either.
Having said that, here is a little more chemistry.
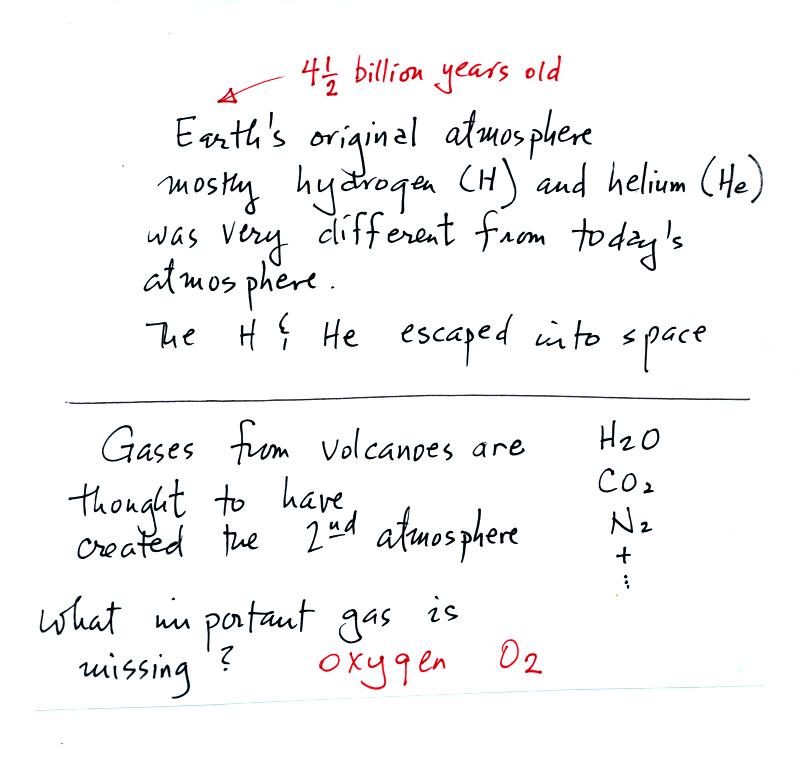
The earth's first atmosphere was composed mainly of hydrogen
and
helium.
These light-weight gases escaped into space and were lost. The
next atmosphere was built up of gases emitted during volcanic
eruptions, mostly water vapor, carbon dioxide, and nitrogen. As
the earth began to cool the water vapor condensed and began to create
oceans. Carbon dioxide dissolved in the oceans and was slowly
turned into rock. Much of the nitrogen remained in the atmosphere.
Note the volcanoes didn't add oxygen to the atmosphere.
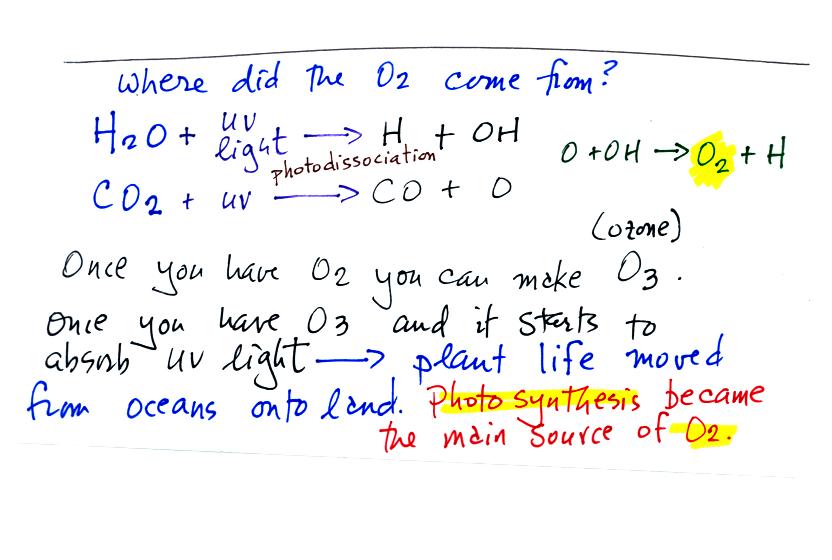
The oxygen is thought to have first come from
photodissociation of
water vapor and carbon dioxide by ultraviolet light (the high energy
radiation splits the H20 and CO2 into
pieces). The O and OH react
to form O2 and H.
Once O2 begins to accumulate in the air it can react with O
to form
ozone, O3. The ozone then begins to absorb ultraviolet
light,
life forms can move from the oceans (which would absorb UV light in the
absence of ozone) onto land. Eventually plants and photosynthesis
would become the main source of atmospheric oxygen.
Here's
another question that someone asked

Does the dew point temperature have anything to do with relative
humidity? They are related in the sense that they both tell you
something about moisture in the air.
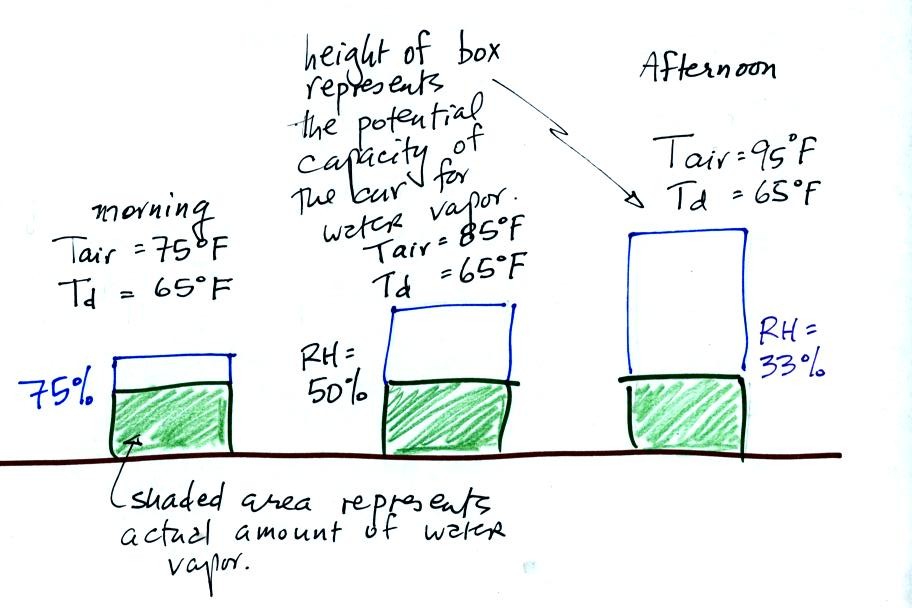
In the figure above the air temperature changes from 75 F in the
morning to 95 F in the afternoon. The air's temperature (as we
will see when we get to Chapter 4 later in the semester) determines how
much water vapor the air can potentially contain.
The dew point temperature remains constant in the figure above.
The actual amount of water vapor in the air doesn't change.
The relative humidity tells you how close the air is to being "filled
to capacity" with water vapor.
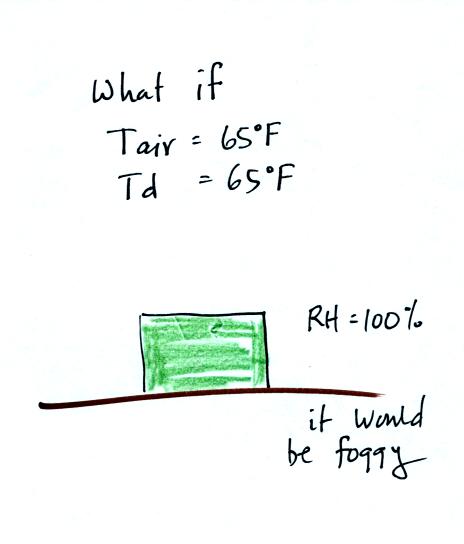
If the early morning temperature had been 65 F, the same as the dew
point, the relative humidity would have been 100%. It would have
been foggy.
The relative humidity really tells you whether a cloud or fog or dew is
about to form. The RH also gives you an idea of how well your
evaporative cooler will work (it cools more effectively when the RH is
low). It is also hard for your body to cool by perspiring when
the RH is high (see heat index on p. 86 in the textbook).
Still
another question from a student that came to my office
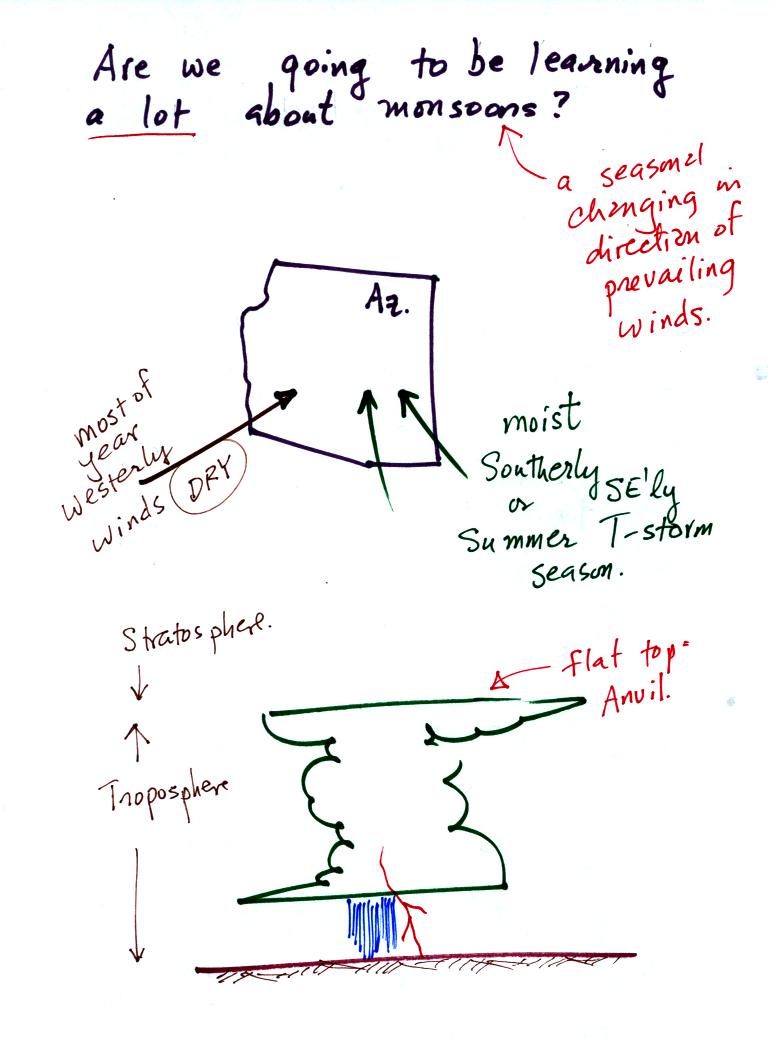
Many people think that the term monsoon just means thunderstorm.
We will learn a fair amount about thunderstorms in this class.
The term monsoon really means a seasonal change in the direction of the
prevailing winds (we'll learn a little bit about what causes that
too). For most of the year winds in the Arizona come
from the west and are dry. For two or three months in the summer
the winds pick up an easterly component and are moister. When
there is sufficient moisture thunderstorms can form. In an
average year Tucson gets about half of its yearly precipitation during
the summer monsoon season. The website maintained by the
Tucson office of the National
Weather Service has a lot of additional information about the summer monsoon.
There is a
tropical storm (Debby) off the east coast of the US and a strong
hurricane (Ileana) off the west coast. You can learn more about
these tropical systems at the National
Hurricane Center webpage
This was a good time to introduce the Saffir-Simpson scale used to
rate hurricane strength or severity.
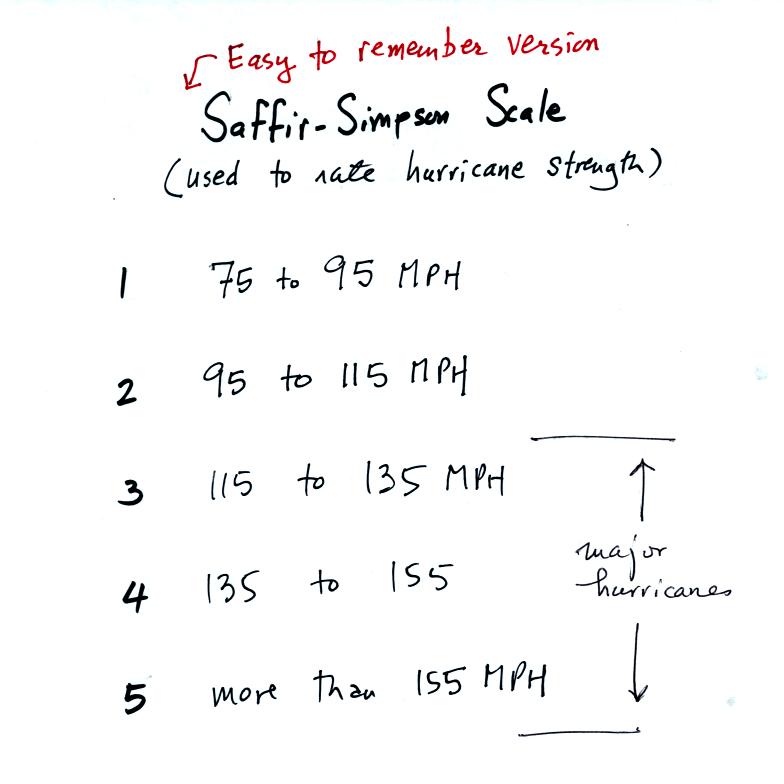
With sustained winds of 120 MPH, hurricane Ileana is currently a
category 3 hurricane, a major hurricane. The hurricane center
expects some strengthening (perhaps to category 4) followed soon by
rapid weakening. Moisture from tropical storms and hurricanes is
sometimes pulled into southern Arizona. This can lead to an
increase in thunderstorm activity and heavy rainfall.
We finally covered
some new material, found on p. 1 in the photocopied Class Notes.
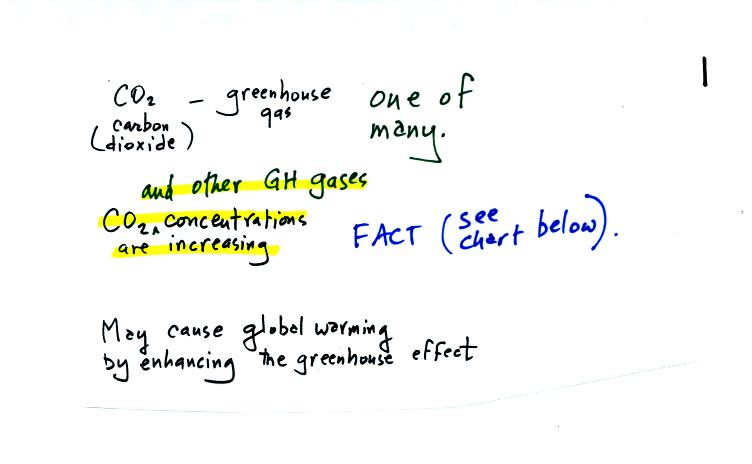
Carbon dioxide is one of several greenhouse gases (H2O, CH4,
N2O, CFCs
are some of the others)
The natural greenhouse effect is beneficial. The
average global annual surface temperature on earth without
greenhouse
gases
would be about 0o F. The presence of greenhouse gases
raises this average to about 60o F.
Increasing the concentrations of greenhouse gases in the
atmosphere could enhance the greenhouse effect and cause global
warming. This could have many detrimental effects such as melting
polar ice and causing a rise in sea level and
flooding of coastal areas, changes in weather patterns and changes in
the frequency and severity of storms.
The evidence for increasing CO2 concentration is shown in
the two
graphs below
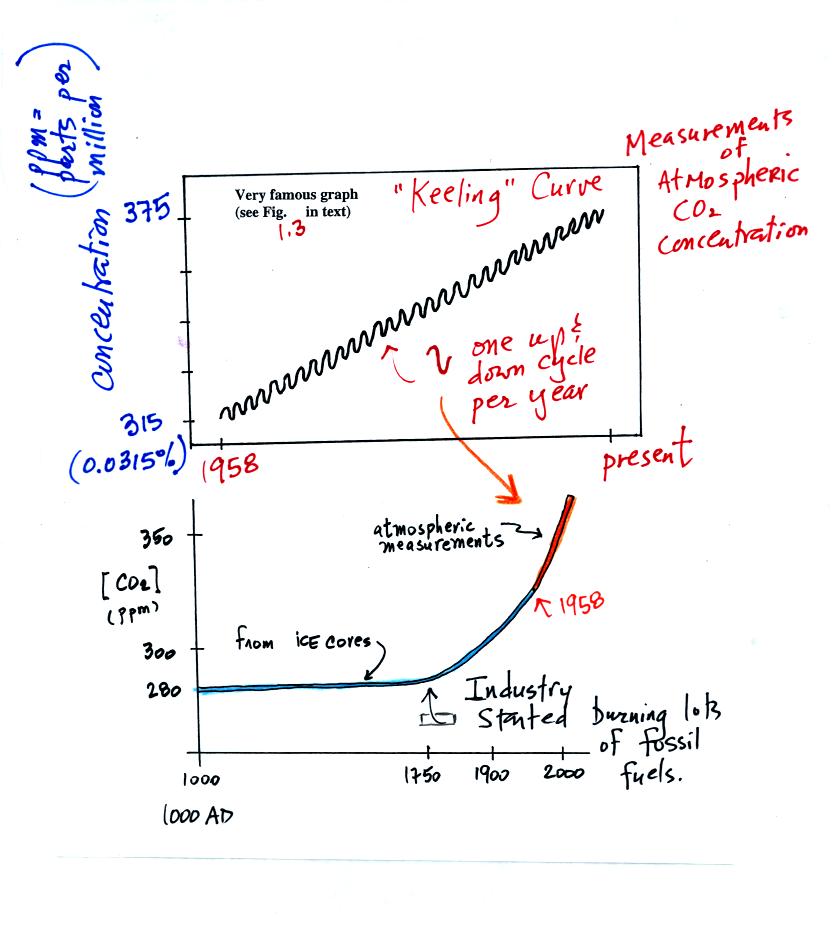
The top "Keeling" curve shows measurements of CO2 that
were begun
in 1958 on top of the Mauna Loa volcano in Hawaii. Carbon dioxide
concentrations have increased from 315 ppm to about 375 ppm during this
period. The small wiggles show that CO2
concentration
changes slightly during the year.
Once scientists saw this data they began to wonder about how CO2
concentration might have been changing prior to 1958. But how
could you now, in 2006, go back and measure the amount of CO2
in the
atmosphere in 1906? Scientists have found a very clever way of
doing just that. It involves coring down into ice sheets that
have
been building up in Antarctica and Greenland for hundreds of thousands
of years.
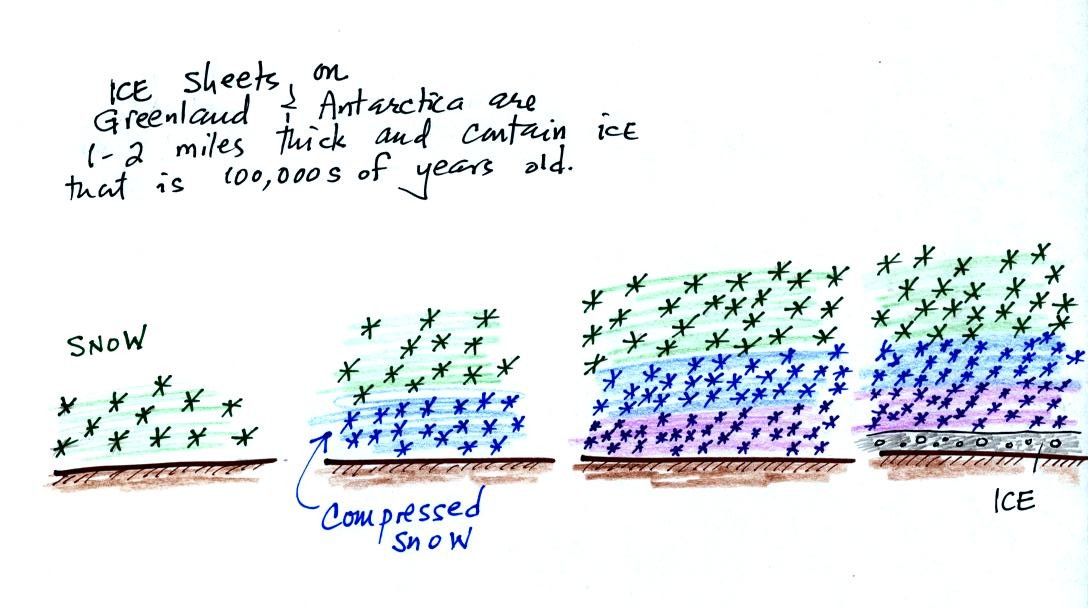
As layers of snow are piled on top of each other year after year, the
snow at the bottom is compressed and eventually turns into a layer of
solid
ice. The ice contains small bubbles of air trapped in the snow at
the time it originally fell. Scientists are able to date and then
take the air out of these bubbles and measure the carbon dioxide
concentration. A book, The Two-Mile TIme Machine, by Richard B.
Alley discusses ice cores and climate change. This is one of the
books available for checkout should you decide to write a book report
instead of an experiment report.
Using the ice core measurements scientists have determined that
atmospheric CO2 concentration was fairly constant at 280 ppm
between
1000 AD and the mid-1700s when it started to increase. The start
of rising CO2 coincides with the "Industrial
Revolution."
Combustion of fossil fuels needed to power factories adds CO2
to the
atmosphere.
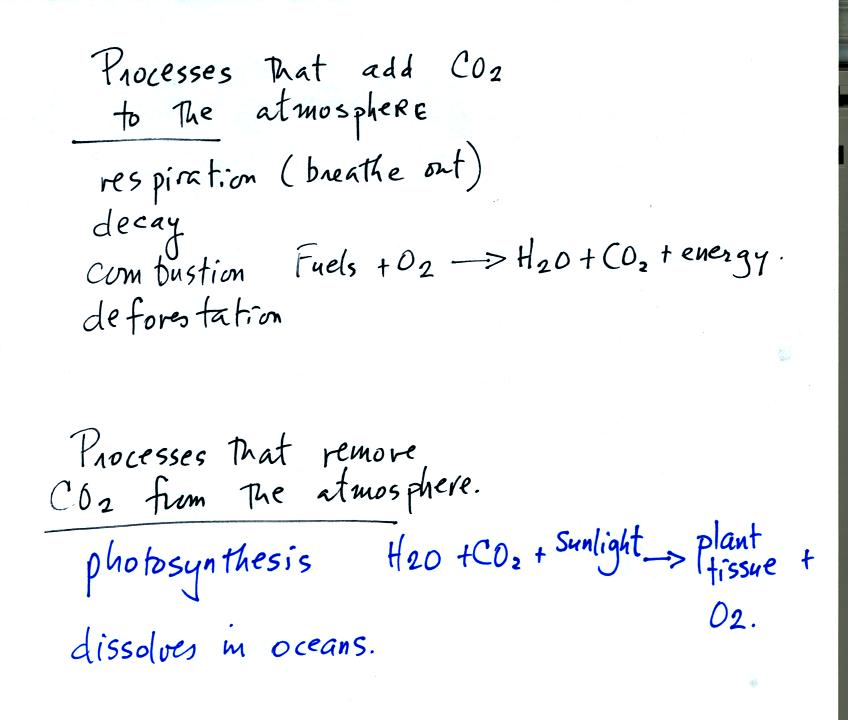
The figure above lists processes that add CO2 to and
remove CO2
from the atmosphere.
We can use this information to better understand the yearly variation
in atmospheric CO2 concentration.
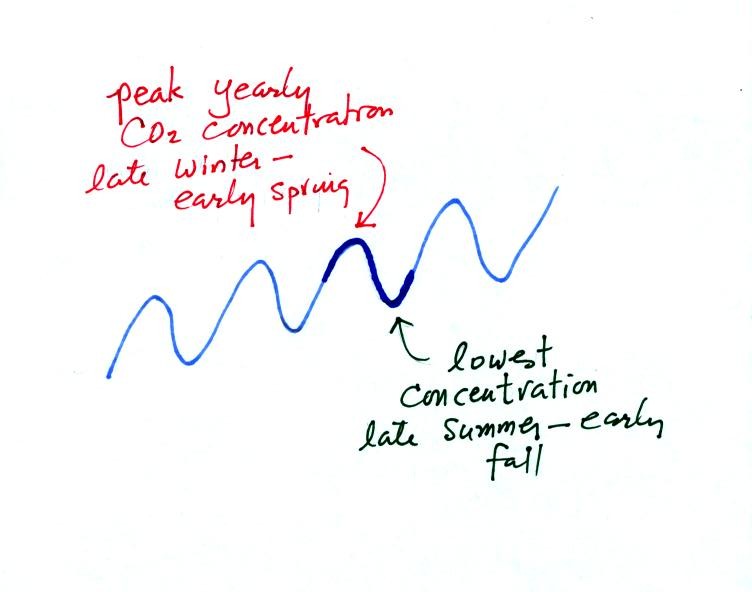
Atmospheric CO2 peaks in the late winter to early
spring. Many
plants die or become dormant in the winter. With less
photosynthesis, more CO2 is added to the atmosphere than can
be
removed. The concentration builds throughout the winter until the
rate of photosynthesis increases and brings things back into balance in
the spring.
Similarly in the summer the removal of CO2 by photosynthesis
exceeds
release. CO2 concentration decreases throughout the
summer and
reaches a minimum in late summer to early fall.


