Monday Nov. 6, 2006
We
actually did this example in class on Friday, but it will be good to
review it at the start of class on Monday.
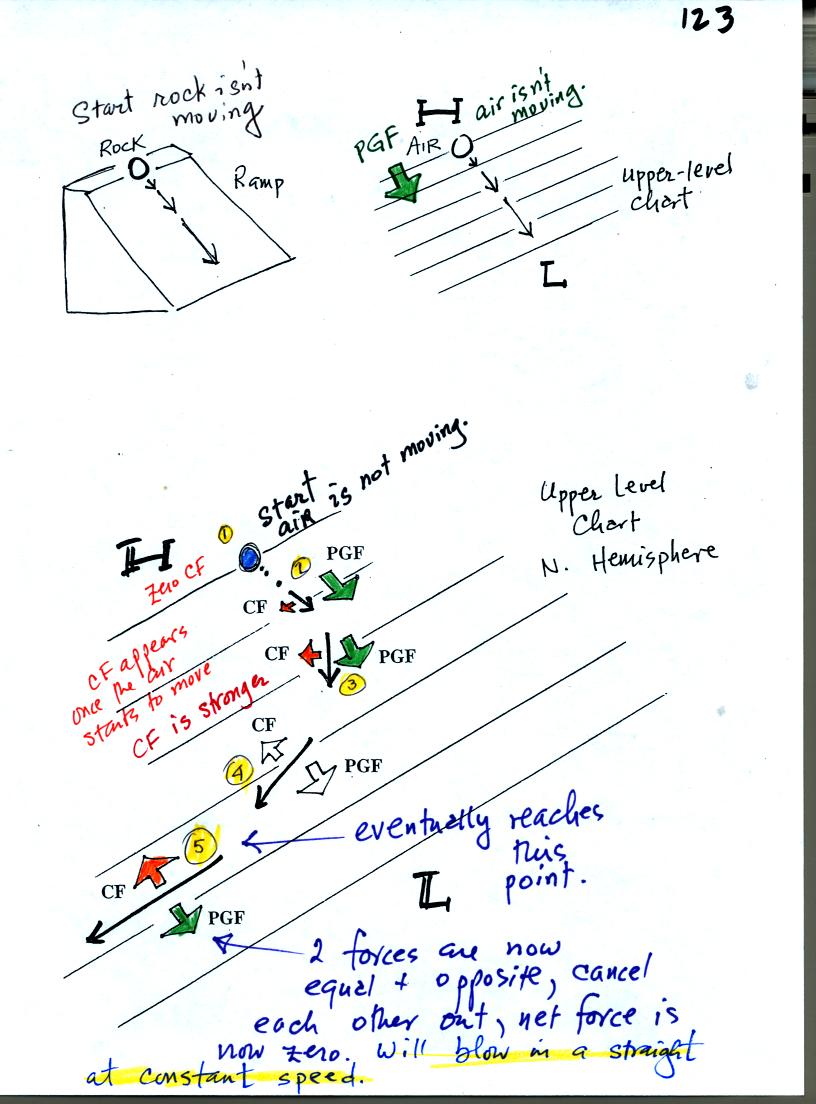
Start with the analogous situation at upper left. If you put a
rock on a ramp and let it go, it will roll downhill. If you put
some
air in a pressure gradient as shown at upper right. The pressure
gradient force (PGF) will start the air blowing toward low
pressure.
The wind will speed up as it goes.
On the larger weather chart at the bottom of the page, we start with a
stationary volume of air at Point 1. The PGF (perpendicular to
the
contour lines and pointing toward low) will start the air moving toward
low pressure.
At Point 2 the air is moving and the Coriolis force makes an
appearance. It is perpendicular and to the right of the
wind. It is
weak because the wind speed is low. The CF begins to cause the
wind to
bend (it is bending to the right if you look in the direction the wind
is blowing).
The wind picks up speed in Points 3 and 4 and continues to bend.
At Point 5, the wind speed is high enough that the CF is able to
balance the PGF. The net force is now zero. From this point
on the
winds will blow in a straight line at constant speed parallel to the
contour lines. This is known as a geostropic wind or geostrophic
flow.
Some
similar examples with just the essential details included.
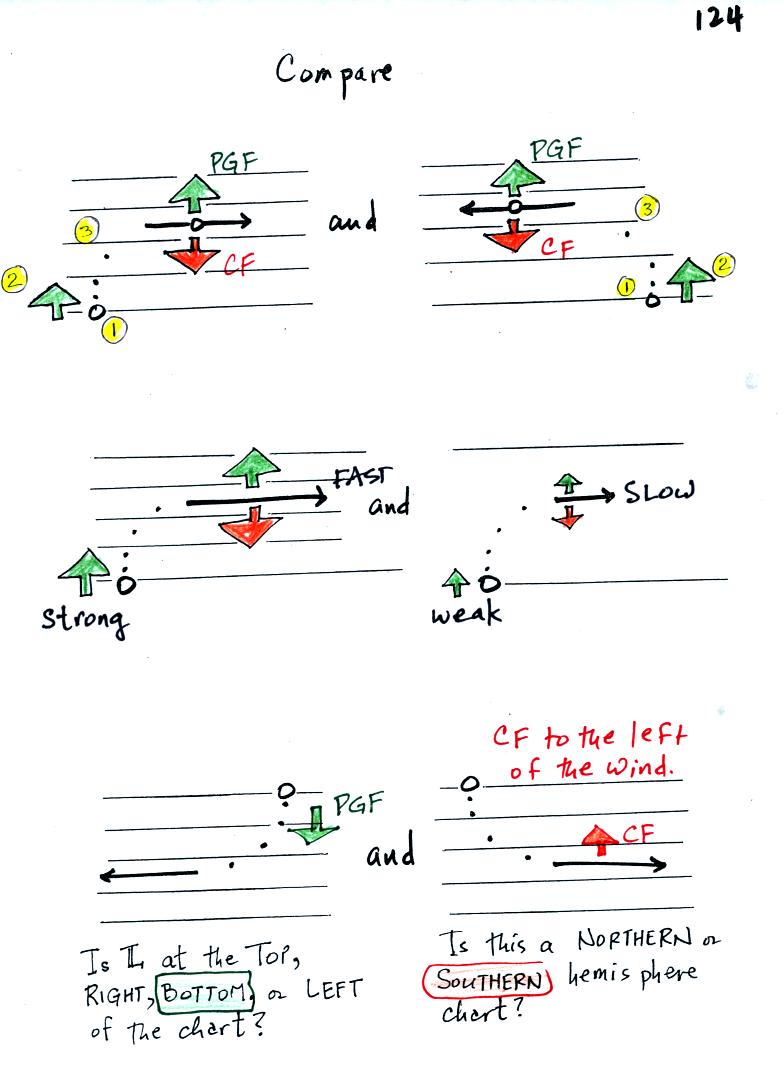
We start with the top left figure. Some air is placed
at Point
1. The dots show the direction of the initial motion. The
PGF force
starts stationary air moving, so we can identify the force at Point 2
as the pressure gradient force (low pressure would be found at the top
of this figure. Then if we watch the motion carefully we see the
air
beginning to turn to the right at Point 3. This is caused by the
Coriolis force. We know now that this is a northern hemisphere
map.
Points 1 and 2 are similar in the top right figure. But at Point
3 the
wind turns to the left. The top right map is in the southern
hemisphere.
The two middle figures show maps with strong and weak pressure
gradients. The wind in the left figure ends up blowing much
faster
than the wind in the right figure (much as a rock would roll quickly
down a steep ramp and slowly down a more gradual slope). The fast
wind
in the left figure produces a strong Coriolis force needed to balance
the strong PGF. The slow winds at right produce a weaker CF.
In the bottom left figure the direction of the initial motion (the
dots) is toward the bottom of the figure. The initial motion is
caused
by the PGF. The PGF points toward low pressure at the bottom of
the
chart. In the bottom right the wind takes a left turn once it
begins
to blow (remember you must be looking in the direction the wind is
blowing). That identifies this as a southern hemisphere chart.
Next we'll
look at upper level charts with circular contour patterns.

The rock rolling down a hill vs air moving in a pressure gradient
analogy is shown again at the top of the figure.
By now you should be understanding what is shown in Points 1 in the
figure lower figures. The dots tell you the direction of the
initial motion. They tell you the direction of the PGF, inward
toward low pressure in both these figures. In the middle figure
the wind takes a right turn at Point 2. This is a northern
hemisphere (NH) chart. The wind turns to the left at Point 2 in
the bottom figure, this is a southern hemisphere chart.
Note at Point 3 in both charts that the PGF and the CF point in
opposite directions but they are no longer equal in strength. The
inward point PGF is stronger than the outward CF. The difference
provides the net inward force needed to keep the wind blowing in a
circular path.
Because of the Coriolis force, winds blow counterclockwise around low
pressure in the NH and clockwise around low in the SH.
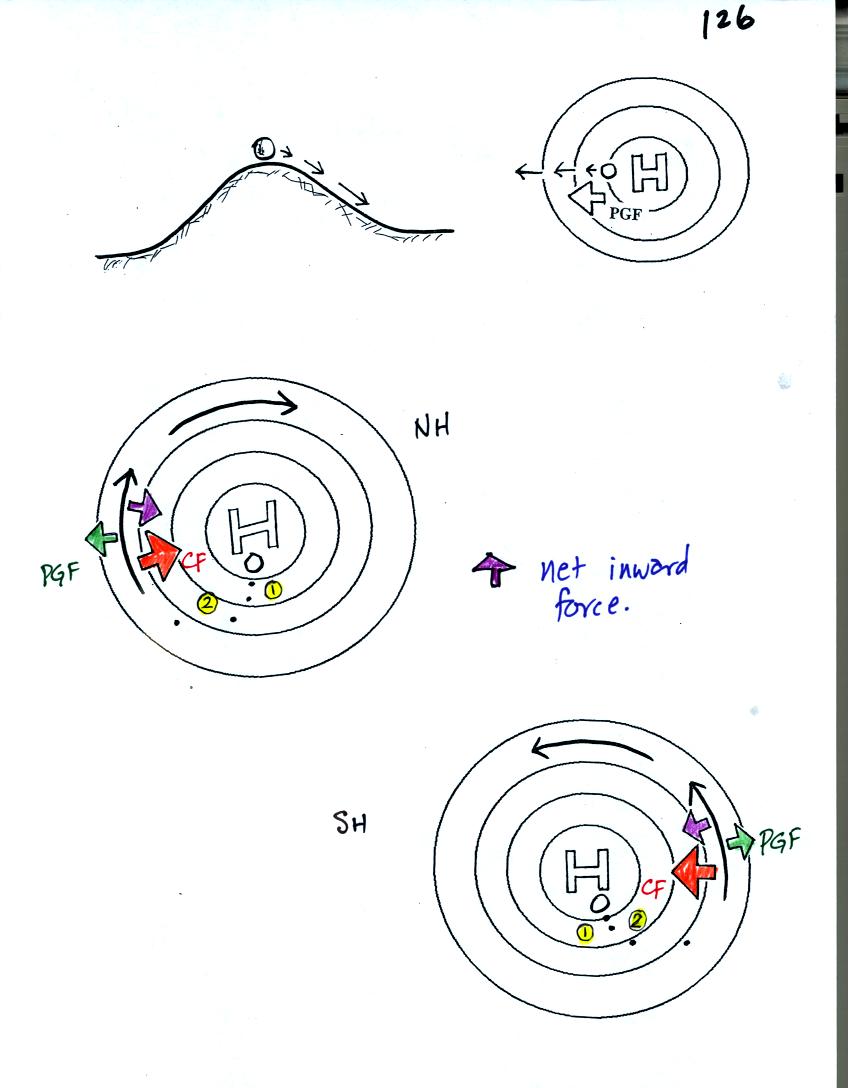
These figures show the wind motions around high pressure
centers.
The initial motion is ouward. The CF then bends the wind right or
left
depending on hemisphere. A net inward force is present again in
both
cases. Winds blow clockwise around high in the NH and
counterclockwise
around high in the SH.
Now before
you get the idea that all winds change directions in the NH and SH
we'll look at the next figure.
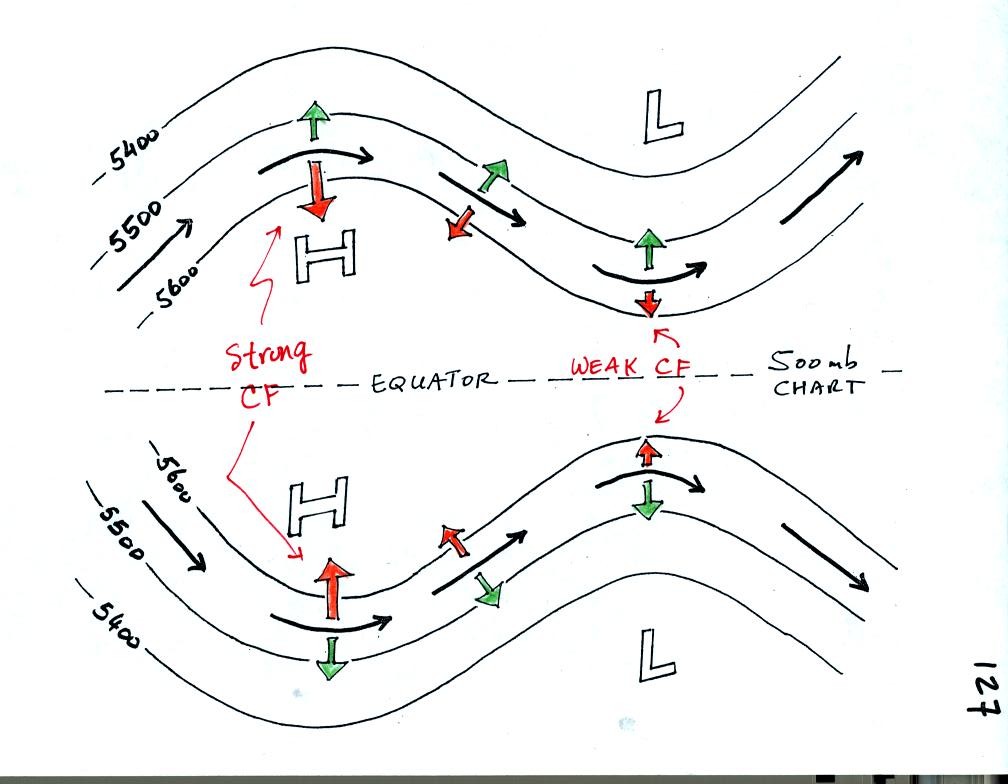
The winds are blowing from west to east in both hemispheres even though
the CF changes directions in the NH and SH. How is this
possible. If you look closely you will notice that the pressure
pattern is also "flipped." Low pressure is found at the top of
the map in the NH and at the bottom of the chart in the SH. The
direction of the CF changes directions in the NH and SH hemisphere, the
PGF also charnges directions and the winds blow in the same direction.
If you look closely at the figure you will notice that the CF force is
sometimes stronger (left side) and sometimes weaker (right side) than
the PGF. This changing imbalance is needed for the right and left
turns that the winds take as they blow through this pattern. If
you remember that the strength of the CF depends on latitude (as well
as wind speed) you can understand why the CF changes strength.
The CF is strongest when the winds are far from the equator (left
side), weakest when the winds are close to the equator (right side).
If you
ever go to the southern hemisphere one of the first things
you might do, once you land, is to rush into the airport bathroom and
flush the toilet or drain a sink. You would do this because you
might
remember having heard that as the water drains it spins in the opposite
directions in the northern and southern hemispheres. It is an
interesting story but unfortunately it isn't true (don't worry there
are still plenty of other interesting things to do in the southern
hemisphere).

Spinning motions do change directions when the Coriolis force is
involved.
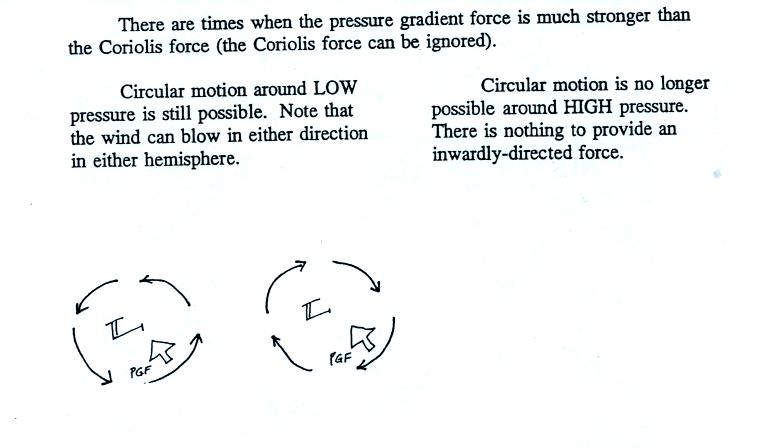
In some cases such as water draining from a sink or winds in a tornado,
the PGF is much stronger than the CF and the CF can be ignored.
In this case the winds or water can spin in either direction in either
hemisphere.