Wednesday Nov. 15, 2006
The Expt. #2 revised reports, and the Expt. #3 & #4 reports
have
all been graded. There are still a few Expt.
#4 reports that haven't been turned in and some of the sets of
materials haven't been returned. The revised Expt. #3 and #4
reports will be due in two weeks, that is on Wednesday Nov. 29.
Most of the 1S1P Assignment #2 reports have been graded. You can
check the grading status and
can check this list to see if you
have earned 45 pts yet on the 1S1P reports. 1S1P Assignment #3 reports are due Friday this
week and next Monday.
You should now be reading Chapter 10 (Thunderstorms, tornadoes, and
lightning) in the text.
We first finished up a little bit of the Global Scale pressure patterns
and winds that should have been finished up last Friday (were it not
for a fire alarm that emptied the classroom). You'll find that
material at the end of the Fri., Nov. 10 class
notes.
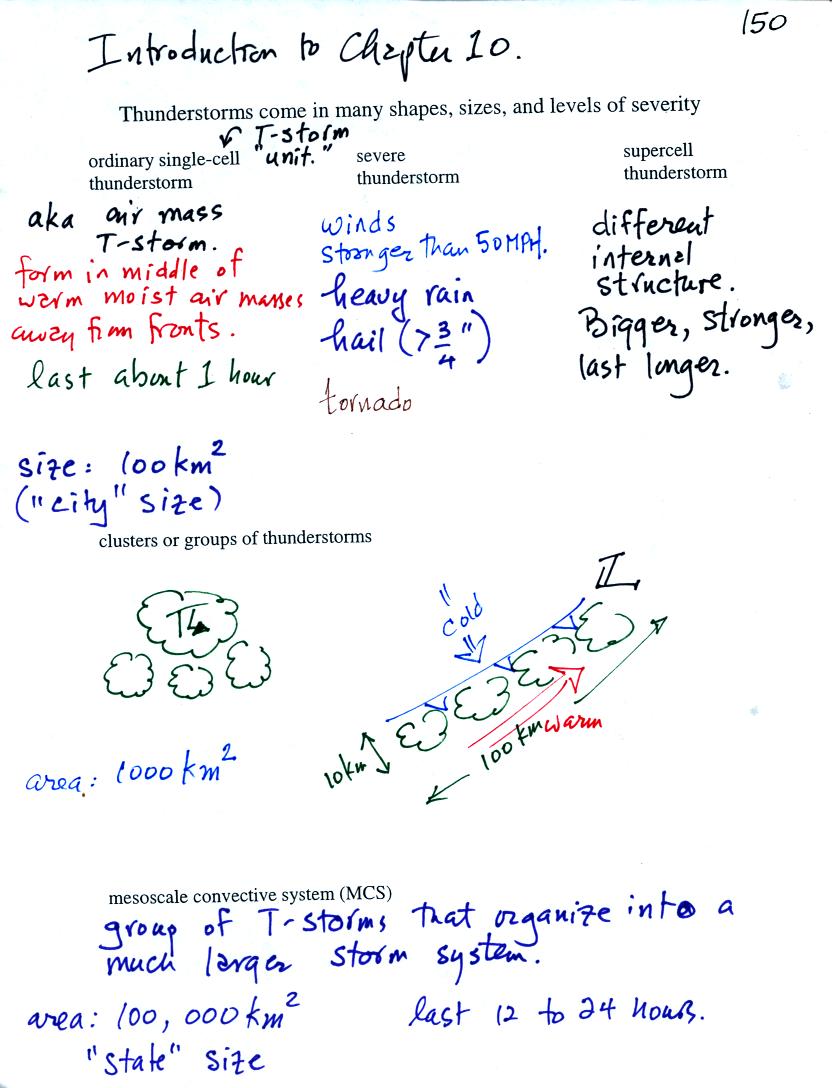
Some general information on different types of
thunderstorms. We will mostly be concerned with ordinary
single-cell thunderstorms
(also referred to as air mass thunderstorms).
The following two figures are a little involved. We will
take the
time and effort to try to understand this material so that we can
better appreciated a time lapse video of thunderstorm development.
Before
getting into the details it might be worth pointing out a couple of
things that you are going to be seeing over and over again.
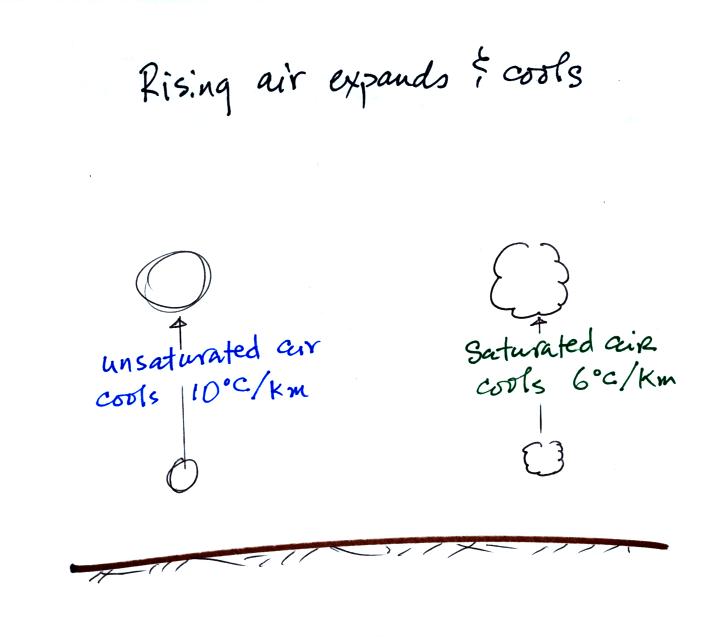
Rising air always expands and cools. It cools at
different rates depending on whether the air is saturated (RH=100%) or
unsaturated.
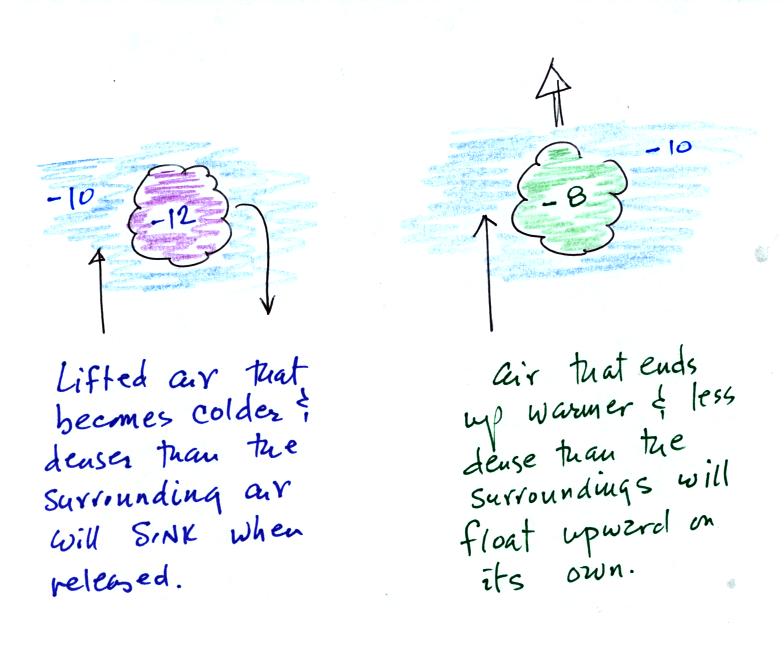
Rising air that becomes colder than the surroundings will
sink back to where it started from when released. If the rising
air becomes warmer than the surroundings it will float upward on its
own when released.
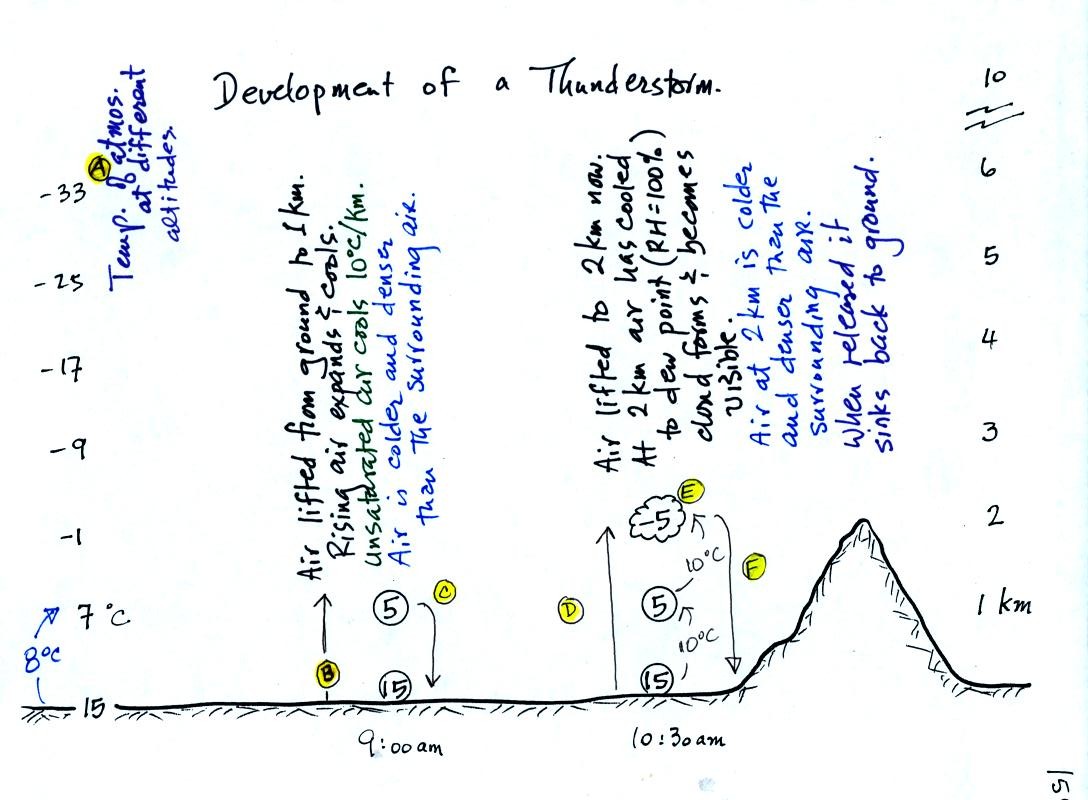
Refer back and forth between the lettered points in the
figure
above and the commentary below.
The numbers in Column A
show the temperature of the air in the atmosphere at various altitudes
above the ground (note the altitude scale on the right edge of the
figure). On this particular day the air temperature was
decreasing at a rate of 8 C per kilometer. This rate of decrease
is referred to as the environmental lapse rate. Temperature could
decrease more quickly than shown here or less rapidly.
Temperature in the atmosphere can increase with increasing altitude
(temperature inversion).
At Point B, some of
the surface air is put into an imaginary container, a parcel.
Then a meterological process of some kind lifts the air to 1 km
altitude. The rising air will expand and cool as it is
rising. Unsaturated (RH<100%) air cools at a rate of 10 C per
kilometer. So the 15 C surface air will have a temperature of 5 C
when it arrives at 1 km altitude. We assume that energy doesn't
flow back and forth between the air inside and outside the parcel (an
adiabatic process). You might begin to recognize some of these
terms from a 1S1P report on atmospheric stability earlier in the
semester.
At Point C note that
the air inside the parcel is slightly colder than the air outside (5 C
inside versus 7 C outside). The air inside the parcel will be
denser than the air outside and, if released, the parcel will sink back
to the
ground.
By 10:30 am the parcel is being lifted to 2 km as shown at Point D. It is still
cooling 10 C for every kilometer of altitude gain. At 2 km, at Point E the
air has cooled to its dew point temperature and a cloud has
formed. Notice at Point
F, the air in the parcel or in the cloud (-5 C) is still colder
and denser than the surrounding air (-1 C), so the air will sink back
to the ground and the cloud will disappear. Still no thunderstorm
at this point.
The next figure wasn't covered in
class on Wednesday. But I promised to go ahead and finish
it and stick it into the online notes before class on Friday so you
wouldn't have to wait until then to see how the story finished up.
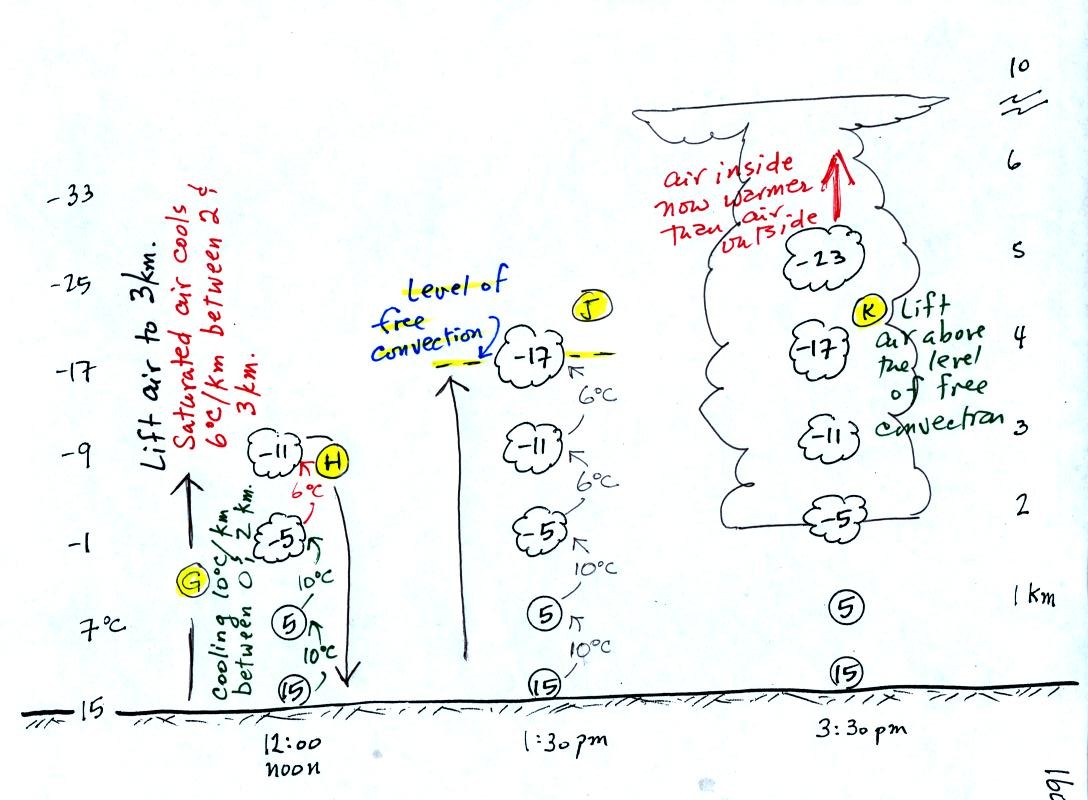
At noon, the air is lifted to 3 km. Because the air
became saturated at 2 km, it will cool at a different rate
between 2 and
3 km altitude. It cools at a rate of 6 C/km instead of 10
C/km. The saturated air cools more slowly because release of
latent heat
during condensation offsets some of the cooling due to
expansion. The air that arrives at 3km, Point H, is again still
colder than the
surrounding air and will sink back down to the surface.
By 1:30 pm the air is getting high enough that it becomes neutrally
bouyant, it has the same temperature and density as the air around it
(-17 C inside and -17 C outside). This is called the level of
free convection, Point J in the figure.
If you can somehow or another lift air above the level of free
convection it will find itself warmer and less dense than the
surrounding air as shown at Point K and will float upward to the top of
the troposphere on its own. The thunderstorm developed
only after getting above the level of free convection.


