Wednesday Oct. 4, 2006
The Optional Assignment #2 papers have been graded and were
returned in class. Answers to those
questions are now available online.
Some additional questions were added to Optional
Assignment #3. A few more questions will be added for
Friday's class. The assignment will be due at the beginning of
class next Monday.
The Quiz #2 Study Guide is now available
(in preliminary form) online.
The Experiment #2 reports (and the revised Expt. #1 reports) are due
next Monday.
Before reading through today's notes, have a look back at the end of Monday's notes. The last figure shows the
pattern of electric field arrows that would be found around a
positive charge. The electric field arrows show the direction and
strength of the force that would be exerted (by the center charge) on a
second positive charge placed anywhere in the pattern. You'll
also find a link to some sample questions about static electricity and
electric fields.
The
figures on p. 60 in the photocopied class notes have
been split into 3 pieces
below for clarity.
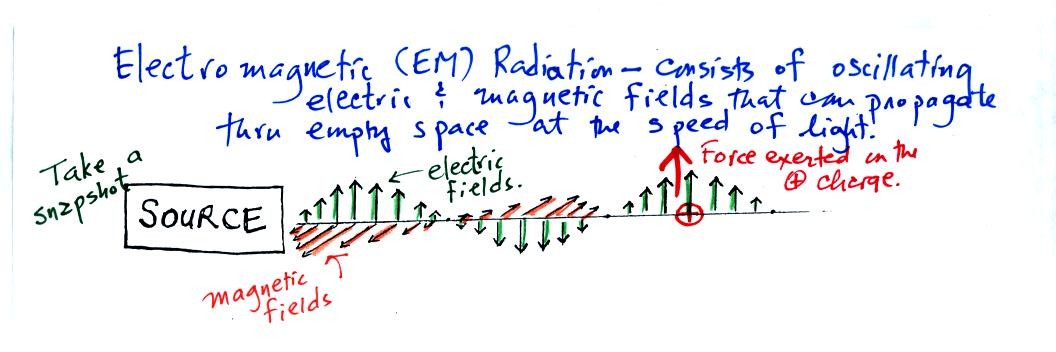
We imagine turning on a source of EM radiation and then a
short time
later we take a snapshot. The EM radiation is a wavy pattern of
electric and magnetic field arrows. We'll ignore the magnetic
field lines. The E field lines sometimes point up, sometimes
down. The pattern of arrows repeats itself.
Note the + charge near the right side of the picture. At the time
this
picture was taken the EM radiation exerts a fairly strong upward force
on the + charge.
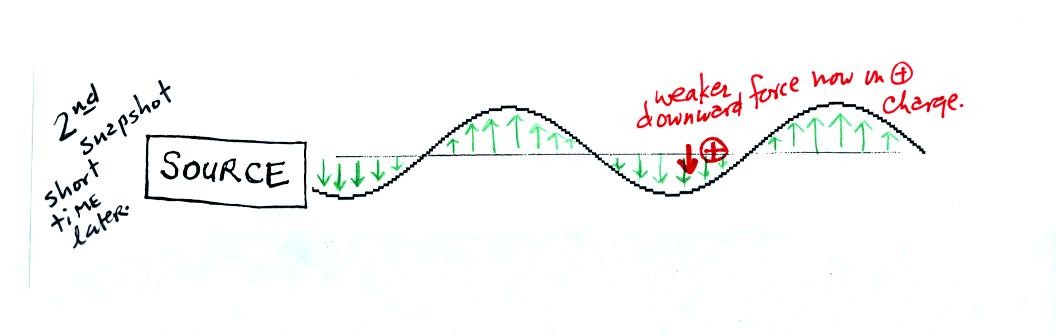
This picture was taken a short time later when the radiation
has
traveled a little further to the right. The EM radiation now
exerts a relatively weak downward force on the + charge.

The + charge is now being pushed upward again. A movie
of
the +
charge would show it bobbing up and down much like a swimmer in the
ocean would do as waves passed by.
The wavy pattern used to
depict EM radiation (the wavy line connects the heads of the electric
field arrows) can be described spatially in terms of its
wavelength,
the distance between identical points on the pattern.
Or you can
describe the radiation temporally
using the frequency of oscillation
(number of up and down cycles completed by an oscillating charge per
second)
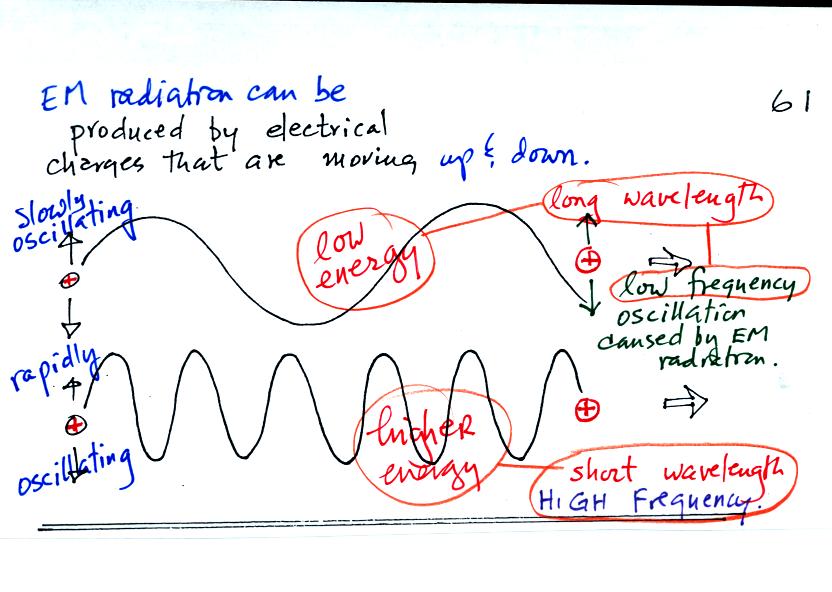
One of the ways of producing EM radiation is to move a charge up and
down. If you move a charge up and down slowly (upper left in the
figure above) you would produce long wavelength radiation that would
propagate out to the right at the speed of light. If you move the
charge up and down more rapidly you produce short wavelength radiation
that propagates at the same speed.
Once the EM radiation encounters the charges at the right side of the
figure above the EM radiation causes those charges to oscillate up and
down. In the case of the long wavelength radiation the charge at
right oscillates slowly. This is low frequency and low energy
motion. The short wavelength causes the charge at right to
oscillate more rapidly - high frequency and high energy.
The characteristics long wavelength - low frequency - low energy go
together. So do short wavelength - high frequency - high energy.
The figure above also shows how EM radiation can transport energy from
one place to another. You add energy when you cause the charges
at left to oscillate. The EM radiation then travels out to the
right (it could travel through empty space if necessary). Once
the EM radiation encounters an electrical charge, the charge start to
oscillate and the energy added at left reappears at right. Energy
has been carried from left to right.
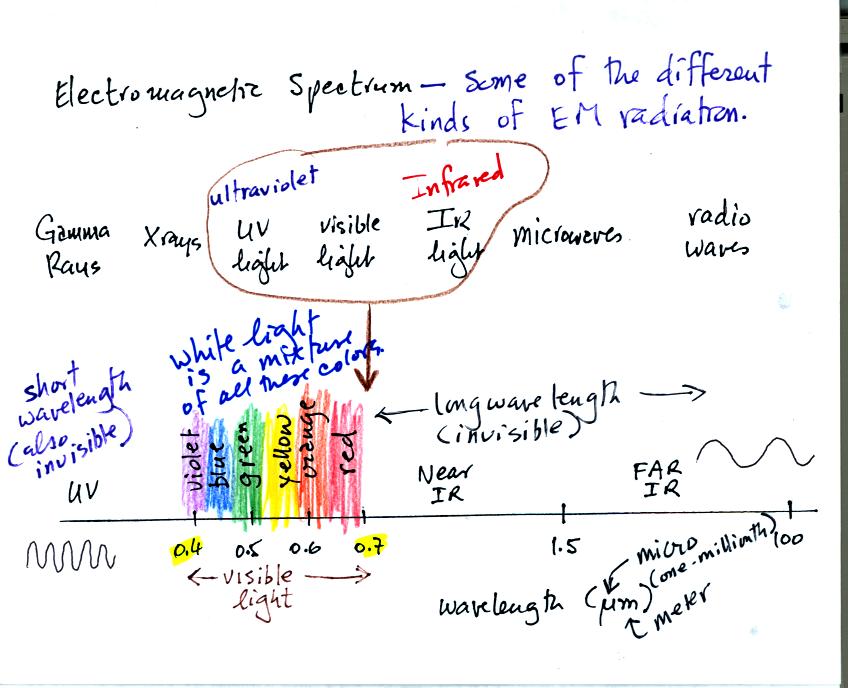
This is really just a partial list of some of the different types of EM
radiation. In the top list, shortwave length and high energy
forms of EM radiation are on the left (gamma rays and X-rays for
example). Microwaves and radiowaves are longer wavelength, lower
energy forms of EM radiation.
We will mostly be concerned with just ultraviolet light (UV), visible
light (VIS), and infrared light (IR). Note the micrometer
(millionths of a meter) units used for wavelength. The visible
portion of the spectrum falls between 0.4 and 0.7 micrometers (UV and
IR light are both invisible). All of the vivid colors shown above
are just EM radiation with slightly different wavelengths. WHen
you see all of these colors together, you see white light.

Unless an object is very cold (0 K) it will emit EM
radiation. All the people, the furniture, the walls and the floor
in the classroom are emitting EM radiation. Often this radiation
will be invisible so that we can't see it and weak enough that we can't
feel it. Both the amount and kind (wavelength) of the emitted
radiation depend on the object's temperature.
The Stefan Boltzmann law allows you to determine the amount of energy
emitted per unit area per second (calories emitted per square
centimeter per second for example). Don't worry about the units,
you can think of this as amount, or rate, or intensity.
Don't worry about σ either, it is just a
constant. The amount depends on temperature to
the fourth
power. If the temperature of an object doubles the amount of
energy emitted will increase by a factor of 2 to the 4th power
(that's 2 x 2 x 2 x 2 = 16). A hot object just doesn't emit a
little more energy than a
cold object it emits a lot more energy than a cold object.
The third rule tells you something about the kind of radiation emitted
by an object. We will see that objects usually emit radiation
over a range of wavelengths. The third rule, Wien's law, allows
you to calculate "lambda max" the wavelength of peak emission. An
object will emit more radiation at this wavelength than at any other
wavelength.
The next picture (a little different from the one drawn in class, it
was redrawn to make it clearer) might make these rules a little
clearer. This graph compares the radiation emitted by a cold and
a hot object.

We'll start with the cold object (the blue shaded curve). It is
emitting radiation over a range of wavelengths. All the
wavelengths aren't being emitted in equal amounts. You can see
that lambda max is the peak of the emission curve. The blue
shaded area under the curve is the total energy emitted by the cold
object.
The hot object also emits radiation over a wide range of wavelengths
(those emitted by the cold object and then some more). Lambda max
for the hot object has shifted to shorter wavelength as predicted by
Wien's Law (as T gets larger, the ratio 3000/T gets smaller). The
area under the hot object curve is much larger than the area under the
cold object curve. This is the Stefan Boltzmann law in
action. The hot object will emit a lot more radiation than the
cold object.

The object that will be emitting the radiation is the tungsten filament
in a 200 W bulb. We start with the bulb turned off. The
filament will be at room temperature which we will assume is around 300
K. The bulb will be emitting radiation (note the small curve
above labelled room temp). The radiation is very weak so we can't
feel it. It is also long wavelength far IR radiation (lambda max
about 10 micrometers) so we can't see it. But, believe me, it is
there.
Next we use the dimmer switch to just barely turn the bulb on.
The bulb wasn't very bright at all and had an orange color. This
is curve 1 in the figure. Note the far left end of the curve has
moved left of the 0.7 micrometer mark - into the visible portion of the
spectrum. That is what you are able to see the small, the portion
of the radiation emitted by the bulb that is visible light (but just
long wavelength red and orange light). Most of the radiation
emitted by the bulb is to the right of the 0.7 micrometer mark and is
invisible IR radiation (it is strong enough now that you could feel it).
Finally we turn on the bulb completely. The filament temperature
is now about 3000K. The bulb is emitting a lot more visible
light, all the colors, though not all in equal amounts. The bulb
was also much brighter. The mixture of the colors produces a warm
white light. It is warm because it is a mixture that contains a
lot more red, orange, and yellow than blue, green, and violet
light. It is interesting that most of the radiation emitted by
the bulb is still in the IR portion of the spectrum. This is
invisible light. A tungsten bulb like this is not especially
efficient, at least not as a source of visible light.