Monday Oct. 16, 2006
The Experiment #2 reports were returned in class today. Revised
reports are due in two weeks, on Mon. Oct. 30. Please return the
original draft with your revised report.
The Surface Weather Map Analysis worksheet (part of 1S1P Assignment
#2b) was handed out in class. 1S1P
Assignment #2a reports are due
Friday this week (Oct. 20), the Assignment #2b
reports are due next
Monday (Oct. 23).

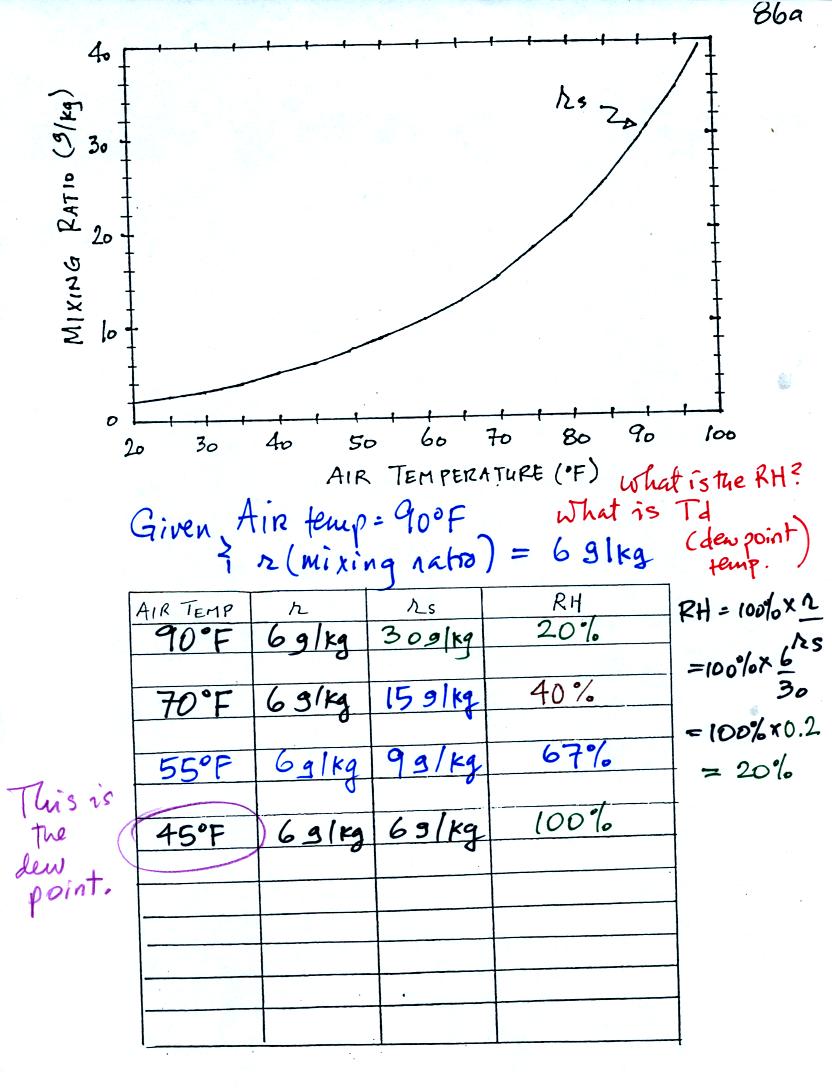
Saturation mixing ratio values as a function of air
temperature. The data are listed in a table and plotted on a
graph.
The beakers are meant to show graphically the relative amounts of water
vapor that air at different temperatures can contain. Don't get
the idea that you could evaporate 2 L of water into a kilogram of 90 F
air. The 90 F air couldn't contain anywhere near that much water
vapor. What the 90 F beaker does show is that 90 F air can
contain twice as much water vapor as 70 F air.
Now we'll
work a series of humidity problems. By doing this you should
begin to get a better feeling for what the various humidity variables
are and how they work. Pay particular attention to what causes
them to change.
Here is the first sample problem that we worked in
class.
You might have a hard time unscrambling this if you're seeing it for
the first
time. The series of steps that we followed are retraced
below:
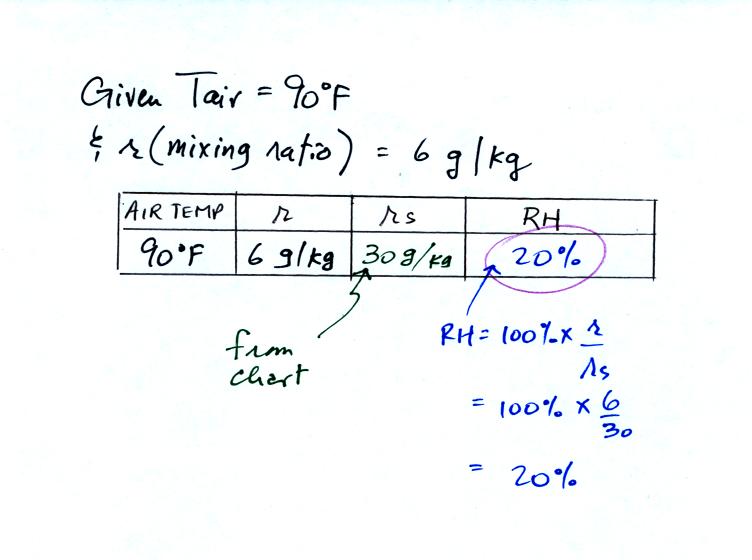
We're given an air temperature of 90 F and a mixing ratio (r) of 6
g/kg. We're first supposed to find the relative humidity (RH).
We start by entering the data we were given in the
table. Once
you know the air's temperature you can look up the saturation mixing
ratio value; it is 30 g/kg for 90 F air. 90 F air could
potentially hold 30 grams of water vapor per kilogram of dry air (it
actually contains 6 grams per kilogram in this example).
Once you know mixing ratio and saturation mixing ratio you can
calculate the relative humidity.
The numbers we just figured out are shown on the top line
above.
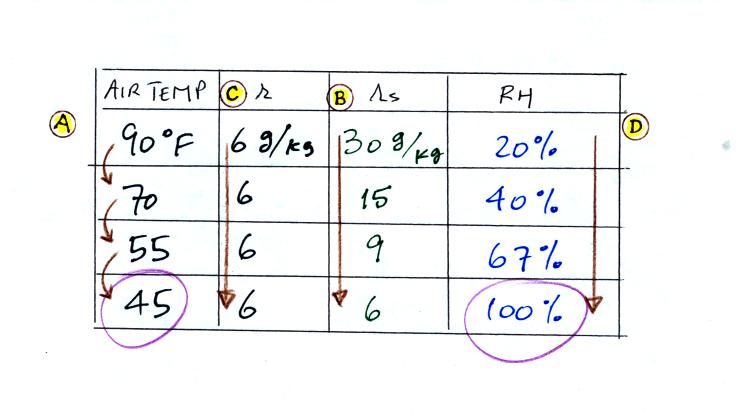
(A) We imagined cooling the air from 90F to 70F, then to 55F, and
finally to 45F.
(B) At each step we looked up the saturation mixing ratio and entered
it on the chart. Note that the saturation mixing ratio values
decrease as the air is cooling.
(C) The mixing ratio doesn't change as we cool the air. The only
thing that changes r is adding or removing water vapor and we are doing
neither.
(D) Note how the relative humidity is increasing as we cool the
air. The air still contains the same amount of water vapor it is
just that the air capacity is decreasing.
Finally at 45 F the RH becomes 100%. The dew point temperature in
this problem is 45 F.
What would happen if we cooled the air further still, below the dew
point temperature (the next
figure was not shown in class)

35 F air can't hold the 6 grams of water vapor
that 45 F air can. You can only "fit" 4 grams of water vapor into
the 35 F air. The remaining 2 grams would condense. If
this happened at ground level the ground would get wet with dew.
If it happens above the ground, the water vapor condenses onto small
particles in the air and forms fog or a cloud. Now because water
vapor is being taken out of the air (and turned into water), the mixing
ratio will decrease from 6 to 4.

In many ways this is liking squeezing a moist sponge (squeezing the
sponge and reducing its volume is like cooling moist air and reducing
the saturation mixing ratio). At first when you sqeeze the sponge
nothing happens, no water drips out. Eventually you get to a
point where the sponge is saturated. This is like reaching the
dew point. If you squeeze the sponge any further (or cool below
the dew point) water will begin to drip out.
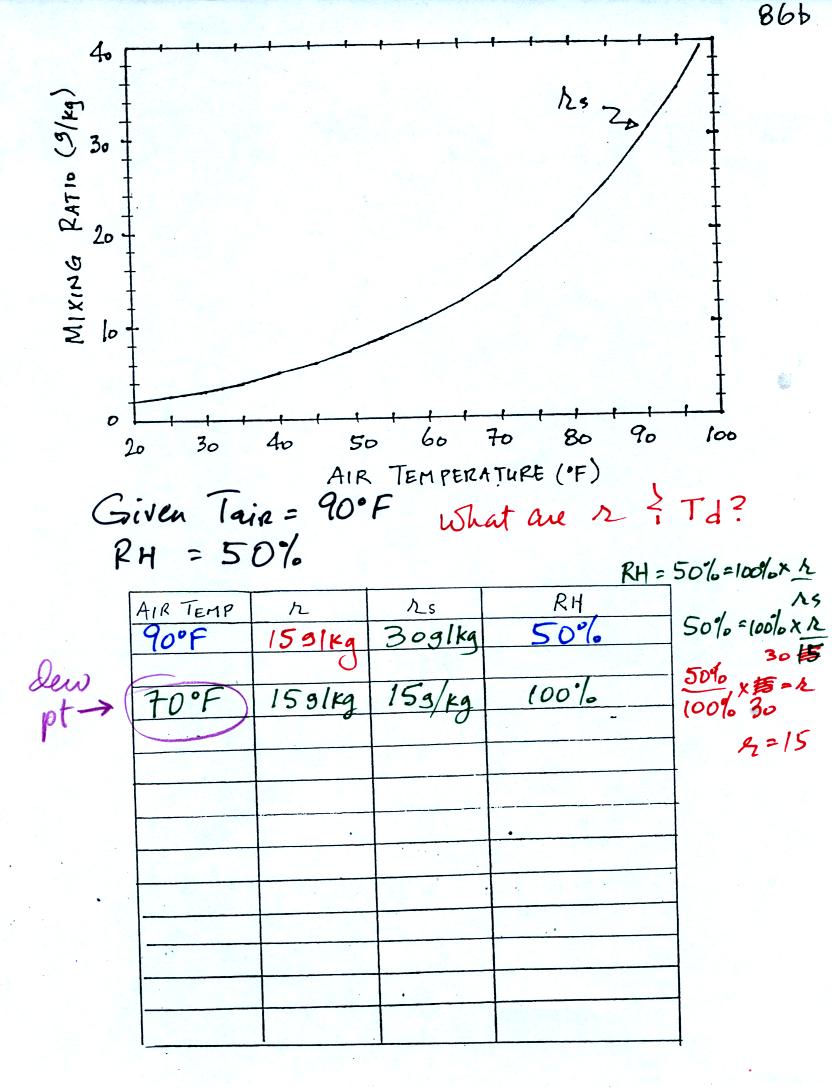
Here is the second sample problem. Given an air temperature
of 90
F and a relative humidity of 50% you are supposed to figure out the
mixing ratio (15 g/kg) and the dew point temperature (70 F). The
problem is worked out in detail below.

First you fill in the air temperature and the RH data that
you are
given. Since you know the air's temperature you can look up the
saturation mixing ratio (30 g/kg). Then you can substitute into
the relative humidity formula and solve for the mixing ratio (15 g/kg).

Finally you imagine cooling the air. Cooling causes
the
saturation mixing ratio to decrease, the mixing ratio stays constant,
and the relative humidity increases. In this example the RH
reached 100% when the air had cooled to 70 F. That is the dew
point temperature.
There's
something you can learn from these first two examples.

In the first
example the RH was low and the difference between the air and dew point
temperatures was large. In the second example, the RH was higher
and the difference between the air and dew point temperatures was
smaller. If there were no difference between the air and dew
point temperature the RH would be 100%.
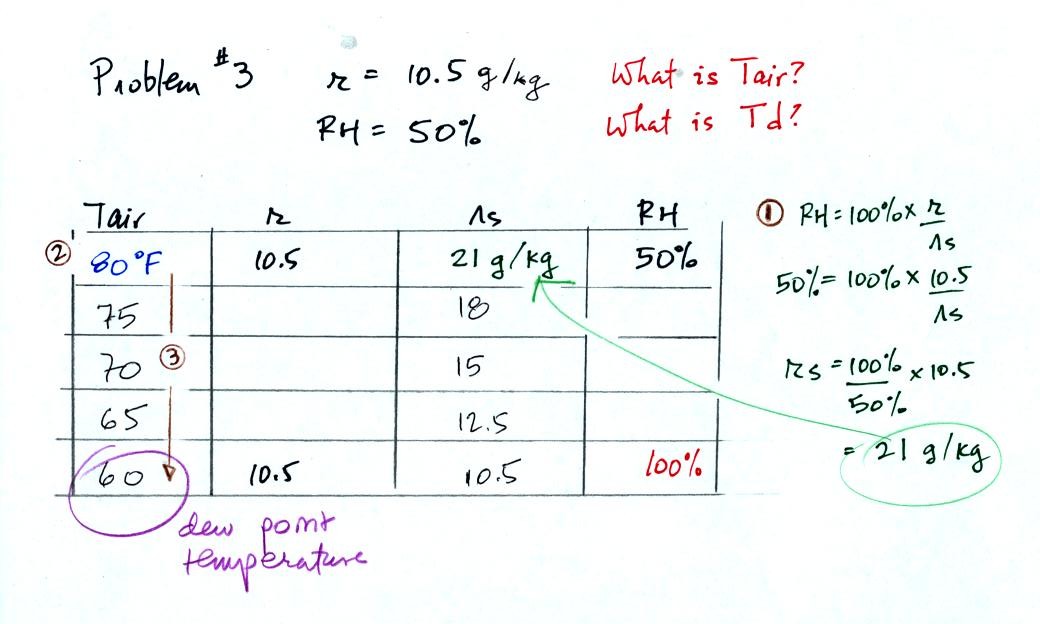
In the 3rd problem we started with RH=50% and r=10.5
g/kg.
The air contains 10.5 g/kg of water vapor, this is 50% of what the air
could potentially hold. So the air's capacity, the saturation
mixing ratio must be 21 g/kg. Once you know the saturation mixing
ratio you can look up the air temperature in a table. Then you
imagine cooling the air until the RH becomes 100%. This occurs at
60 F. The dew point is 60 F.
Now the
last problem.
We're given an air temperature of 90 F and a dew point temperature of
50 F. We need to determine the mixing ratio and the relative
humidity.

We enter the two temperatures onto a chart and look up the saturation
mixing ratio for each.

Then we know that if we cool the 90 F air to 50 F the RH will
become
100%. Since we know the saturation mixing ratio value at 50 F is
7.5 g/kg we can say the mixing ratio is 7.5 g/kg.

Remember back to the three earlier examples. When we cooled air
to the the dew point, the mixing ratio didn't change. So the
mixing ratio must have been 7.5 all along. Once we know the
mixing ratio in the 90 F air it is a simple matter to calculate the
relative humidity.