Monday Oct. 30, 2006
The Experiment #3 reports, the Scientific Paper reports, and the revised
Expt. #2 reports were all collected today. The Expt. #3 and the
Scientific Paper reports will be graded in about 1 week. The
revised reports may take a little longer.
Mid term grade summaries and more of the 1S1P reports were returned today
also.
A printed copy of the Quiz #3 Study Guide
was handed out in class. Quiz #3 is on Wednesday this week.
Reviews will be held Monday and Tuesday afternoon (see the study guide
for times and locations)
We have a
few odds and ends to finish up today. We'll start with weather
radar. Satellite photographs are a good way of observing clouds
(especially out over the ocean). By using both visible and
infrared light satellite photographs you can get a good idea of cloud
type (as we will see later in today's class). However satellite
photographs don't really tell you whether a cloud is producing
precipitation or not.
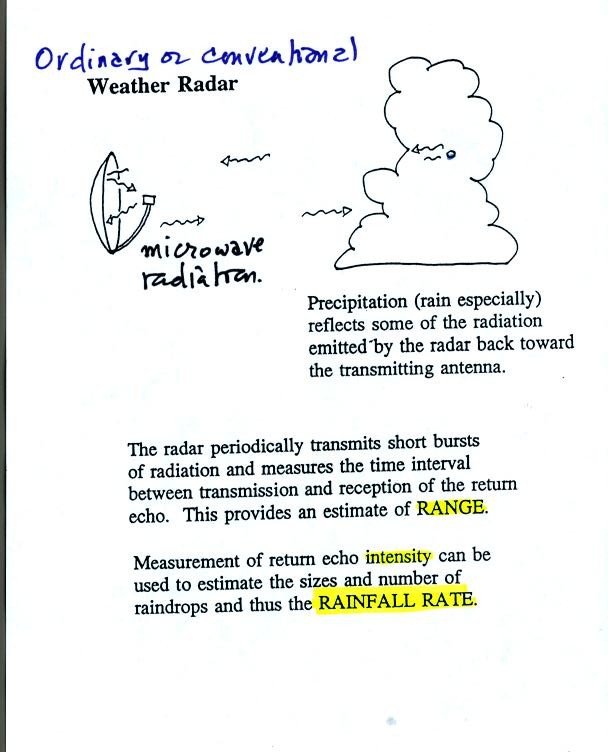
An ordinary radar periodically transmits a short burst of microwave
radiation. This radiation penetrates a cloud but is reflected by
precipitation particles. The radar keeps track of what direction
the antenna is pointing and determines how long it takes for a signal
to go out and return. The radar also measures the strength of the
return signal. Conventional radar can thus locate the
precipitation and provide an estimate of its intensity.
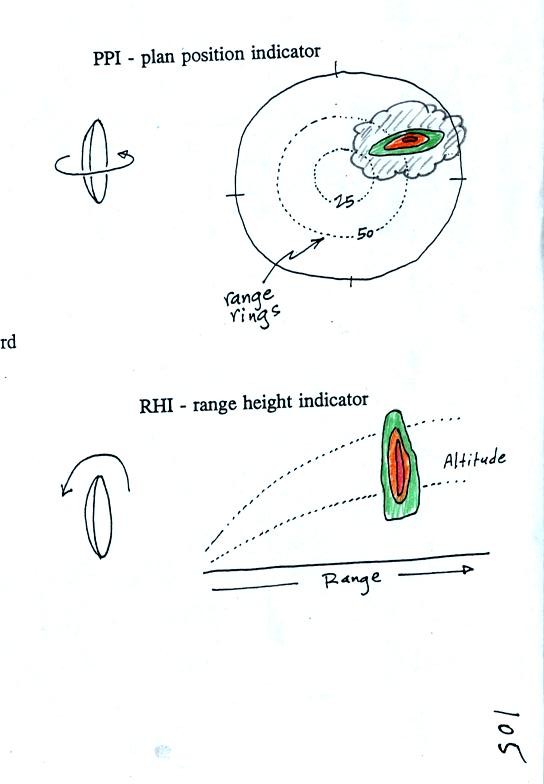
The radar antenna slowly spins as it is transmitting so it scans a full
360 degrees in a minute or two.
Information from a single radar or a combination of data from many
radars are drawn on weather maps (the PPI display above shows the data
from a single radar, the radar would be at the center of the
picture). This would show where precipitation is occurring.
The radar data is often combined with satellite photographs.
Colors are used to indicate the intensity of the precipitation.
Yellows, oranges and reds generally indicate the heaviest precipitation
(often coming from thunderstorms).
In research the radar can be used to scan vertically through a storm,
this produces an RHI display.
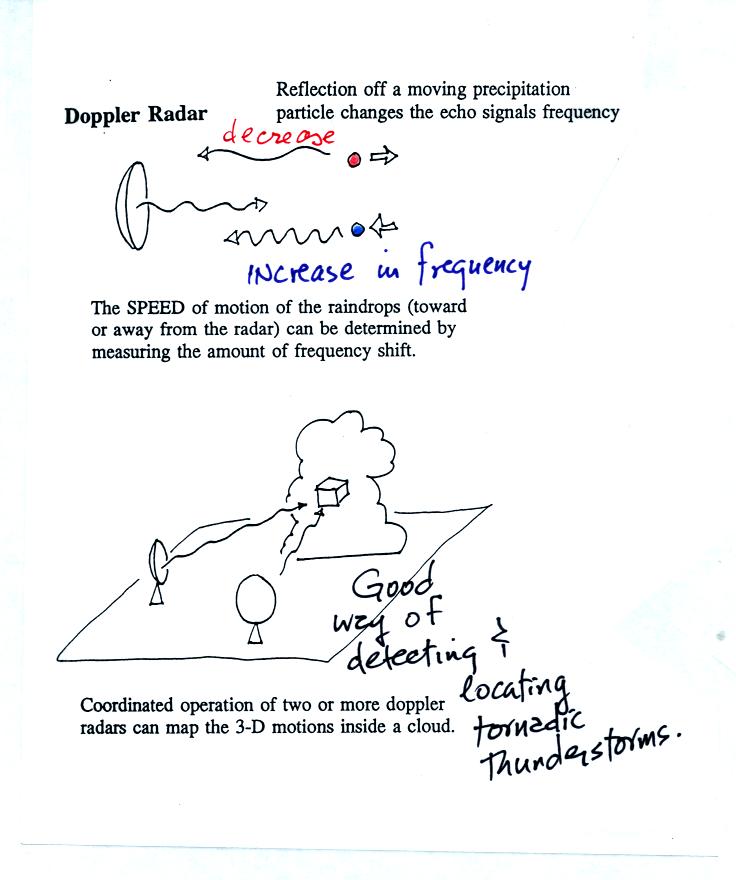
By detecting changes in the frequency of the reflected signal, a
doppler radar can measure the speed at which precipitation particles
are moving toward or away from a radar antenna. By combining data
from 2 or more radars (and some complicated computer processing),
three-dimensional wind motions inside a cloud can be mapped out.
Doppler radars can detect a rotating thunderstorm updraft (a
mesocyclone) that could indicate a thunderstorm capable of producing
tornadoes. Small mobile doppler radars are being used to try to
measure wind speeds in tornadoes. Police use doppler radar to
measure the speeds of automobiles on the highway.
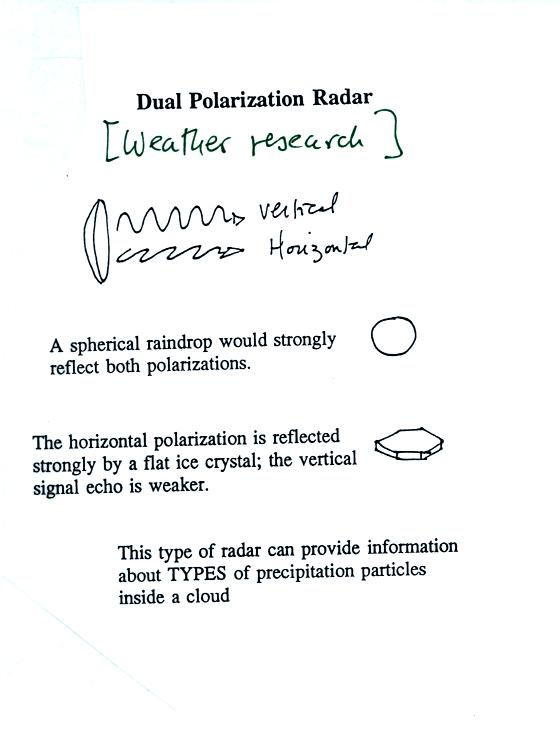
Radar can also be used to learn something about the kinds of
precipitation particles inside a cloud.
Next we
looked briefly at the three types of
satellite photographs and what they tell you about clouds or wind
motions in the atmosphere. You'll find these discussed on pps
99-100 in the photocopied class notes. You'll also find this
topic discussed on pps 236-240 (pps 233-237 in the 3ed) in the text
(Chap. 9).

An infrared satellite photograph detects the IR radiation
actually
emitted by clouds. You don't depend on seeing reflected
sunlight, so clouds can be photographed during the day and at
night. Because the satellite detects 10 micrometer radiation, IR
radiation emitted by the ground is also visible in regions where there
aren't any clouds.
White on an IR photograph means the top radiating surface
of the cloud is cold (found at high altitude). It is sometimes
hard to distinquish the tops of strong thunderstorms from high altitude
cirrus or cirrostratus clouds even though the clouds are very
different. Warm, low level
clouds appear grey. A grey unimpressive looking cloud on an IR
satellite photograph may actually be a thick nimbostratus cloud that is
producing a lot of rain or snow.
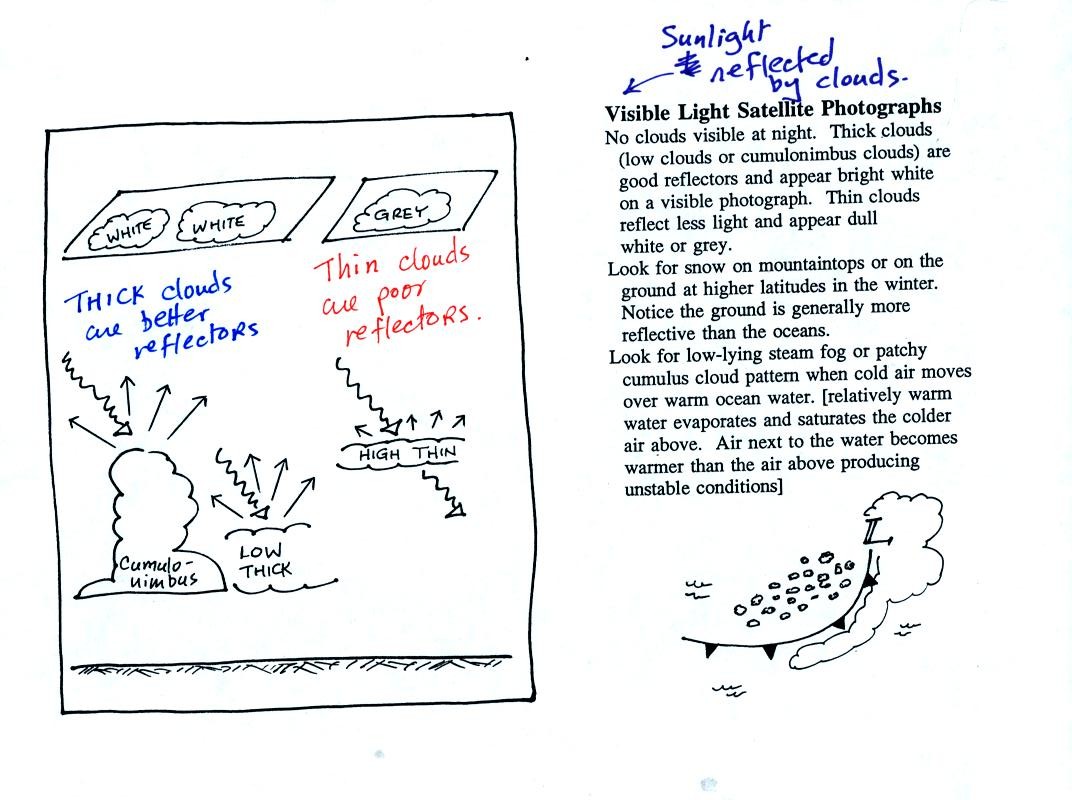
Thick clouds produce a white image on a visible satellite
photograph. Thin clouds appear grey. Note a thunderstorm
appears white on both IR and VIS satellite photographs. By
comparing images of clouds on both visible and IR images you can begin
to distinquish between different kinds of clouds.
The origin of the patchy cloud pattern seen behing cold fronts that are
out over the ocean is shown below. This figure wasn't shown in class.
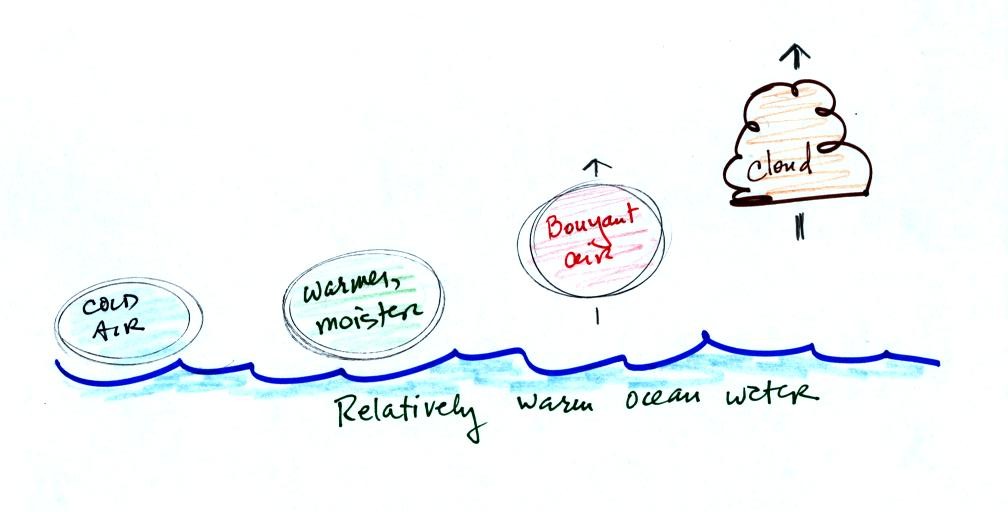
Cold air warms and is moistened as it passes over
warmer
ocean
water. The air can eventually become bouyant and rise enough that
a cloud forms. Clouds develop best when there is a big
temperature difference between the air and the water. This is
essentially the same as the Lake Effect you may have read about if you
did a 1S1P report on air masses.
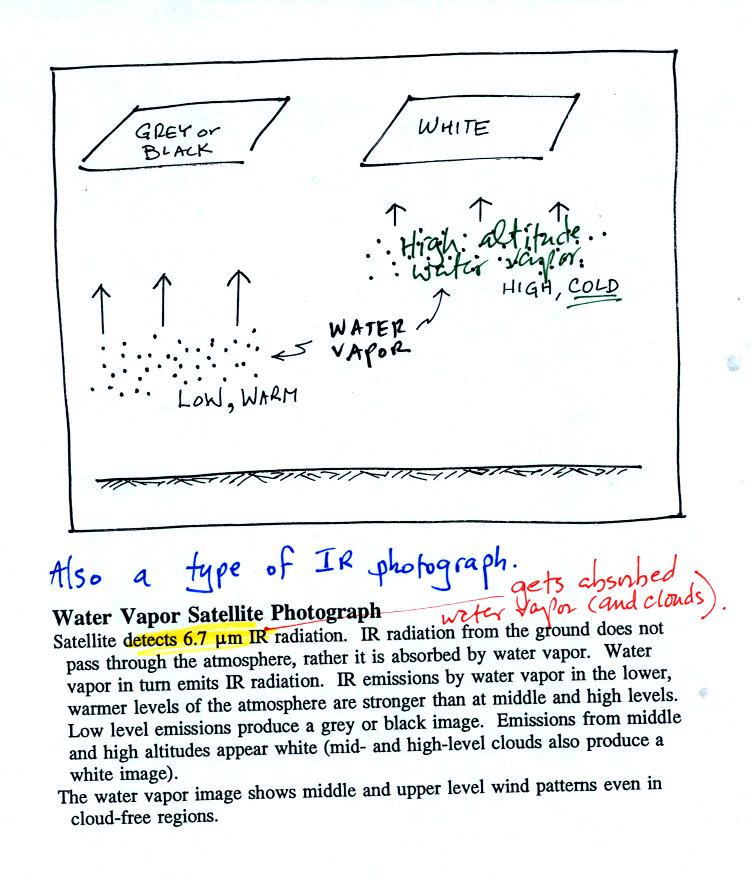
A water vapor satellite photograph is similar to an IR
satellite photo (both types photograph IR radiation). In this
case both water vapor and clouds emit IR radiation (it is a slightly
different wavelength than in a normal IR photograph) that is detected
and
displayed by the satellite. Water vapor found at low altitude is
warm and appears grey on the photograph (often hard to see on the
satellite photograph). High altitude water
vapor is cold and appears white. But remember the high altitude
air is cold and there isn't much water vapor up there. These
photographs show air motions in regions where there aren't any clouds,
motions that would otherwise be invisible.
Now that you have read through this information on satellite
photographs, here is a sample
satellite photograph question.
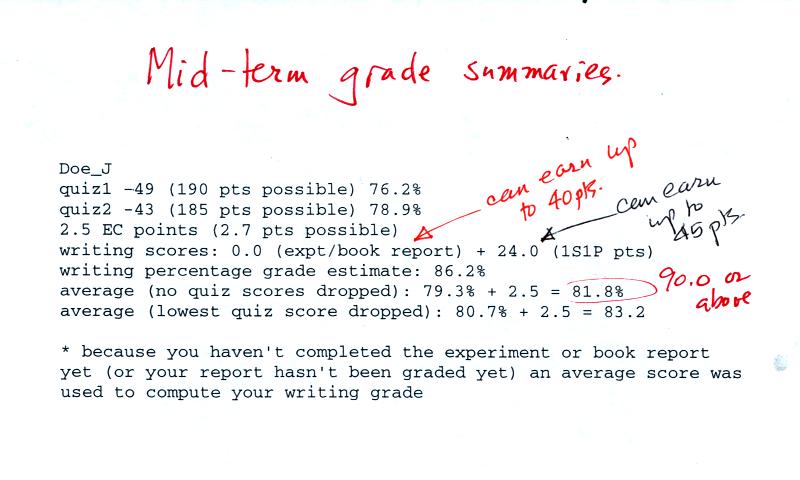
As mentioned above, grade summaries were distributed in class.
You should first check to see that quiz grades have been recorded
correctly and that you have been given credit for the optional
assignments, 1S1P reports (not all of the Assignment #2 reports have been
graded), and experiment/book reports that you have turned in.
The computer has also tried to predict what grade you will end up with
at the end of the semester if you keep performing as you have been so
far this semester (it uses an average report grade if you haven't yet
turned in an experiment report or your report hasn't been graded
yet). There is a little "guesswork" involved here, these really
are grade estimates. Your grade can improve or could get worse
between now and the end of the semester.
We
finished up with some of the material on Newton's Laws of Motion in
Chapter 6 that we will be covering after the next quiz. This material
will not be covered on Quiz #3 and will
be moved to the Friday Nov. 3 notes.