Monday, Sept. 11, 2006
"Storm Clouds" on the horizon (i.e. various things that are
due or coming due in the not too distant future)
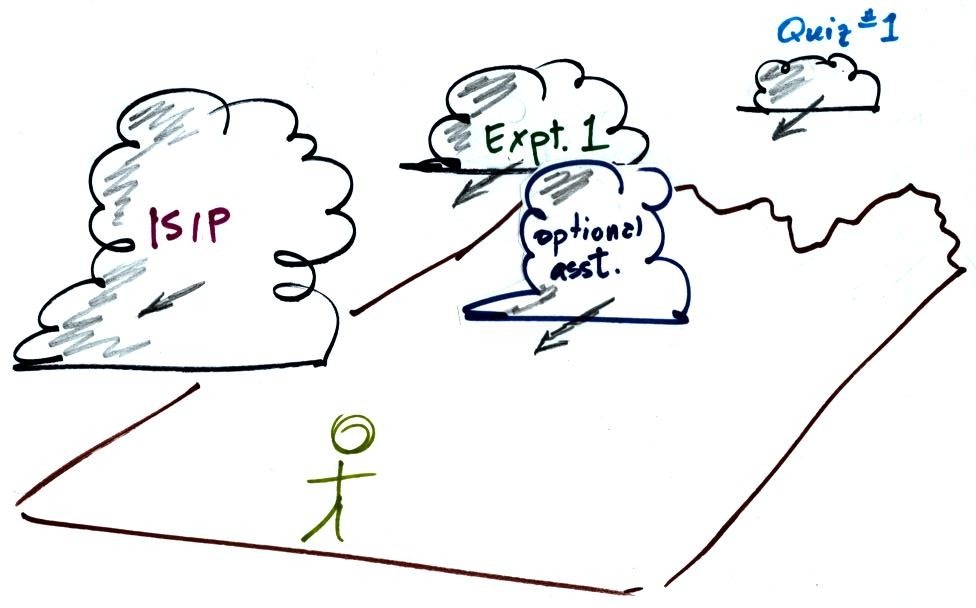
The 1S1P reports were collected
today. It will take some time to grade all these
reports. You should expect to start seeing some of the reports
being returned next week.
The Optional Assignment is due Friday (extra copies still available)
The Experiment #1 reports are due next
Monday. You should complete the experiment and return
your materials this week.
Quiz #1 is Wednesday next week (Sept. 20). The Quiz #1 Study
Guide should appear about mid-week.
Now don't get discouraged and think that there are only black clouds
headed our way. There are some good things coming this week
also. Here is one
of them, here is another.
The
following wasn't covered in class.
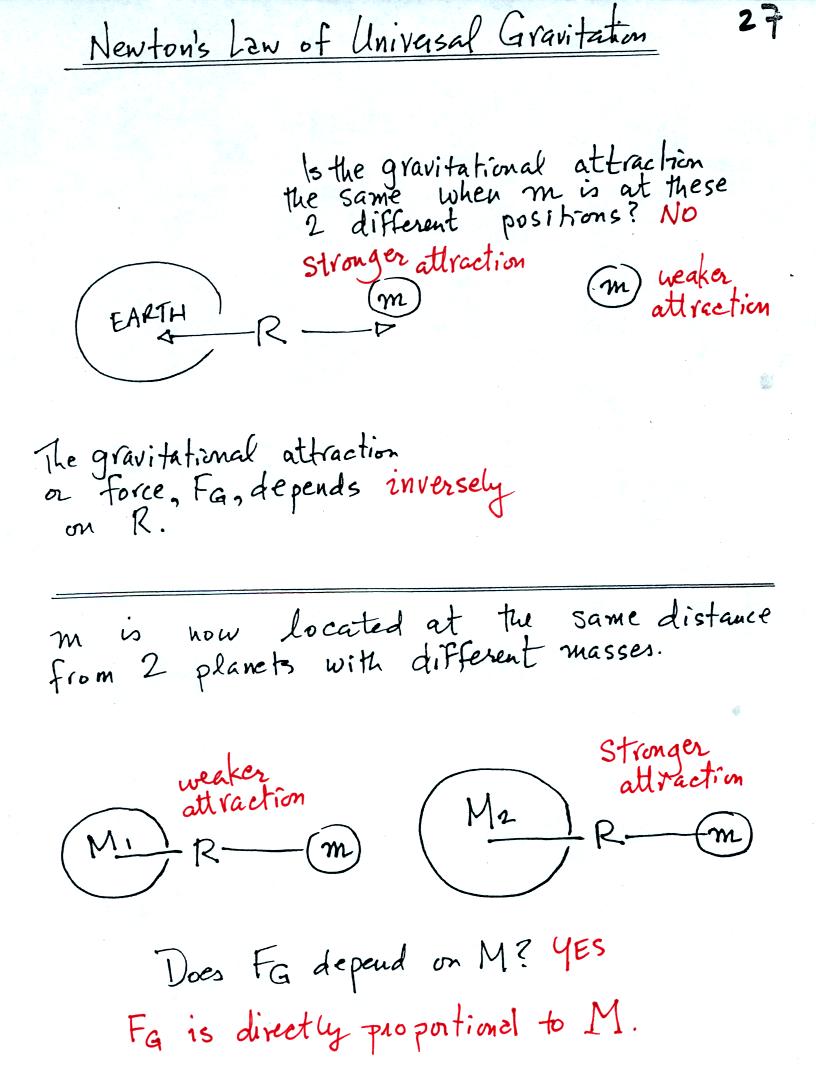
The gravitational attraction between two objects depends first of all
on the distance separating the objects. The gravitational
force becomes weaker the further away the two objects are from each
other. In the bottom
picture above and the top figure below we see that the attractive force
also depends on the masses of the two objects.
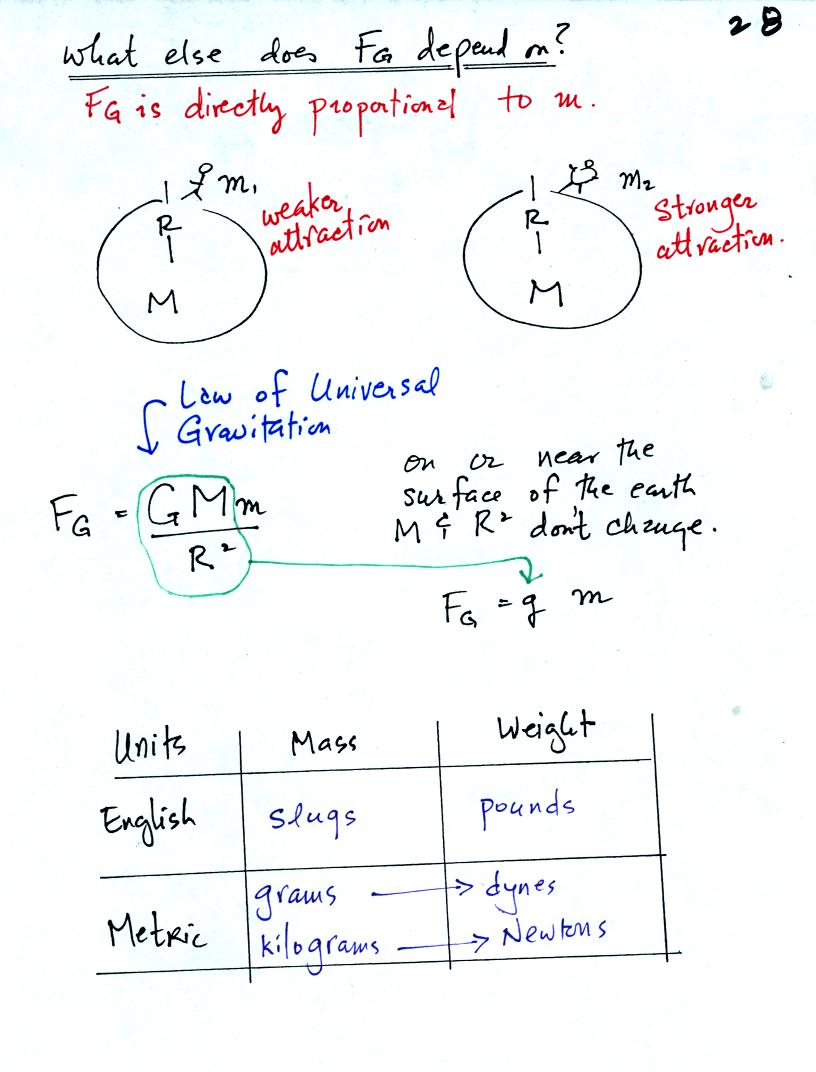
The complete formula is shown in the middle of the page above. G
is a constant. On the surface of the earth G, M, and R don't
change. The gravitational acceleration, g, is just G times Mearth
divided by ( Rearth )2
.
Down at the bottom of the page are the Metric and English units of mass
and weight.
You'll
find the following material discussed on p. 29 in the photocopied
notes. In 3 simple steps you can understand how a barometer works. It
is probably worth mentioning that barometers are used to measure
pressure (atmospheric pressure). It is not coincidence that the
word bar that appears in barometer
is the same bar that appears in millibars. We will be
learning about weather maps next week and will come across isobars, contours of pressure.
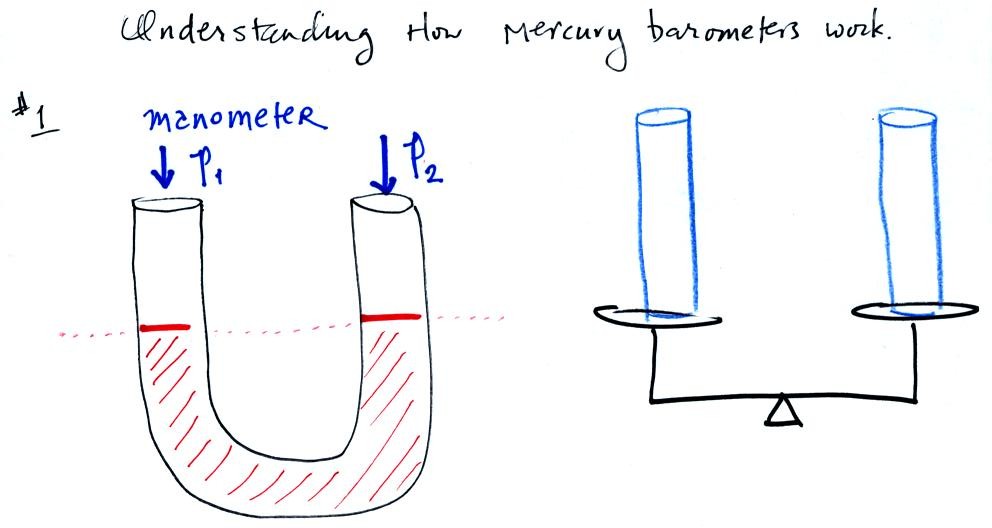
A manometer can be used to measure pressure difference. The
manometer is just a u-shaped tube usually made of glass so that you can
see the liquid that is inside. The liquid can slosh back and
forth just like the pans on a balance can move up and down. A
manometer really behaves just like a pan balance.
In this picture the fact that the liquid levels are the same in the
right and left tubes means P1 and P2 are the same (note you really
don't know what P1 and P2 are, just that they are equal).
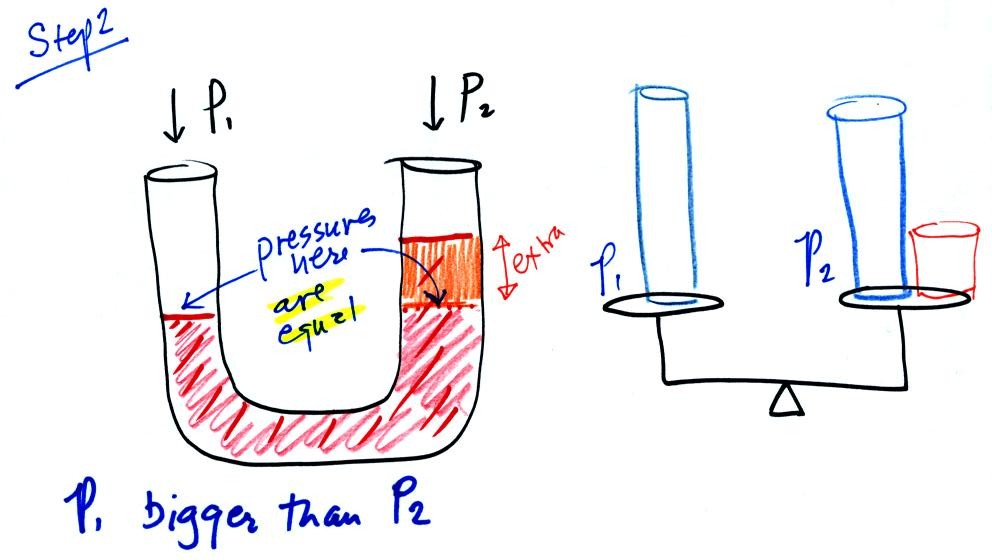
Now the situation is a little different, the liquid levels
are no
longer equal. The orange shaded portion of the liquid is the
balance that we had in the previous picture. The pressures at the
levels of the two blue arrows are equal (the red shaded fluid is the
balance). P2 is not able by itself to balance P1, P2 is lower
than
P1. P1 plus the pressure produced by the column of extra liquid
on the right balances P1. The height of the column of extra
liquid provides a measure of the difference between P1 and P2.
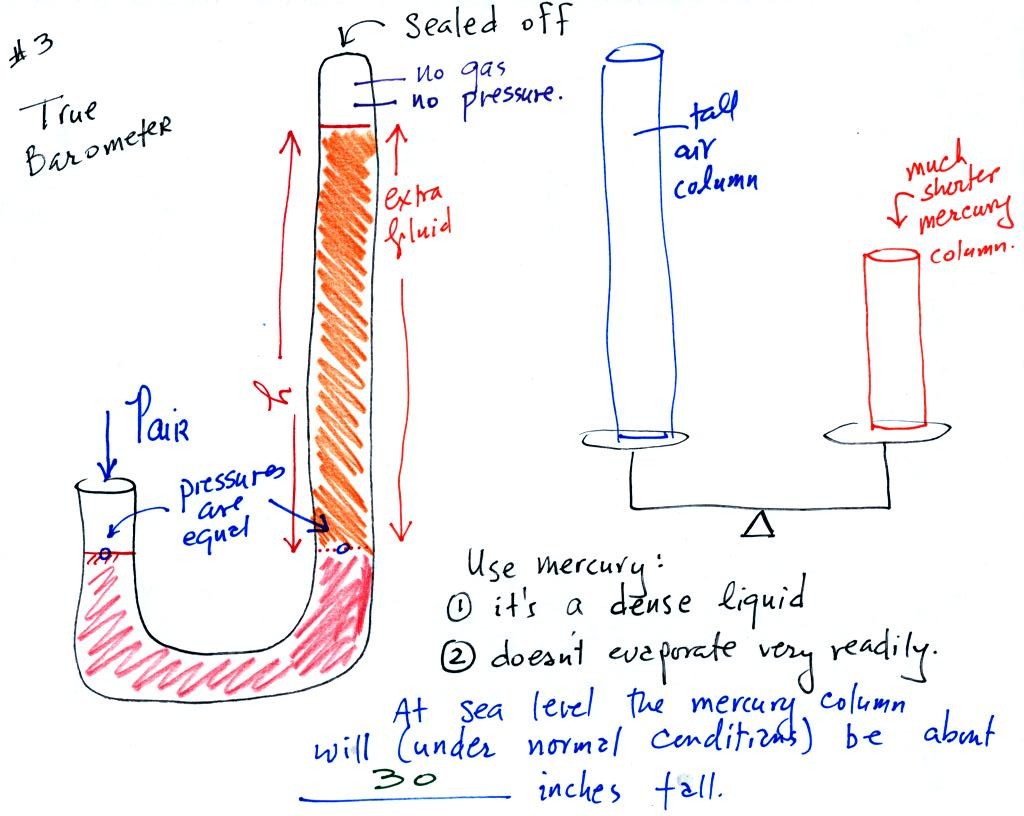
We have changed the manometer by lengthening the right tube
and sealing
it off at the top. Air pressure can't get into the right tube any
more. The balance is again shaded in orange at the bottom of the
barometer. Pressures at the two blue arrows indicated
are equal.
Pair is equal to the pressure produced by the column h inches tall on
the right. If Pair changes, h will change. You now a way of
measuring and monitoring the atmospheric pressure.
Barometers like this are usually filled with mercury. Mercury is
a liquid. You need a liquid that can slosh back and forth in
response to changes in air pressure. Mercury is also dense which
means the barometer won't need to be as tall as if you used something
like water. A water barometer would need to be over 30 feet
tall. With mercury you will need only a 30 inch tall column to
balance the weight of the atmosphere at sea level under normal
conditions (remember the 30 inches of mercury pressure units mentioned
in class a week or so ago). Mercury also has a low rate of
evaporation so you don't have much mercury gas at the top of the right
tube.
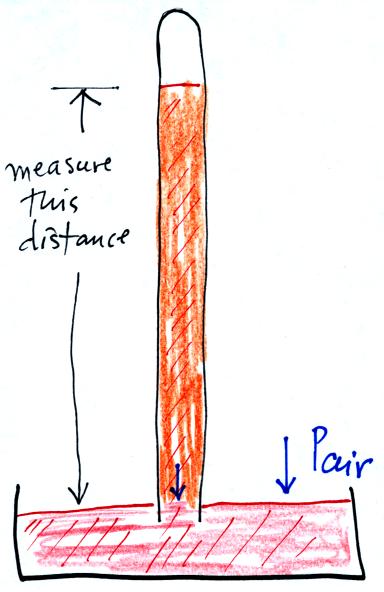
Finally here is a more conventional barometer design. The bowl of
mercury is usually covered in such a way that it can sense changes in
pressure but not evaporate and fill the room with poisonous mercury
vapor.
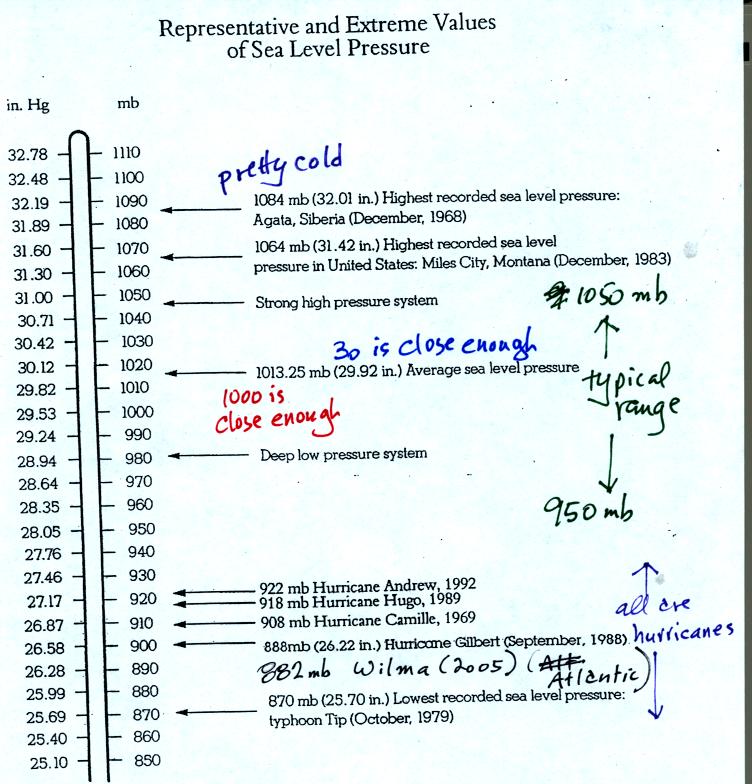
Under normal conditions sea level pressure is about 1000 mb (about
30
inches of mercury). It can be higher and lower than this but
usually falls in the range 950 mb to 1050 mb. Record high and low
sea level pressure values are shown in the chart. Note the record
low values have all be observed in hurricanes.
Hurricane Wilma set a new low sea level pressure reading (882 mb) last
year for the Atlantic. At the time the winds were 185 MPH.
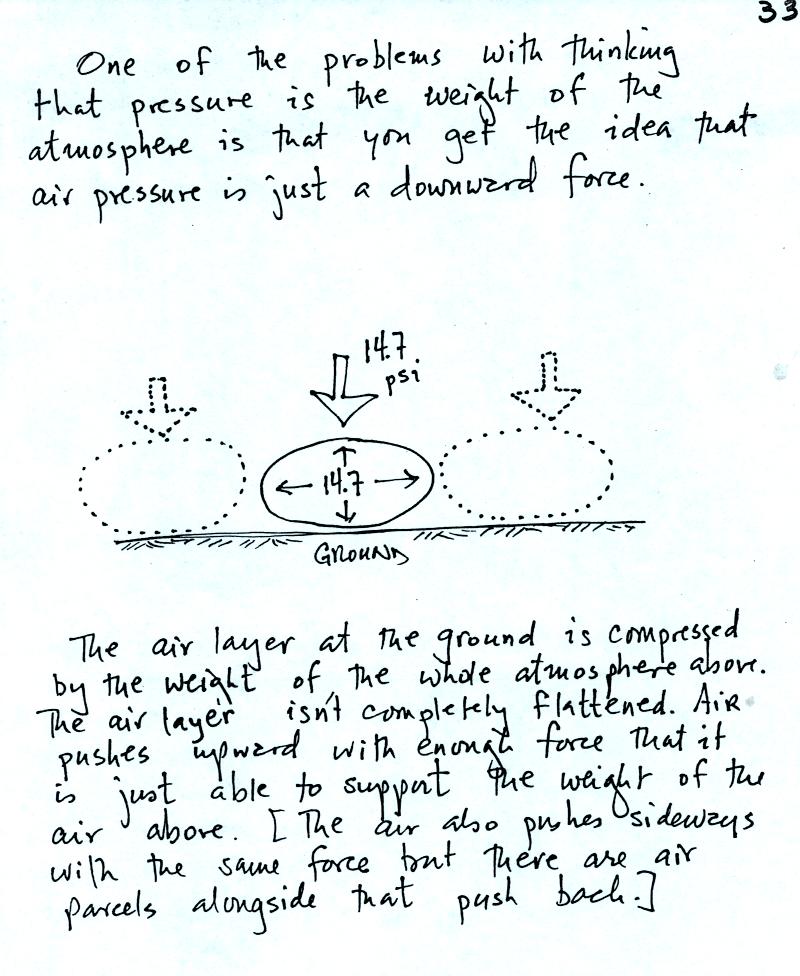
Air pressure is a force that pushes downward, upward, and
sideways.
The bottom person in the people pyramid below must push upward with
enough
force to support the other people. The air
pressure in the four tires on your automobile push down on the road
(that's something you would feel if the car ran over your foot) and
push upward
with enough force to keep the 1000 or 2000 pound vehicle off the
road.
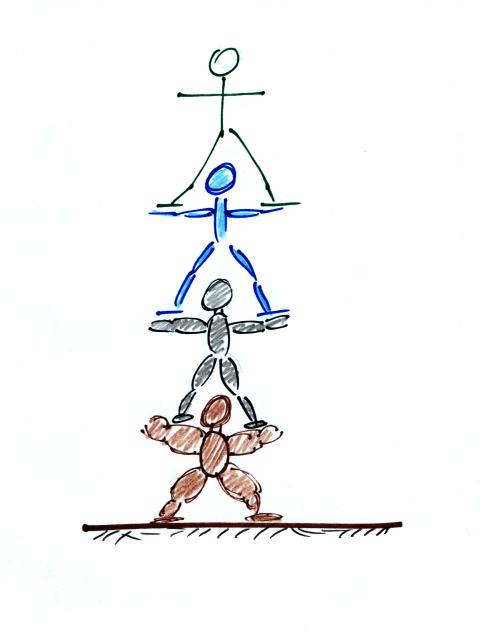
"People pyramid"
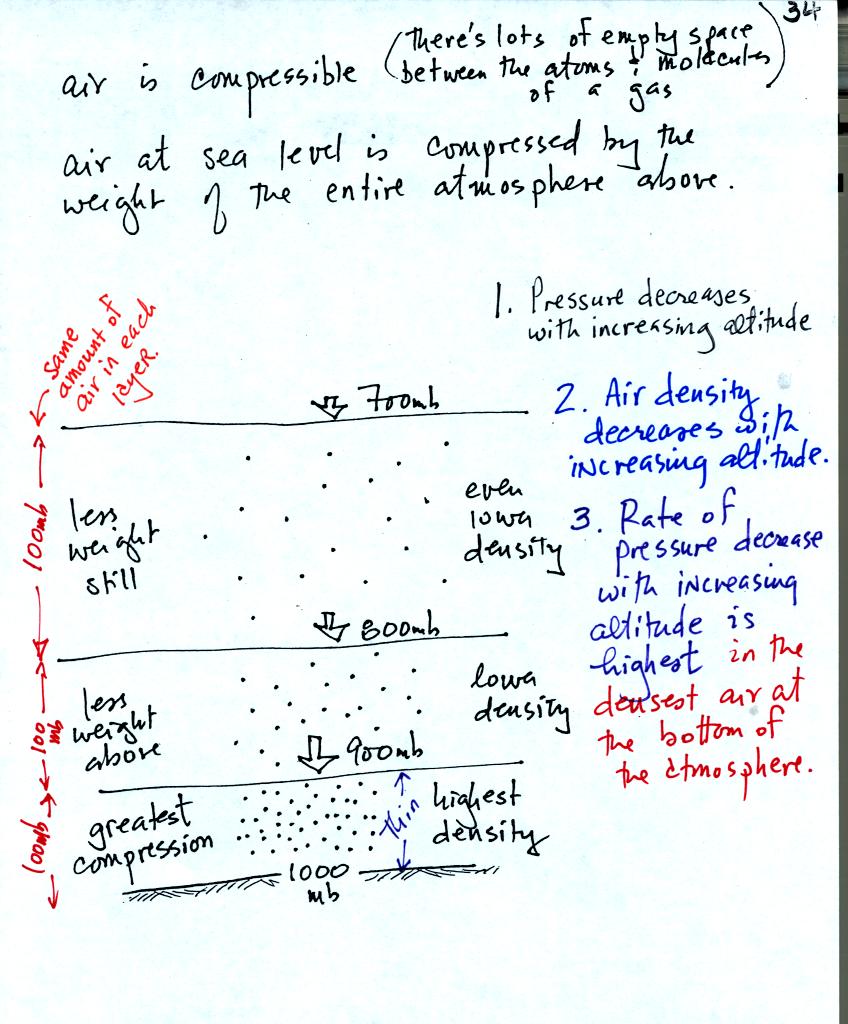
Three layers of air in the atmosphere are shown above (each
layer
contains the same amount of air, 10% of the air in the
atmosphere). This picture reminds you that air pressure decreases with
increasing altitude.
The layer at the ground and at the bottom of the
atmosphere is "squished" by the weight of the air above.
Squeezing all of this air into a thin layer or small volume increases
the air's density. The highest air density is found at the bottom
of the atmosphere.
The next layer up is also squished but not as much as the bottom
layer. The density of the air in the second layer is lower than
in the bottom layer. The air in the 3rd layer has even lower
density. It is fairly easy to understand that air density
decreases with increasing altitude.
Finally if you look closely at the figure you can see that pressure decreases most rapidly
with increasing altitude in the dense air at the bottom of the
atmosphere.
Next we'll
do a little demonstration (the demonstration doesn't involve dropping
water balloons as shown below).
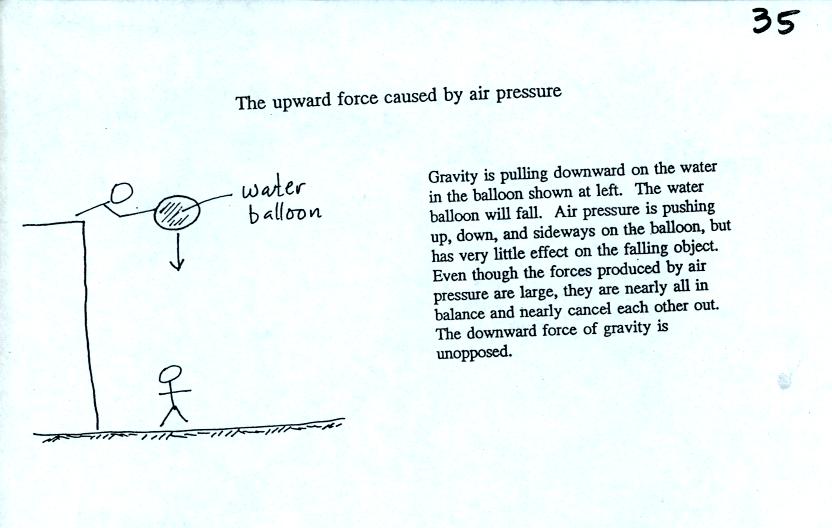
All of the forces acting on the water balloon are shown in
the next
figure.
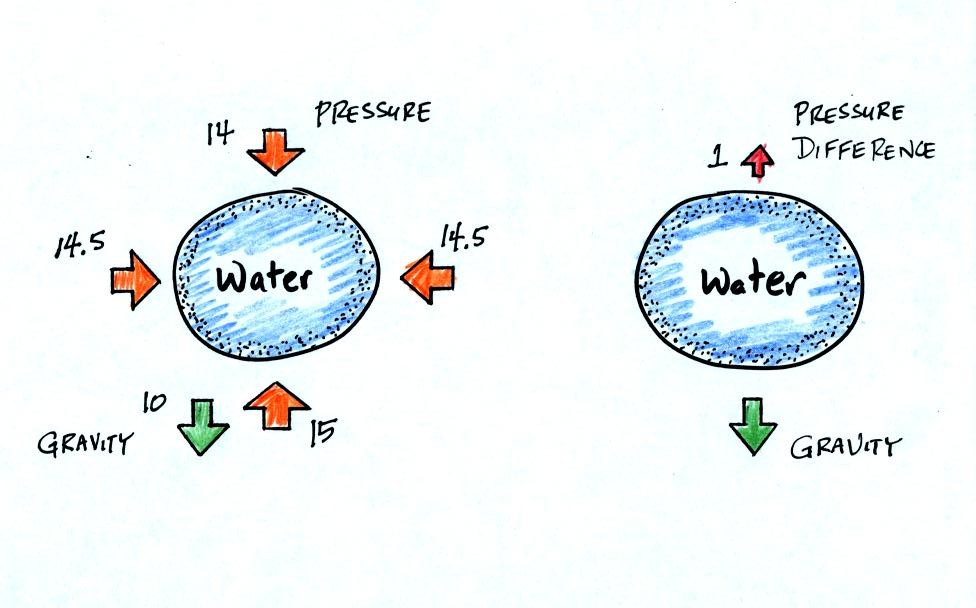
The figure at left shows air pressure (red arrows) pushing on all
the
sides of the balloon. Because pressure decreases with increasing
altitude, the pressure pushing downward on the top of the balloon is a
little weaker than the pressure pushing upward at the bottom of the
balloon. The two sideways forces cancel each other out. The
total effect of the pressure is a weak upward force (shown on the right
figure, you might have heard this called a bouyant force).
Gravity exerts a downward force on the water
balloon. In the figure at right you can see that the gravity
force is stronger than the upward pressure difference force. The
balloon falls as a result.
In the demonstration a wine glass is filled with water. A small
plastic lid is used to cover the wine glass. You can then turn
the glass upside down without the water falling out.
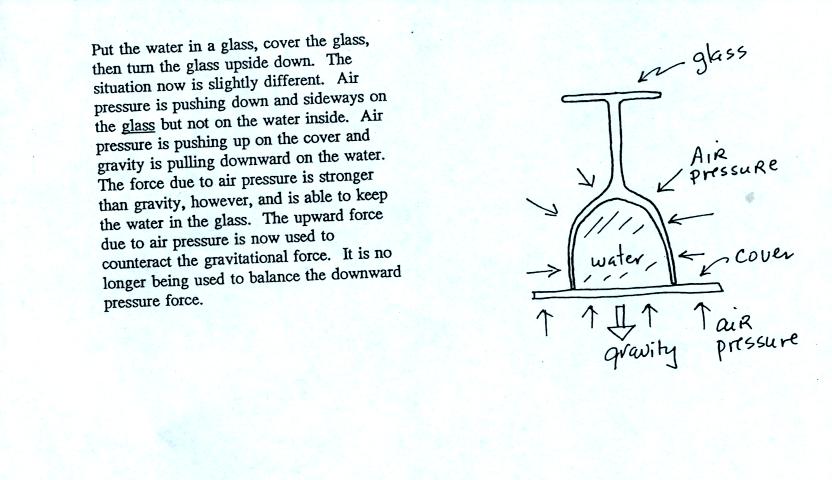
Now we'll look again at all of the forces and see how this is
possible.
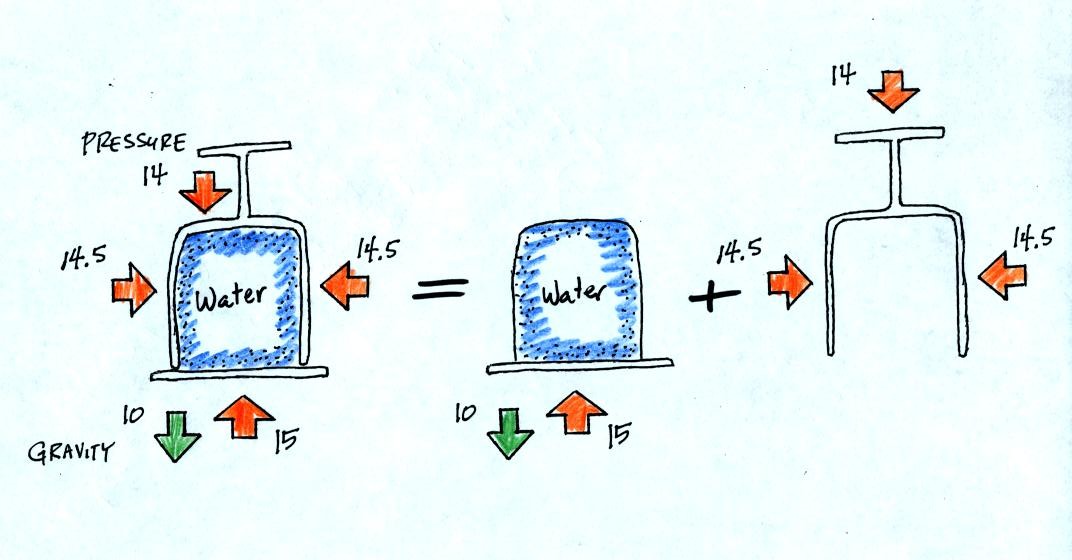
All the same forces are shown again in the left most figure.
In
the right two figures we separate this into two parts. First
the water inside the glass isn't feeling the downward and sideways
pressure forces (because they're pushing on the glass). Gravity
still pulls downward on the water but the upward pressure force is able
to overcome the downward pull of gravity.
The demonstration was repeated using a 4 Liter flash (more than a
gallon of water, more than 8 pounds of water). The upward
pressure force was still able to keep the water in the flask.