Thursday Aug. 31, 2006
The Practice Quiz is one week from today. In anticipation of that
event, a preliminary version of the Practice
Quiz Study Guide is now available online. There may be some
small
changes made between now and early next week.
Locations of the reviews will be added to the study guide once they are
known. Next Tuesday I'll distribute a photocopy of the Study
Guide.
The packet containing old quizzes and an old final exam is now
available for purchase ($2.50). You'll find sample questions on
the Study Guide that come from quizzes in this collection.
Tropical storm Ernesto is moving through Florida and into the SE United
States. Meanwhile in the Pacific, off the west coast of Mexico, Hurricane John is now a category 3
hurricane (it reached category 4 strength yesterday). Hurricane
John may influence our
weather by the end of the week.
A short new reading assignment was
made.
We covered
sulfur dioxide, the first of three air pollutants, on Tuesday.
You'll find lots of detailed information about air pollutants in Tucson
and
Pima County at the Pima County
Department of Environmental Quality webpage. The US Environmental Protection Agency also
has a large amount of information about this topic. Today we'll
start with carbon monoxide and then cover tropospheric ozone and
photochemical smog.
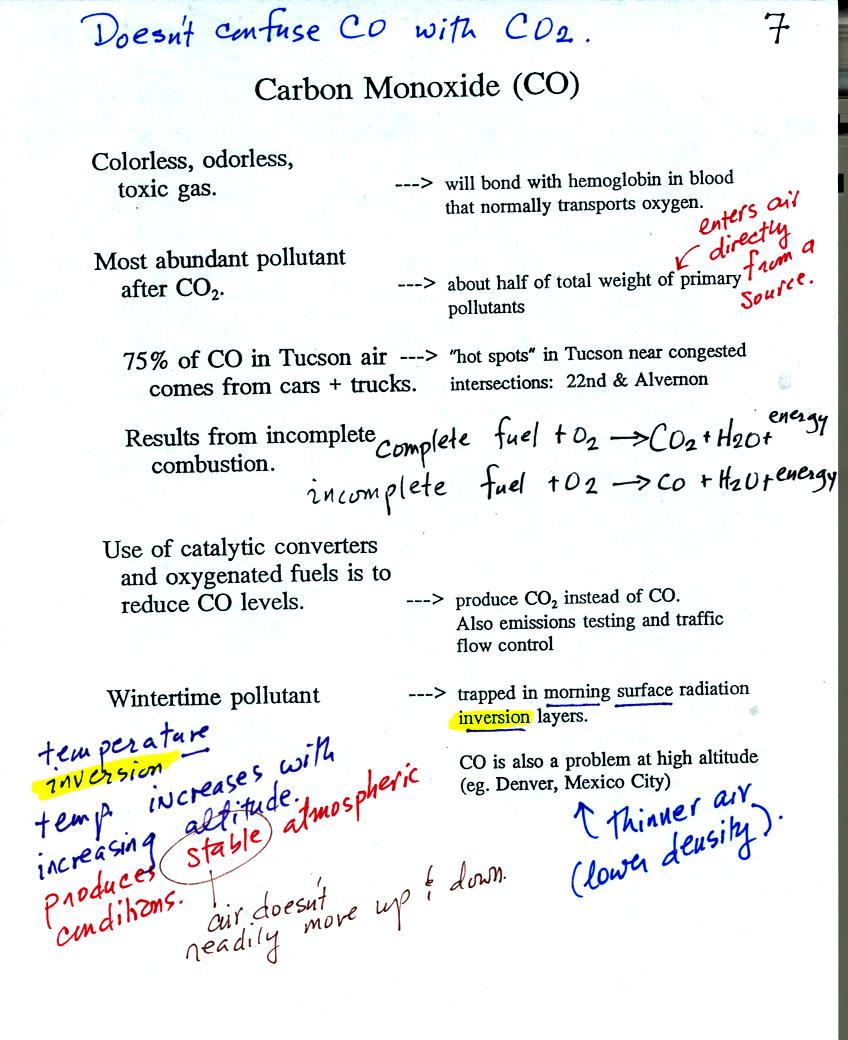
Carbon monoxide (CO) is a colorless, odorless, toxic
gas. It
is a
primary pollutant that results from incomplete combustion (complete
combustion would produce carbon dioxide). The highest CO
concentrations are observed on winter mornings. CO is trapped in
stable morning surface inversion layers that form on winter mornings.
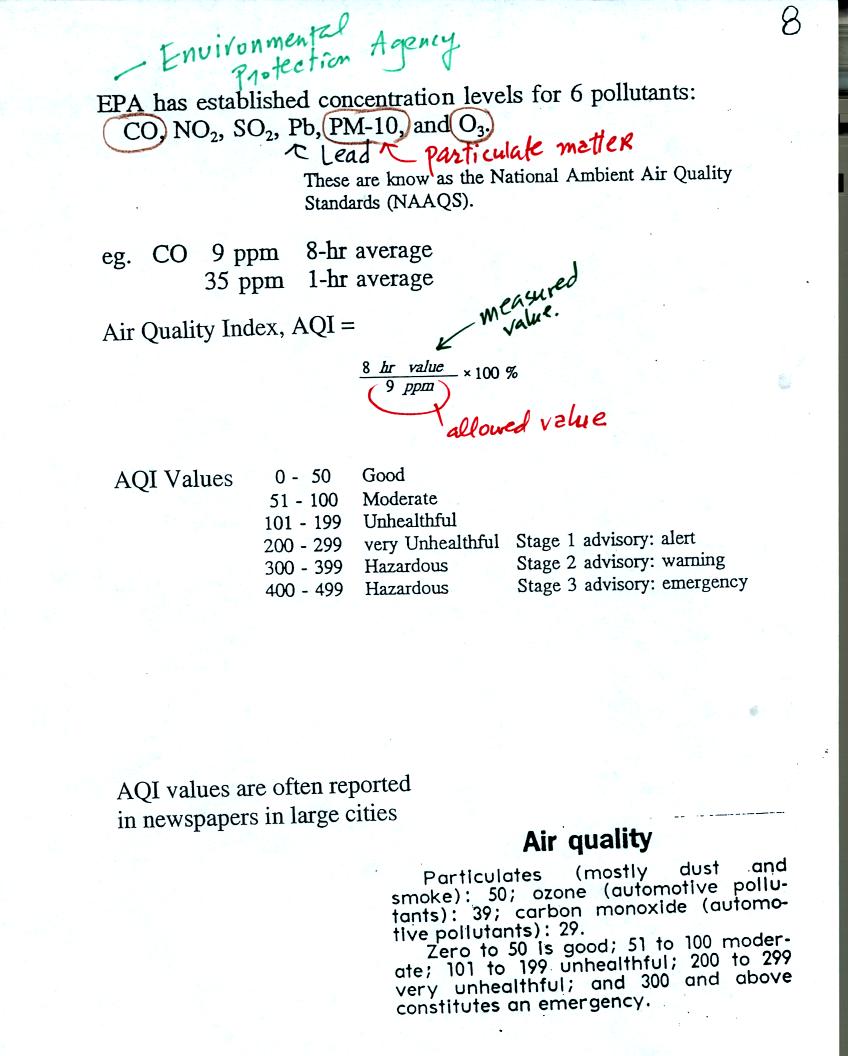
Concentrations of several pollutants are measured daily in
many
cities (particulate matter, ozone, and carbon monoxide are monitored in
Tucson) and measured values are reported in the newspaper or on
television using the Air Quality Index (formerly the pollutant
standards index). This is basically the measured value divided by
the allowed value multiplied by 100%. Current Air Quality Index values for
Tucson are available online.
While CO concentrations in the atmosphere are of concern, even higher,
potentially fatal, levels of carbon monoxide can quickly build up
inside a house or apartment if gas-burning appliances aren't operating
properly or aren't adequately vented to the outside. You can
learn
more about carbon monoxide hazards and risk prevention at the Consumer Product
Safety Commission web page.
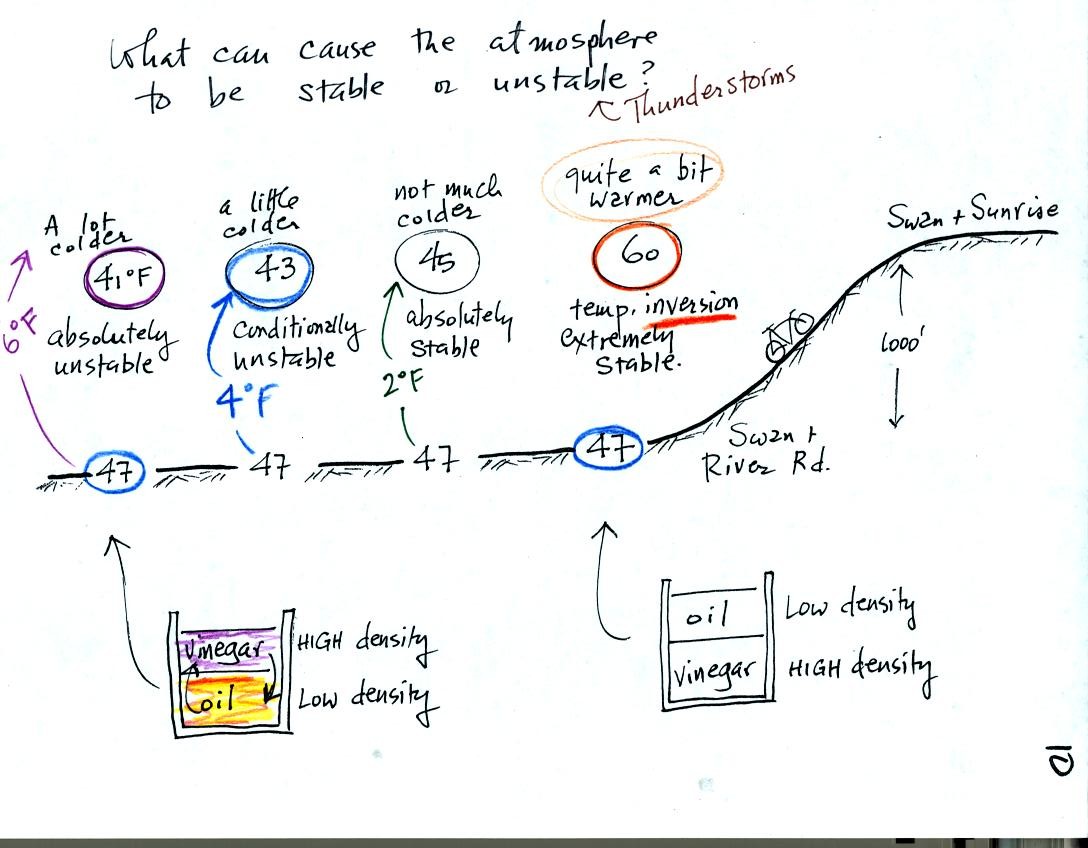
This rather
busy and confusing picture just illustrates how small changes in how
air temperature changes with increasing altitude can determine whether
the atmosphere will be stable or unstable. Just for the
purposes of illustration we imagine riding a bicycle from Swan and
River Rd up a hill to Swan and Sunrise (fhe figure shows an elevation
change of 1000 ft, it is actually quite a bit less than that)
At far left the air temperature drops 6o F. This is a
fairly
rapid drop with increasing altitude and would make the atmosphere
absolutely unstable. The atmosphere wouldn't remain this
way. Air at the ground would rise, air above would sink, and the
temperature profile would change. In some ways it would be like
trying to pour vinegar on top of oil in a glass. The lower
density oil would rise because it would "want" to float on top of the
higher density vinegar.
The next picture shows air temperature decreases a little more slowly
with increasing altitude. This small change makes the atmosphere
conditionally unstable (we won't go into the conditions). The
atmosphere is frequently in this state.
The atmosphere cools only 2o F in the next picture.
This creates
an absolutely stable atmosphere. Air at the ground will remain at
the ground and won't rise and mix with air higher up. Compare
this with the glass containing vinegar and a layer of oil on top.
The two layers won't mix.
Air temperature in the last figure actually increases with increasing
altitude This is a temperature inversion and produces very
stable conditions.
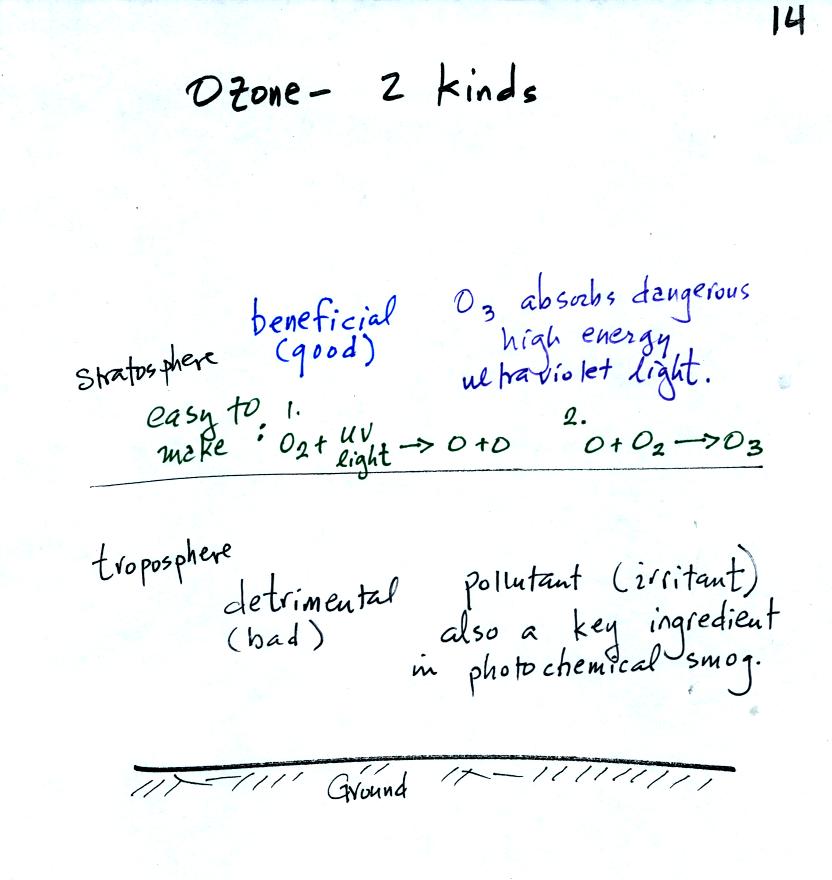
It is relatively easy to make ozone in the
statosphere. We
will make use of this simple two step reaction for our demonstration in
class today.
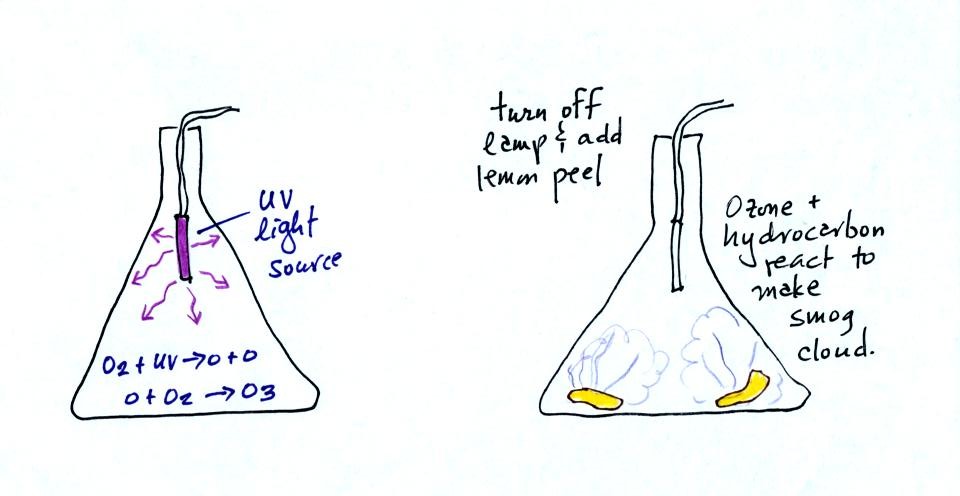
At this
point, to prepare for the photochemical smog demonstration, a small
mercury vapor lamp was inserted into a large 4 liter
flask. The lamp emits a lot of (invisible) ultraviolet radiation
and is used
to produce ozone inside the flask. The flask was sealed with foil
so that the ozone couldn't escape. The glass walls of the flask
should absorb the dangerous UV radiation. But just to play it
safe the flask was covered with a black cloth. The ozone will be
used later in the class to make photochemical smog.
We will see in the next figure that ozone production in the troposphere
is a
little more complicated.
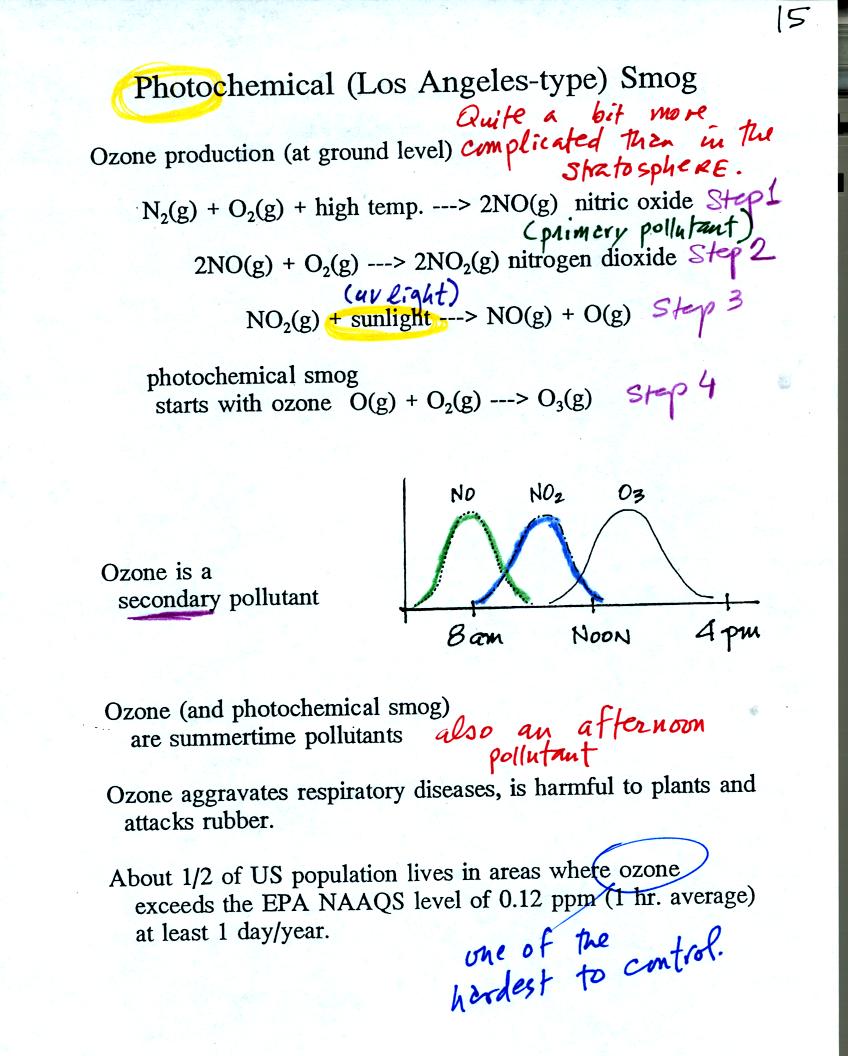
The production of tropospheric
ozone begins with nitric
oxide
(NO). NO is produced when nitrogen and oxygen are heated (in an
automobile engine for exampe) and react. The NO can then react
with oxygen to make nitrogen dioxide, a poisonous brown-colored
gas. Sunlight can dissociate (split) the nitrogen dioxide
molecule producing atomic oxygen (O) and NO. O and O2
react (just
as they do in the stratosphere) to make ozone (O3).
Because ozone
does not come directly from an automobile tailpipe or factory chimney,
but only shows up after a series of reactions, it is a secondary
pollutant. The nitric oxide would be an example of a
primary pollutant.
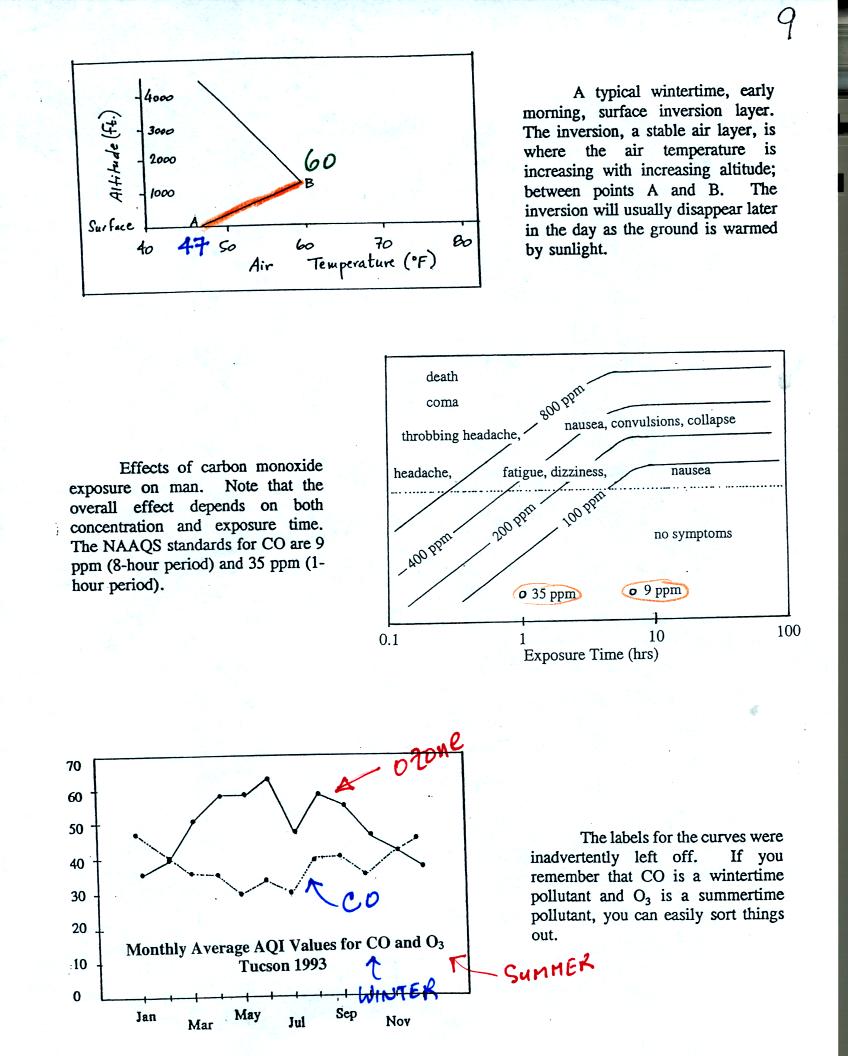
NO is produced early in the day. The concentration of NO2
peaks
somewhat later. Peak ozone concentrations are usually found in
the afternoon. Ozone concentrations are also usually higher in
the summer than in the winter. This is because sunlight plays a
role in ozone production and summer sunlight is more intense than
winter sunlight.
As shown in the figure below,
invisible ozone can react with a hydrocarbon of some kind which is also
invisible to make a
product
gas. This product gas sometimes condenses to make a visible smog
cloud or haze.

The class demonstration of photochemical smog is summarized
below (a flash was used instead of the aquarium shown on the bottom of
p. 16 in the photocopied class notes). We begin by using the UV
lamp to fill the flask with
ozone. Then a few pieces of fresh lemon peel were added to the
flask. A whitish cloud quickly became visible (colored brown in
the figure below).
The following figure wasn't shown in
class. It is included here to motivate the next section of
material that we will be covering.
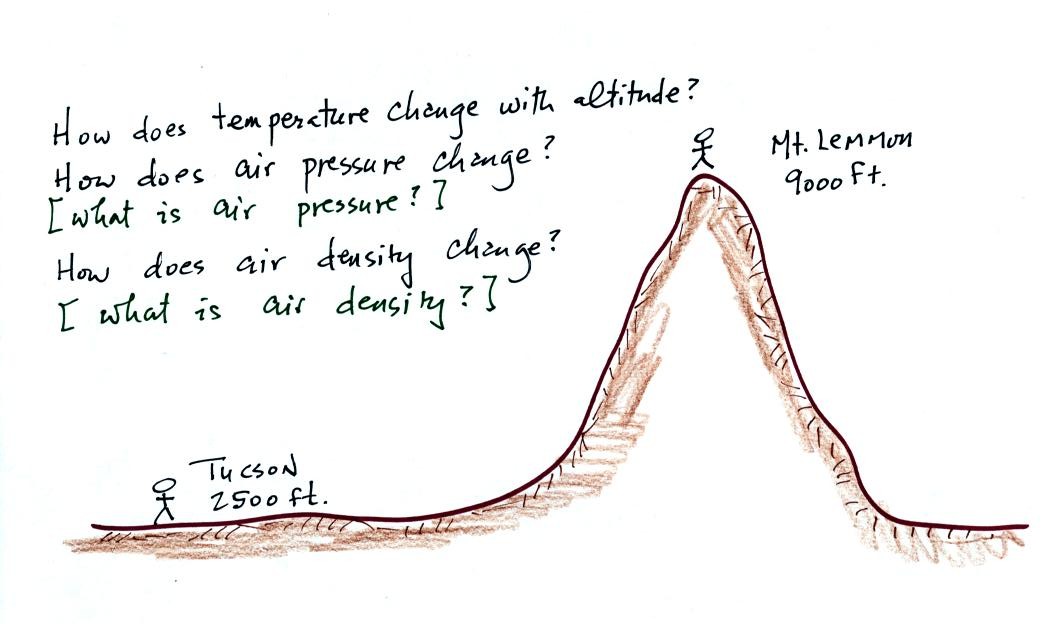
For the remainder of today's class and also next Tuesday we return to
the middle part of Chapter 1 and will look at how characteristics such
as air temperature, pressure, and density vary with changing altitude
in the atmosphere. We'll start with temperature.

The atmosphere can be split
into layers
depending on whether
temperature is increasing or decreasing with increasing altitude.
The two lowest layers are shown in the figure above. (the numbers
1 - 6 were added after class to aid the discussion of this figure)
1. We live in
the troposphere. The troposphere is found, on average, between 0
and about 10 km altitude, and is where temperature using decreases with
increasing altitude.
Most of the sunlight arriving at the top of
the atmosphere passes through the atmosphere and is absorbed at the
ground. This warms the ground. The air in contact with the
ground is warmer than air higher up and further from the ground.
2. The troposphere contains most of the water vapor
in the atmosphere and is where most of the weather occurs. The
troposphere can be stable or unstable (tropo means to turn over and
refers to the fact that air can move up and down in the
troposphere). The thunderstorm shown in
the figure indicates unstable conditions, meaning that strong up and
down air motions are occurring. When the thunderstorm reaches the
top of the troposphere, it runs into the stable stratosphere. The
air can't continue to rise in the stable stratosphere so the cloud
flattens out and forms an anvil.
3. Temperature remains constant between 10 and 20 km and then
increases with increasing altitude between 20 and 50 km. These
two sections comprise the stratosphere. The stratosphere is a
very stable air layer.
4. 10 km (kilometers) is approximately 30,000. At
nearly 30,000 feet altitude, the summit of Mt.
Everest is near the top of the troposphere. Commercial aircraft
fly at cruising altitudes between 30,000 and 40,000 feet. This is
right at the boundary between the top of the troposphere and the bottom
of the stratosphere.
5. Most of the sunlight arriving at the top of
the atmosphere passes through the atmosphere and is absorbed at the
ground. This warms the ground. The air in contact with the
ground is warmer than air higher up and further from the ground (in the
troposphere anyway).
6. How do you explain increasing temperature with increasing
altitude in the stratosphere. The ozone layer is found in the
stratosphere (peak concentrations are found near 25 km altitude).
Absorption of
ultraviolet light by ozone warms the air in the stratosphere and
explains why the air can warm. The air in the stratosphere is
much less dense (thinner) than in the troposphere. It doesn't
take as much energy to warm this thin air as it would to warm denser
air closer to the ground.