Tuesday Sept. 19, 2006
Quiz #1 this coming Thursday. About 40% of the question on
the quiz will come from the Practice
Quiz Study Guide & 60% from the Quiz
#1 Study Guide.
Reviews Tuesday afternoon (Harvill 318 4-5 pm) &
Wednesday
afternoon
(Harvill 302 4-5 pm)
The Optional Assignments have been graded (no mark on your paper means
you received full credit). Answers
Where is my graded 1S1P report?
Review
- What do high and low pressure centers on a surface weather map tell
you about the weather in their vicinity?
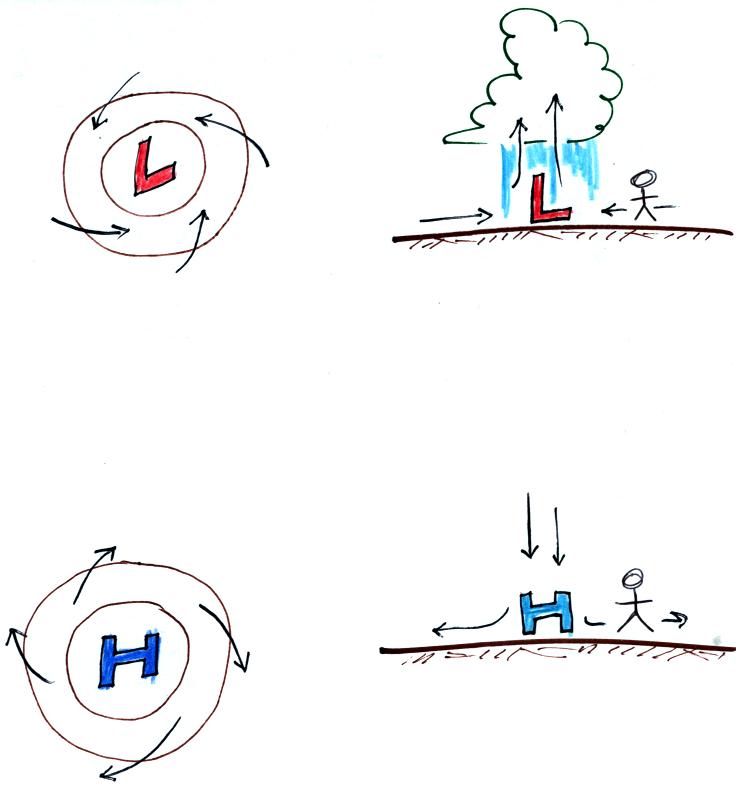
You find counterclockwise winds blowing around low
pressure. The
winds also spiral inward toward the center of the LOW (air will always
try to blow from high to low pressure, other forces may prevent it from
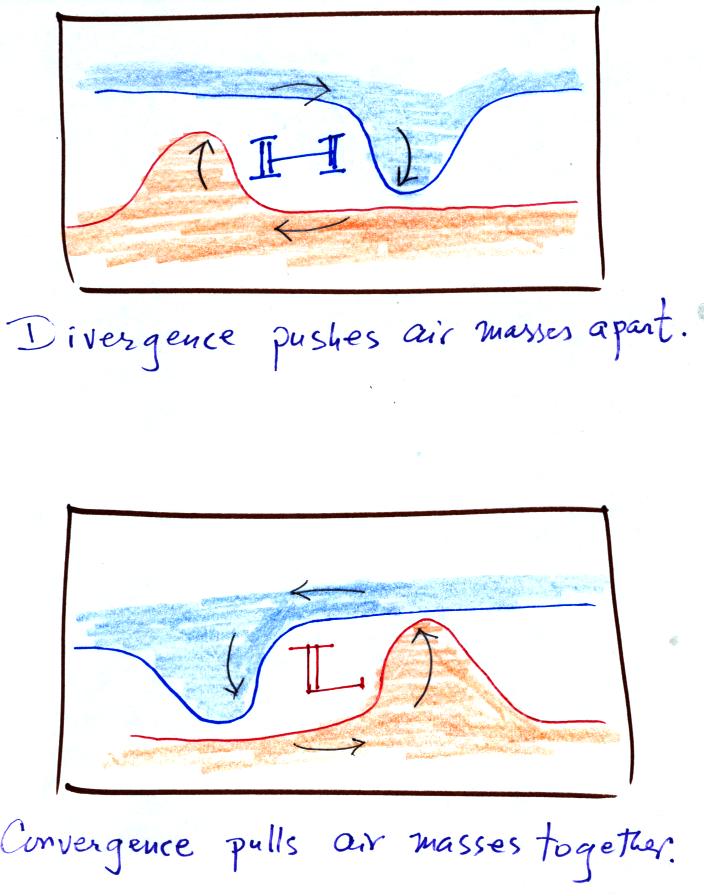
doing so however). The inward motion is called convergence.
Because
of the convergence air rises in the center of low pressure. The
rising air expands and cools. The cooling can cause clouds to
form. Convergence is one of
4 ways of causing air to rise in the atmosphere.
With high pressure winds spin clockwise and spiral outward
(divergence). Air
sinks in the middle of the high. The sinking air is compressed
(as it moves to lower levels in the atmosphere) and warms. The
warming keeps clouds from forming so you generally find clear skies in
the vicinity of surface high pressure.
Once
you have the pressure pattern mapped out you can look for regions where
the pressure gradient is strong or weak. The pressure gradient is
largely responsible for determining whether the winds will be fast or
slow.
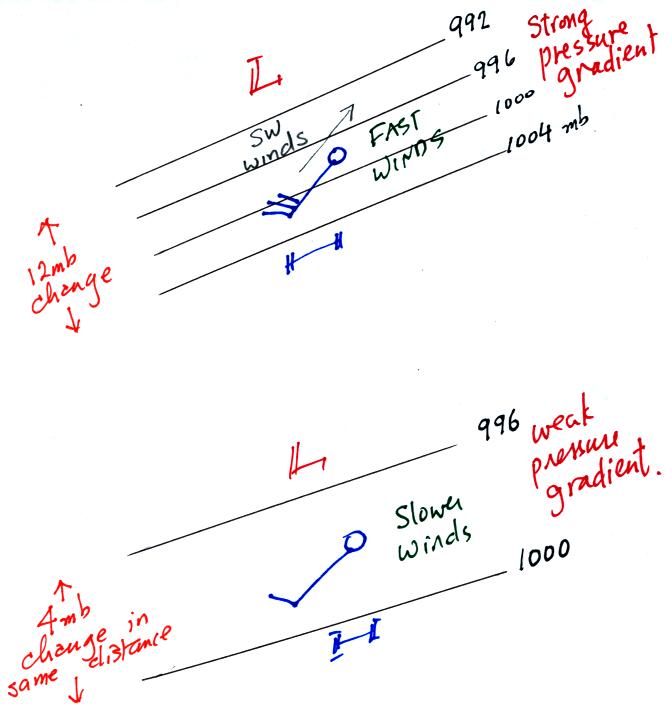
In the top figure above the isobars are closely spaced. This is a
strong pressure gradient (a large or rapid change of pressure with
distance). The wind speed is 30 knots.
In the lower figure above the pressure change is smaller in about the
same horizontal distance. This is a weaker pressure gradient and
produces slower (10 knot) winds.
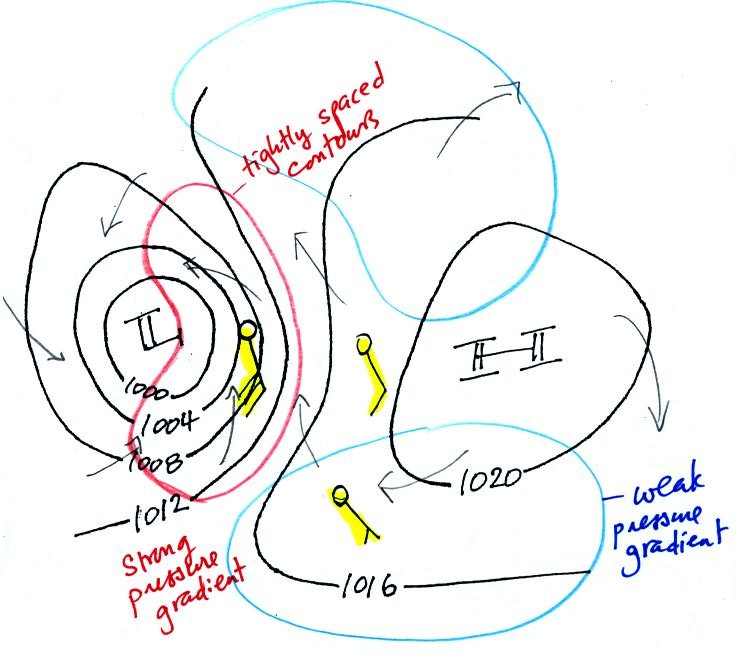
Here's a more complex but more realistic
weather map
example (found at the bottom of p. 40c in the photocopied class
notes). The arrows
indicate the directions of the winds (clockwise and outward around the
high, counterclockwise and inward around the low). Fast 30 knot
winds are found in the strong pressure gradient region shaded
red. Slower 10 knot and 5 knot winds are shown in the blue shaded
weak
pressure gradient region.
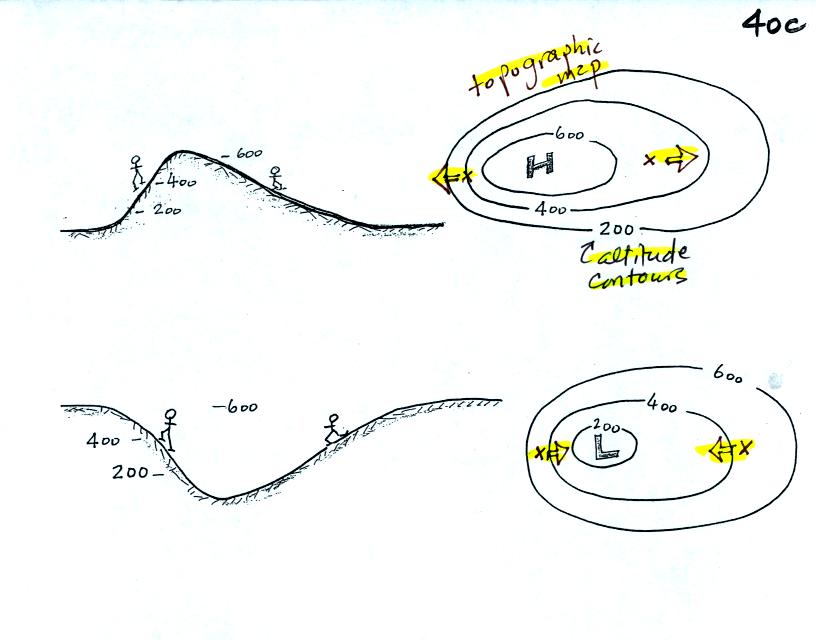
In some respects weather maps are like topographic
maps. The map
above at top right represents the hill at top left. Closely
spaced
contours on the topographic map correspond to a steep slope on the
hill. Widely spaced contours depict the gradual slope on the
right side of the hill. If you were to trip and roll downhill,
you would roll faster on the steep slope than on the gradual
slope.
The
pressure pattern on a surface weather map determines the winds.
Once the winds begin to blow they can affect the temperature
pattern. The figure below shows the temperature pattern you would
expect to see if the wind wasn't blowing at all or if the wind was
blowing straight from west to east. The bands of different
temperature air are aligned parallel to the lines of constant latitude.
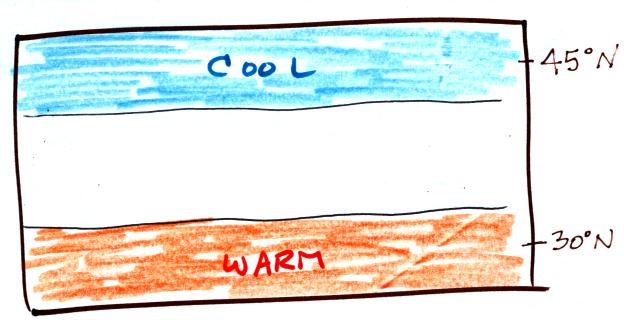
This isn't a very interesting
picture. It
gets a little
more interesting if you put centers of high or low pressure in the
middle.
The clockwise spinning winds move warm air to the north of the
western
side of the HIGH. Cold air moves toward the south on the eastern
side of the high.
Counterclockwise winds move cold air toward the south on the west side
of the LOW. Warm air advances toward the north on the eastern
side of the low.
The converging winds in the case of low pressure will move the air
masses of different temperature in toward the center of low pressure
and cause them to collide with each other. The boundaries between
these colliding air masses are called fronts.
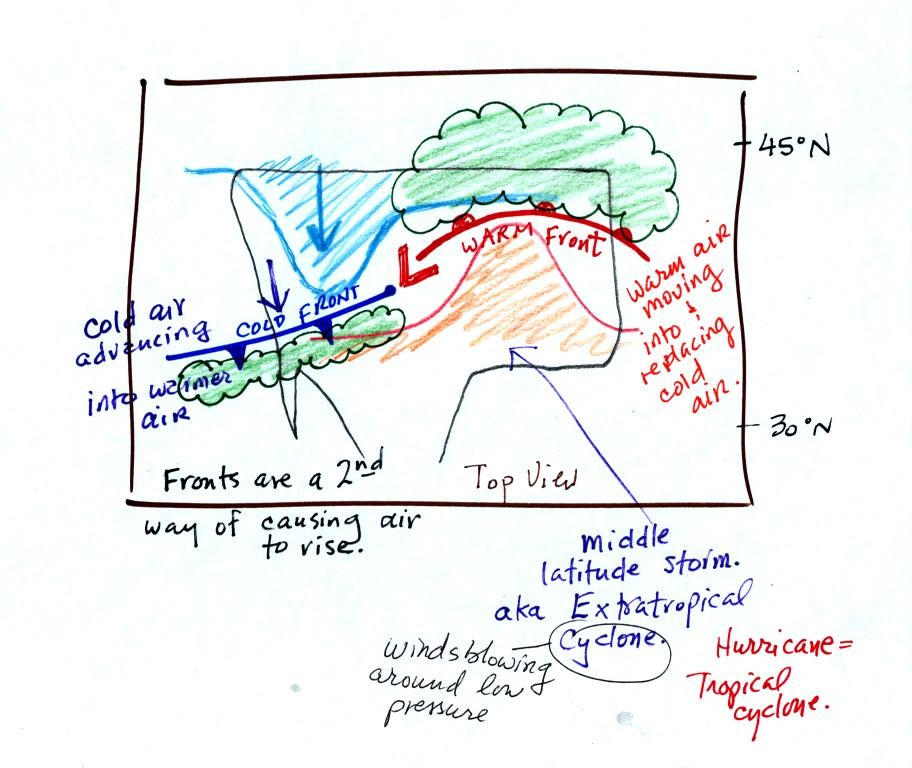
Cold air is moving from north toward the south on the
western side of
the low. The leading edge of the advancing cold air mass is a
cold front. Cold fronts are drawn in blue on weather maps.
The small triangular symbols on the side of the front identify it as a
cold front and show what direction it is moving. The fronts are
like spokes on a wheel. The "spokes" will spin counterclockwise
around the low pressure center.
A warm front (drawn in red with half circle symbols) is shown on the
right hand side of the map at the advancing edge of warm air.
Clouds can form along fronts (often in a fairly narrow band along a
cold front and over a larger area ahead of a warm front). We need
to look at the crossectional structure of warm and cold fronts to
understand better why this is the case.
Crossectional
view of a cold front
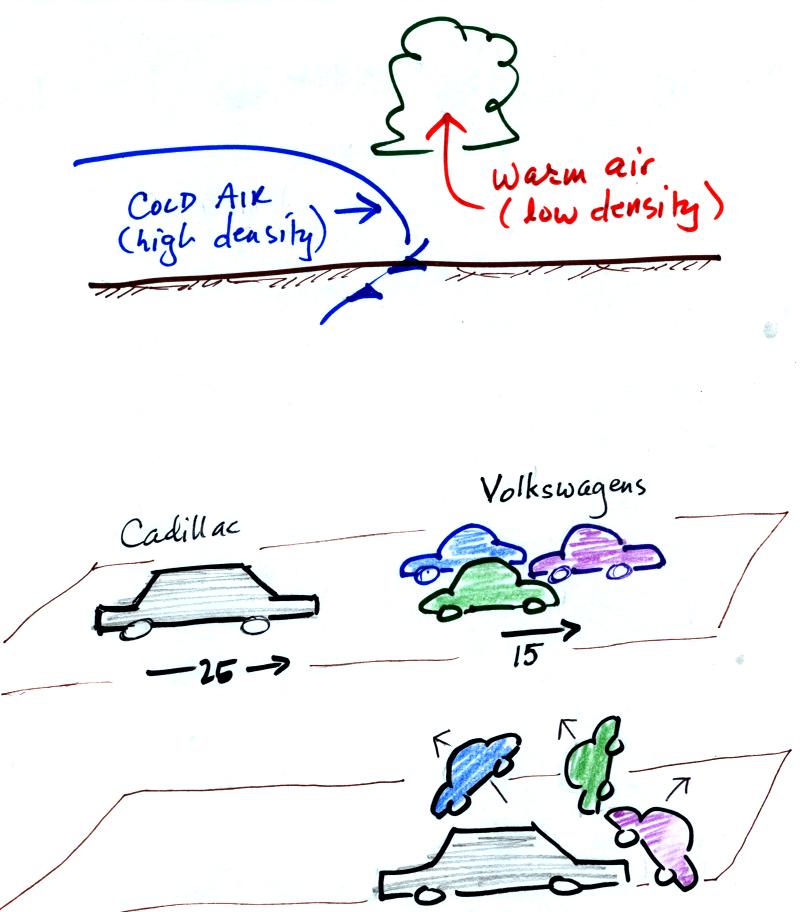
At the top of the figure, cold dense air on the left is advancing
into
warmer lower density air
on the right. We are looking at the front edge of the cold air
mass. The warm low density air is lifted out of the way
by the cold air.
The lower figure shows a big heavy Cadillac plowing into a bunch of
Volkswagens. The VWs are through up into the air by the Cadillac.
Crossectional
view of a warm front
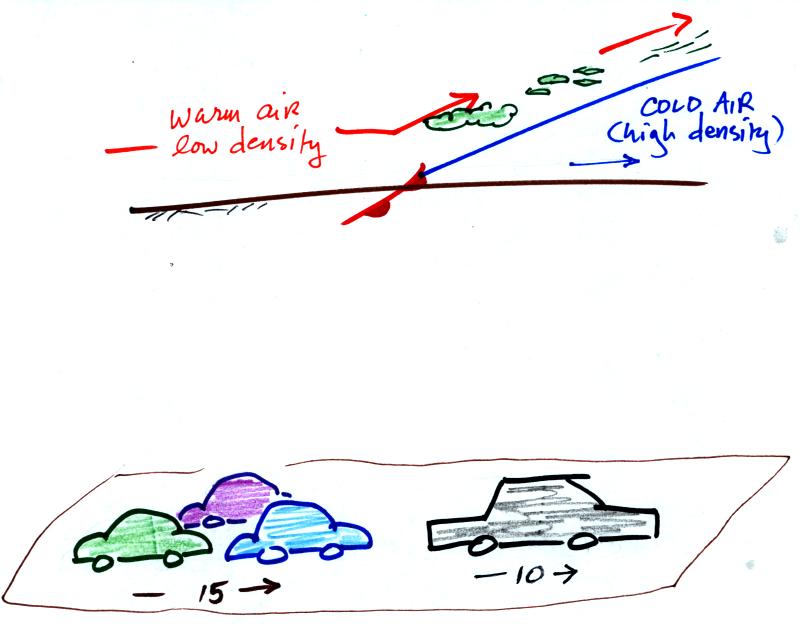
In the case of a warm front we are looking
at the
back,
trailing edge of cold air (moving to the right). Note the ramp
like shape of the cold air mass. Warm air overtakes the cold
air. The warm air is still less dense than the cold air, it can't
wedge its way underneath the cold air. Rather the warm air
overruns the cold air. The warm air rises again (more gradually)
and clouds form. The clouds generally are spread out over a
larger area than with cold fronts.
In the lower figure the VWs are
catching a Cadillac. What happens
when they overtake the Cadillac?
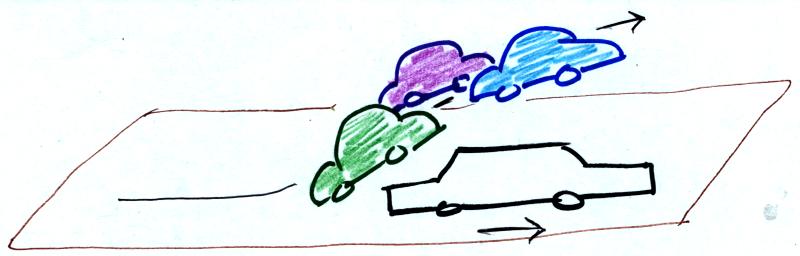
The Volkswagens aren't heavy enough to lift the
Cadillac.
They run up and over the Cadillac.
Fronts (warm and cold) are a 2nd
way of causing rising air
motions in the atmosphere. Rising air cools and if the
warm air
is moist, clouds and precipitation can form.
Now we will go back to our surface weather map from last Friday's class.

We were trying to figure out what might have been causing the cloudy
weather in the NE and along the Gulf Coast. Part of the
reason for the clouds (and rain and drizzle) in the NE might have been
the converging winds around a center of Low pressure. This would
cause air to rise and could form clouds and precipitation. The
low wouldn't explain the rain shower along the Gulf Coast, however.
Now we have added cold and warm fronts to the map (you'll learn more
about how this is done later in the semester). The warm front may
be a large part of what is causing the cloudy weather in the NE.
The rain showers along the Gulf Coast are almost certainly being caused
by the approaching cold front.
Remember you won't be tested on
the following material on Quiz #1.
Next we'll
look briefly at some of the features found on upper level weather
charts. We'll also see how upper level and surface features
interact.
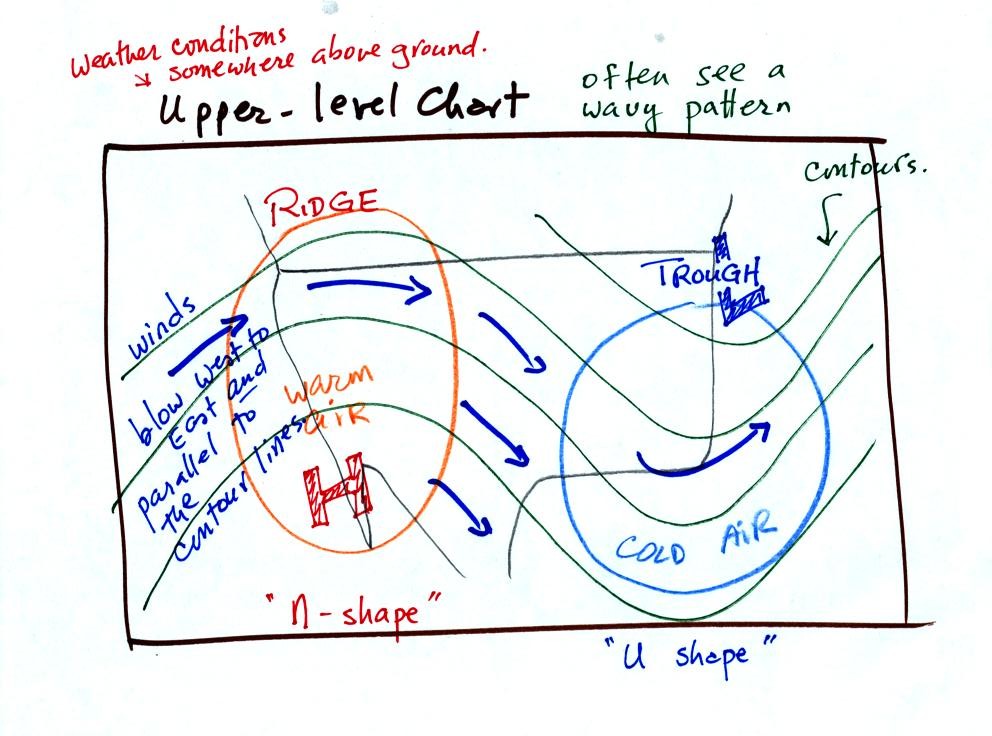
Upper level just refers to some level above the
ground.
Upper level weather maps are often drawn for several levels at
different altitudes above the ground. The upper level pattern
generally has a wavy appearance like shown above. The contours
lines dip toward the south in troughs and bulge up toward the north in
ridges. You generally find cold air below an upper level trough
(cold air between the ground the level the map is drawn for) and warm
air under an upper level ridge. The winds blow from west to east
parallel to the contour lines (winds blow across the contour lines
slightly, toward low pressure, on surface weather maps).
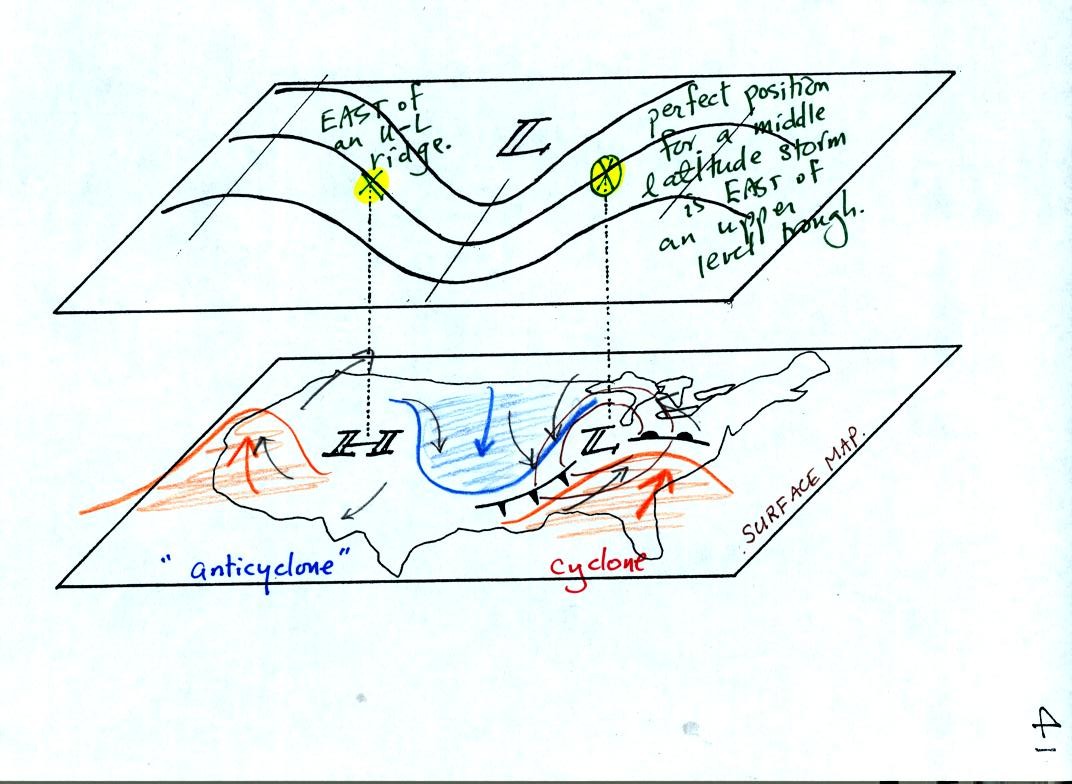
Now we will put the two kinds of maps together. On the
surface map you see centers of HIGH and LOW pressure.
The low pressure center, together with the cold and warm fronts, is a
middle latitude storm or extratropical cyclone. A surface center
of HIGH pressure is also called an anticyclone.
Note how the counterclockwise winds spinning around the LOW move cold
air (this was shaded blue after class) southward (behind the cold front
on the western side of the LOW). Clockwise winds spinning around
the HIGH also move cold air into the region between the HIGH and the
LOW. This bunch of cold air lies directly below the upper level
trough. Remember how the previous figure explained that you would
find cold air below and upper level trough. Now you can begin to
understand where that cold air comes from.
Similarly the winds move warm air northward on the west side of the
HIGH and the east side of the LOW (south of the warm front).
These warm air regions lie below ridges on the eastern and western
edges of the upper level chart. The orange shaded warm air
regions were added after class.
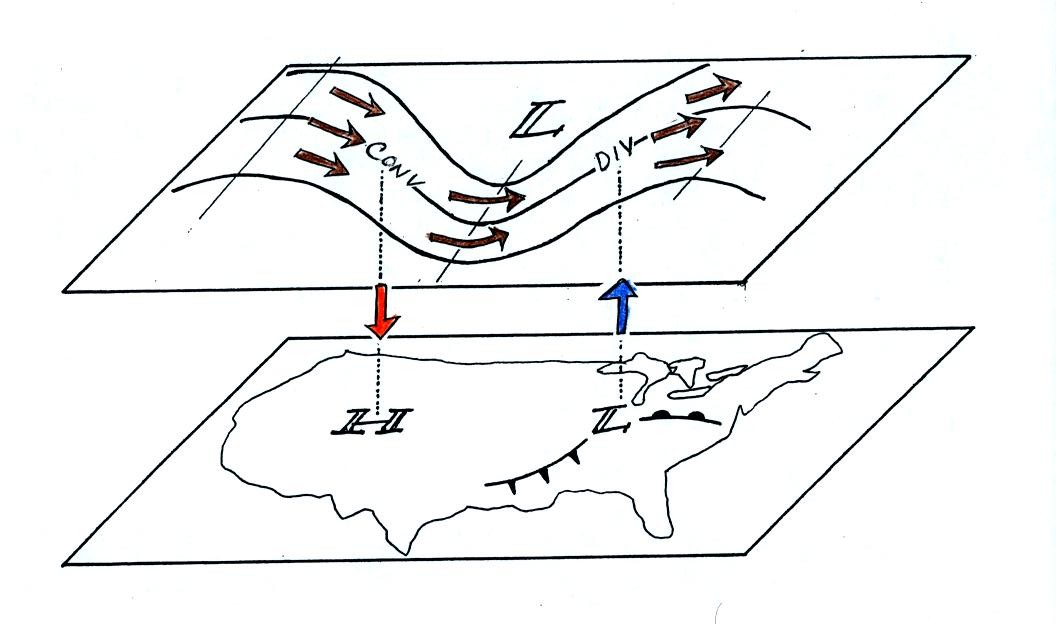
Note the X marked on the upper level chart directly above the
surface LOW. This is a good location for a surface LOW to develop
and strengthen. The reason why is that this is a location where
upper level divergence
can be found. (The point east of an upper level ridge is a
location where upper level convergence can be found, this can cause the
surface high pressure to get even higher)
We'll see in the next figure how upper level
divergence can cause the pressure at the center of a surface low to get
even lower. Upper level divergence can cause a surface storm to
intensify.
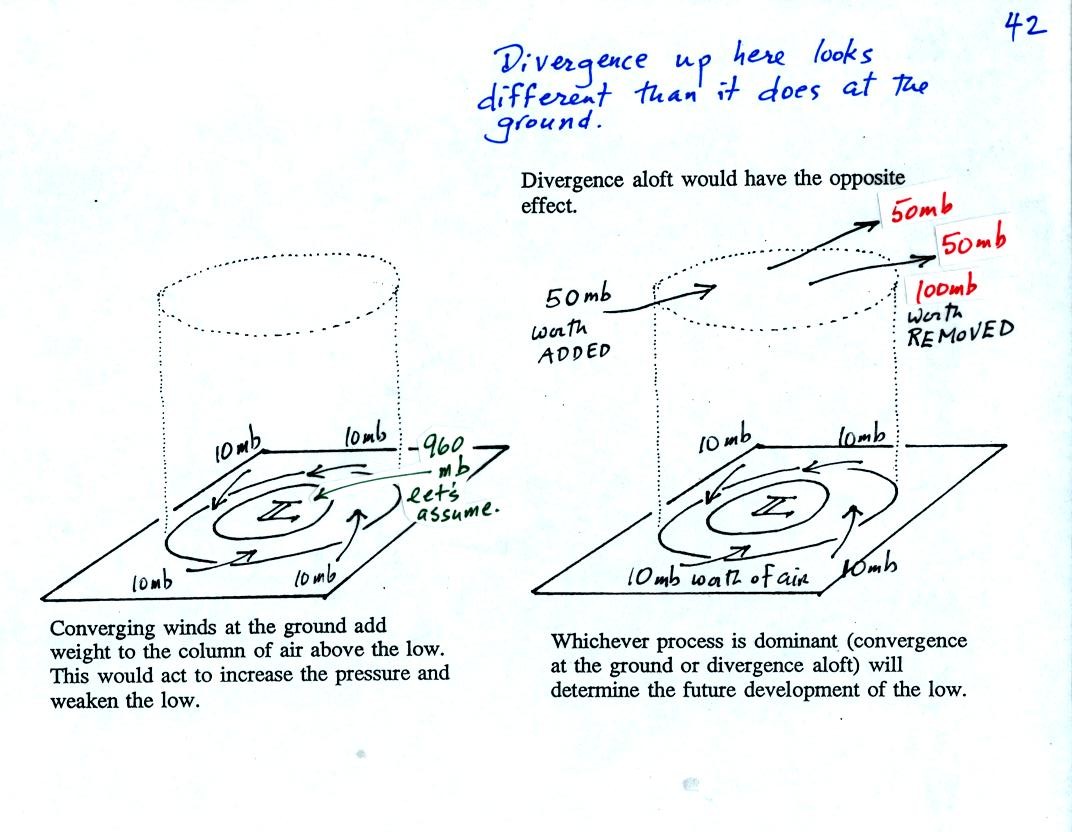
We'll start with the figure at left (modified somewhat after class).
We see a surface LOW (we'll pretend the pressure is 960
mb). Winds are spinning counterclockwise and spiraling in
toward (converging) the center of the low. These surface winds
are moving air into the column of air and (as explained on the figure)
should cause the pressure in the center of the LOW to increase.
Imagine that each arrow brings in enough air to increase the pressure
at the center of the LOW by 10 mb. You would expect the pressure
at the center of the LOW to increase from 960 mb to 1000 mb. What
if the central pressure actually decreased? How would you explain
that?
This is just like a bank account. You have $960 in the bank and
make four $10 dollar deposits. You would expect your bank account
balance to increase from $960 to $1000. What if your account
balanced dropped? How would you explain that?
The right hand figure shows what is going on. We haven't included
the effects of addition and removal of air at upper levels.
Imagine that 50 mb worth of air are added to the column and 50+50=100
mb worth of air are removed. That's a net removal (net
divergence) of 50 mb.
So now we have 40 mb worth of air being added at the ground (surface
convergence) and 50 mb worth being removed at upper levels (upper level
divergence). The grand total is 10 mb of removal. The
surface pressure will decrease slightly (from 960 mb to 950 mb).
You can apply the numbers in the right hand picture to the bank account
problem. You have $960 in the bank and make four $10
deposits.
However you also deposit $50 dollars and make two $50 withdrawals (the
top of the picture). That's a total of $90 being deposited and
$100 being withdrawn. Your bank account goes down $10.
In a case like
this where upper
level divergence > surface convergence, the surface LOW
pressure will get even lower (the low will "deepen") and the storm will
strengthen. Click here if
you dare and if you would like to see what could happen next.
The other possibility is that the upper level divergence <
surface convergence. In this case the LOW pressure will
increase (the low will "fill") and the storm will weaken.
Click here for some additional
examples. By working through some additional examples you might
increase your understanding of this material and build up your
confidence (of course there's always a chance that more examples will
just make this topic more confusing - the choice is yours)
We
finished by applying these concepts to hurricanes.
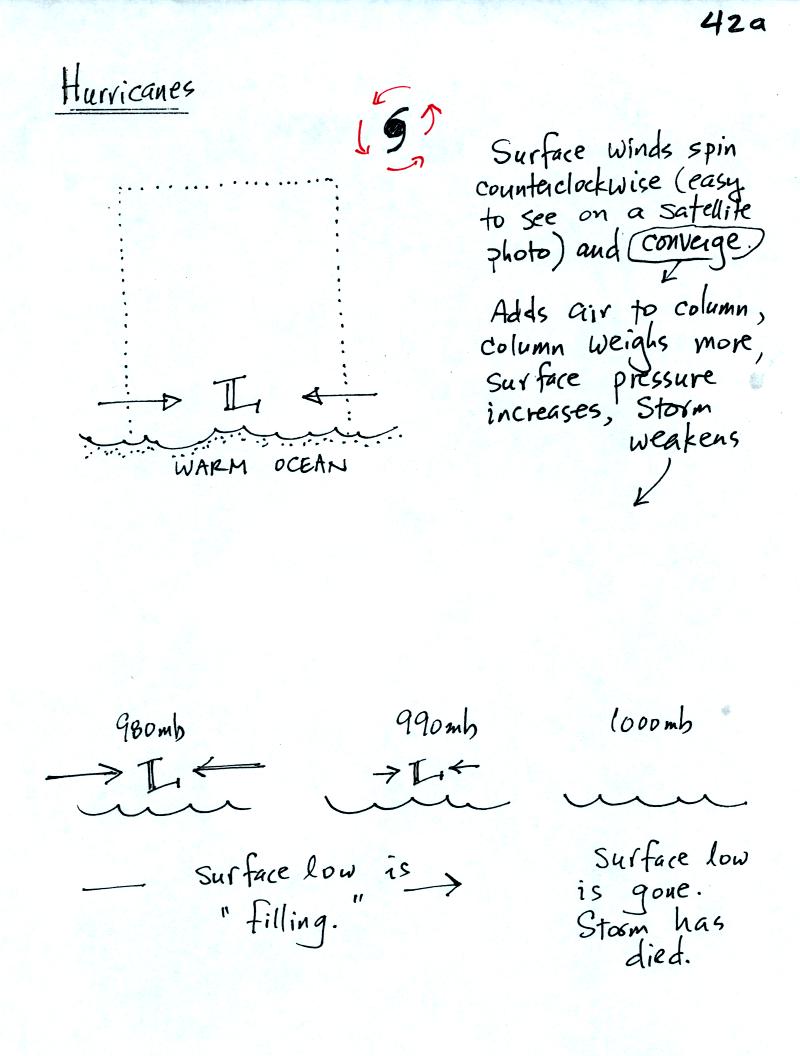
You find surface low pressure in the center of a hurricane (a
general name for a hurricane is tropical cyclone- the word cyclone
refers to the winds that spin around low pressure).
Record-setting low sea level pressure values have all been observed in
hurricanes.
In this first picture we consider the converging surface winds
only. These winds will add air to the cylinder of atmosphere that
is the hurricane. This will increase the surface pressure and the
storm will fill (surface pressure will increase) and the storm will
weaken. The storm would eventually dissipate.
Now we know that sometimes hurricanes strengthen despite the converging
winds that blow at the surface.
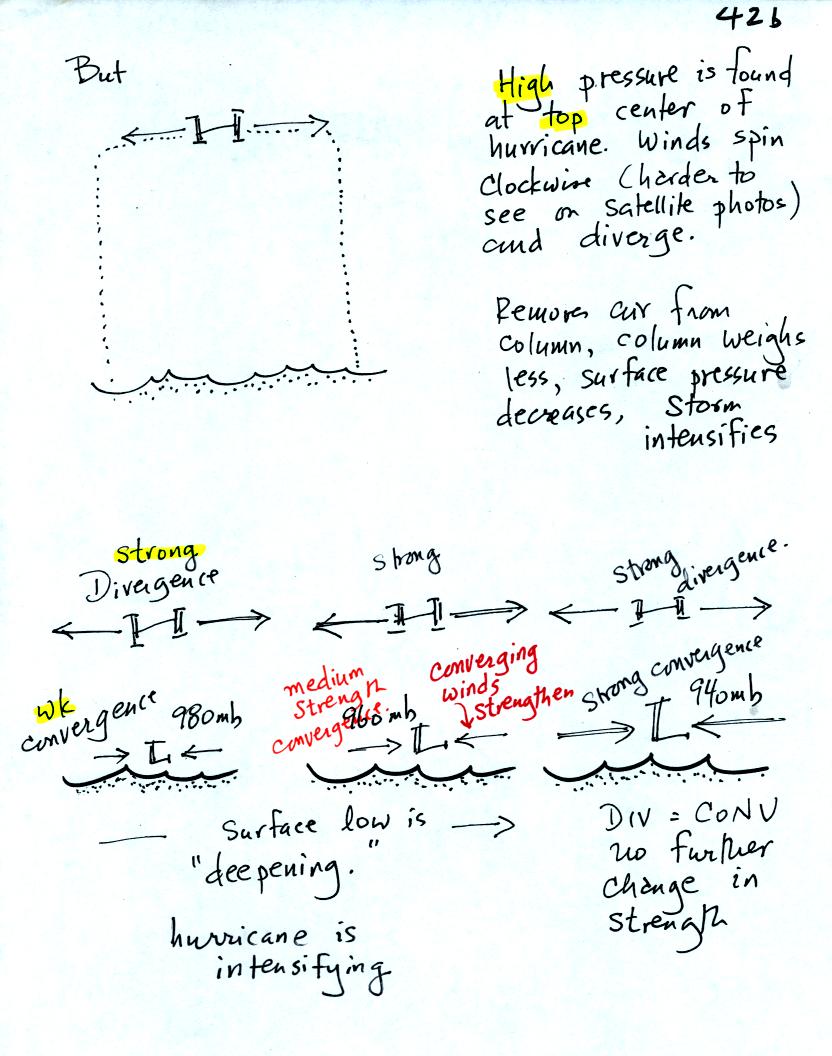
We will find, later in the semester, that high pressure is found at the
tops of hurricanes. This means the upper level winds will
diverge. If the upper level divergence exceeds the surface
convergence, air will be removed from the colume, the surface pressure
will get lower, and the hurricane will strengthen. This is
illustrated at the bottom of the figure above.
This
figure wasn't shown or discussed in class.
Now that you have some idea of what upper level divergence looks like
you are in a position to understand another one of the relationships
between the surface and upper level winds.
One of the things we have learned about surface LOW pressure is that
the converging surface winds create rising air motions. The
figure above gives you an idea of what can happen to this rising air
(it has to go somewhere). Note the upper level divergence in the
figure: two arrows of air coming into the point "DIV" and three arrows
of air leaving (more air going out than coming in is what makes this
divergence). The rising air can, in effect, supply the extra
arrow's worth of air.
Three arrows of air come into the point marked "CONV" on the upper
level chart and two leave (more air coming in than going out).
What happens to
the extra arrow? It sinks, it is the source of the sinking air
found above surface high pressure.