Friday Aug. 24, 2007
The Experiment
#1 materials were handed
out in class today.
Here's a
review of what we learned last Wednesday
Atmospheric CO2 concentration was fairly constant between
1000 AD and
the mid
1700s. CO2 concentration has been increasing since the
mid
1700s (other greenhouse gas concentrations have also been
increasing). The concern is that this might enhance or strengthen
the
greenhouse effect and cause global warming.
What has
the temperature of the earth been doing during this period? There
is a two part answer to that question.
First part:
Accurate direct measurements of temperature are available only from the
past
150 years or so. The figure below (top of p. 3 in the photocopied
Class Notes and also Fig. 14.7 in the text) shows how global
average
surface temperature has changed during that time period.
This is
based on actual measurements of temperature made (using thermometers)
at many locations on
land and sea around the globe.
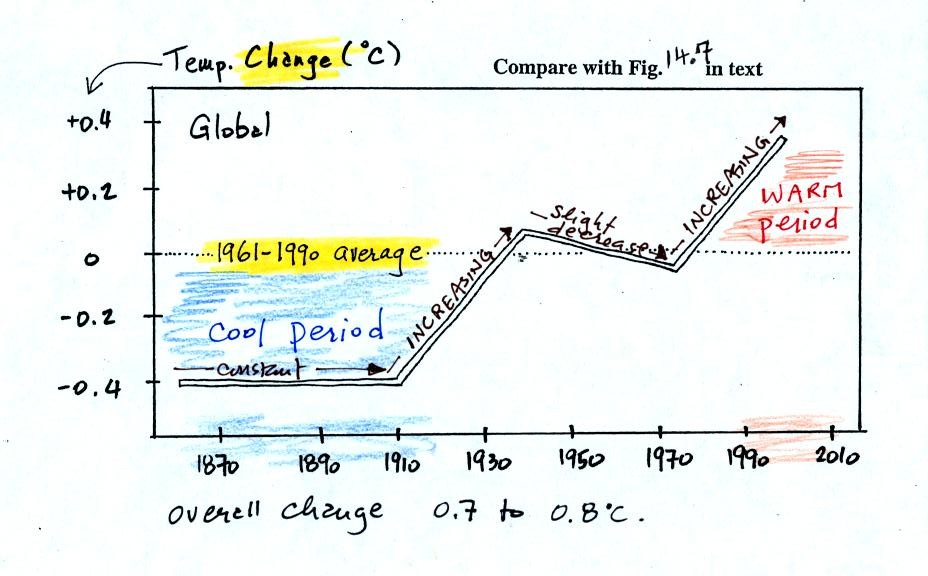
The graph doesn't actually show temperature. It shows how much
different temperatures at various times beween 1860 and 2000 were
compared to the 1961-1990 average. Temperature appears to have
increased 0.7o to 0.8o
C during this
period. The increase hasn't been steady as you might have
expected given
the steady rise in CO2 concentration; temperature even
decreased slightly between 1940 and 1975.
It is very difficult to detect a temperature change this small over
this period of time. The instruments used to measure temperature
have changed. The locations at which temperature measurements
have been made have also changed (imagine what Tucson was like 130
years ago). Average surface temperatures naturally change a lot
from year to year. The year to year variation has been left out
of the figure above so that the overall trend could be seen more
clearly (click here to see a
different
version of this figure that does show the year to year variation and
the uncertainties in the yearly measurements).
2nd part
Now it would be interesting to know how temperature was changing prior
to the mid-1800s. This is similar to what happened when the
scientists wanted to know what carbon dioxide concentrations looked
like prior to 1958. In that case they were able to go back and
analyze air samples from the past (trapped in bubbles in ice
sheets).
That doesn't work with temperature.
Imagine putting some air in a bottle, sealing the bottle, putting the
bottle on a shelf, and letting it sit for 100 years. In 2107 you
could take the bottle down from the shelf, carefully remove the air,
and measure
what the CO2 concentration in the air had been in 2007 when the air was
sealed in the bottle. You couldn't, in 2107, use the air in the
bottle to determine what the temperature of the air was when it was
originally put into the bottle in 2007.
You need to use proxy data.
You need to look for something else whose presence, concentration, or
composition depended on
the temperature at some time in the past.
Here's an example.
Let's say you want
to determine how many students are living in
a house near the university.
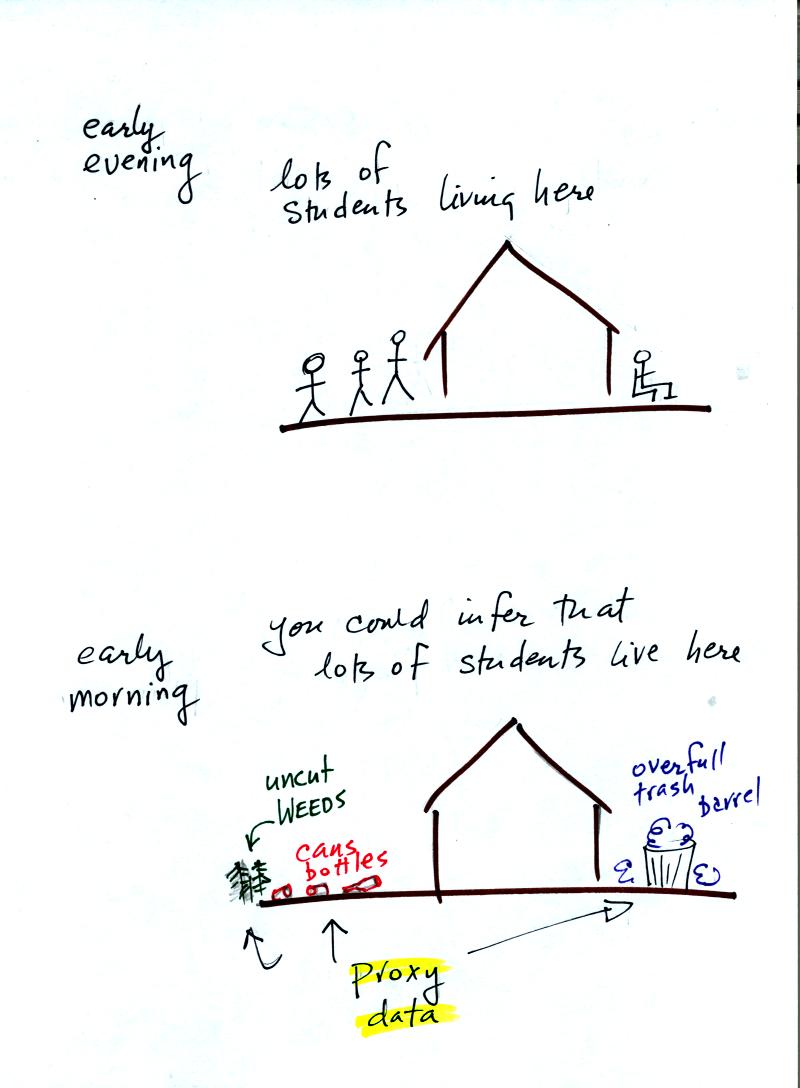
You
could walk by the house late in
the afternoon when the students might be outside and count them.
That
would be a direct measurement (this would be like measuring temperature
with a thermometer). There could still be some errors in your
measurement (some students might be hidden inside the house, some of
the people outside might not live at the house).
If you were to walk by early in the morning it is likely that the
students would be inside sleeping (or in one of the 8 am NATS 101
classes). In that case you might
look for other clues (such as the number of empty bottles in the yard)
that might give you an idea of how many students
lived in that house. You would use these proxy data to come up
with an estimate of the number of students inside the house.
In the case of temperature scientists look at a variety of
things. They could look at tree rings. The width of each
yearly ring depends on the depends on the temperature and
precipitation at the time the ring formed. They analyze
coral. Coral is made up of calcium carbonate, a molecule that
contains oxygen. The relative amounts of the different oxygen
isotopes (atoms of oxygen with different numbers of neutrons in the
nucleus) depends
on the temperature that existed at the time the coral grew.
Scientists can analyze lake bed and ocean sediments. The types
of plant and animal fossils that they find depends on
the water temperature at the time. They can even use the ice
cores. The ice, H2O, contains oxygen and the relative
amounts of
various oxygen isotopes depends on the temperature at the time the ice
fell from the sky as snow.
Using these proxy data scientists have been able to estimate average
surface temperatures for 100,000s of years into the past. The
next figure shows what temperature has been doing since 1000 AD.
This is for the northern hemisphere only, not the globe.
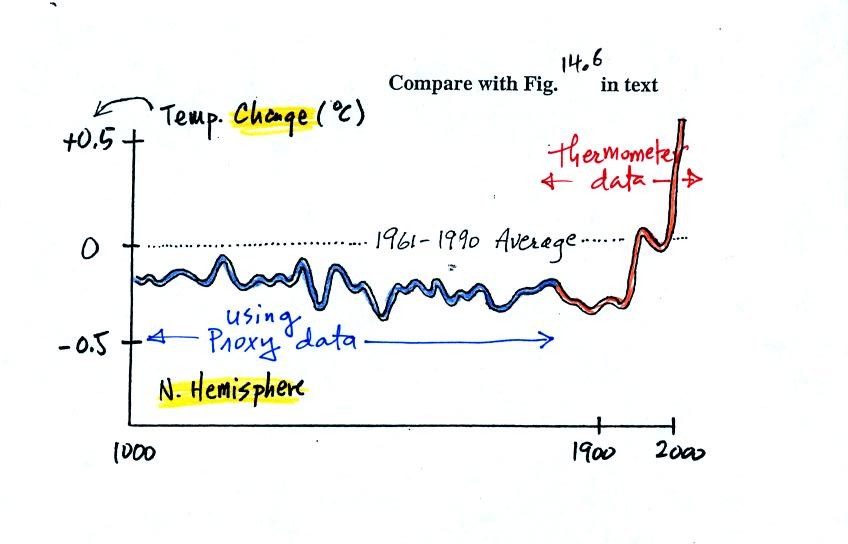
The
blue
portion of the figure shows the estimates of temperature
derived from proxy data. The red portion are the instrumental
measurements made between about 1860 and the present day. There
is also a lot of year
to year variation and uncertainty that is not shown on the figure above
(click here
or see Figure 14.6 in the
text for a more accurate representation of this curve).
It appears that there has been a significant amount of warming that has
occurred in just the last 150 years or so. Many scientists
believe that this warming is a result of the increase in atmospheric
greenhouse gas concentrations. Others suggest that this change in
temperature might be just a natural change in climate (Mother
Nature has
produced much larger changes than we see here though usually on a much
longer time scale), or might be do to other human activities that
affect climate (changing land use).
We've only
considered a small part of a large debate that involves science,
economics, and politics.
Summary
There is general agreement that
Atmospheric CO2 and other greenhouse gas
concentrations are
increasing and that
The earth is warming
Not everyone agrees
on the Causes (natural or manmade) of the warming or
on the Effects that warming will have on weather and
climate in the years to come
At this
point we made a not so smooth transition to carbon monoxide, an
important air pollutant. We'll finish up CO in class on Monday
and also cover ozone.
Some basic information about carbon monoxide is shown below (p. 7 in
the photocopied Class Notes). You'll find
additional information at the Pima
County Department of
Environmental Quality website and also at the US Environmental Protection Agency
website.
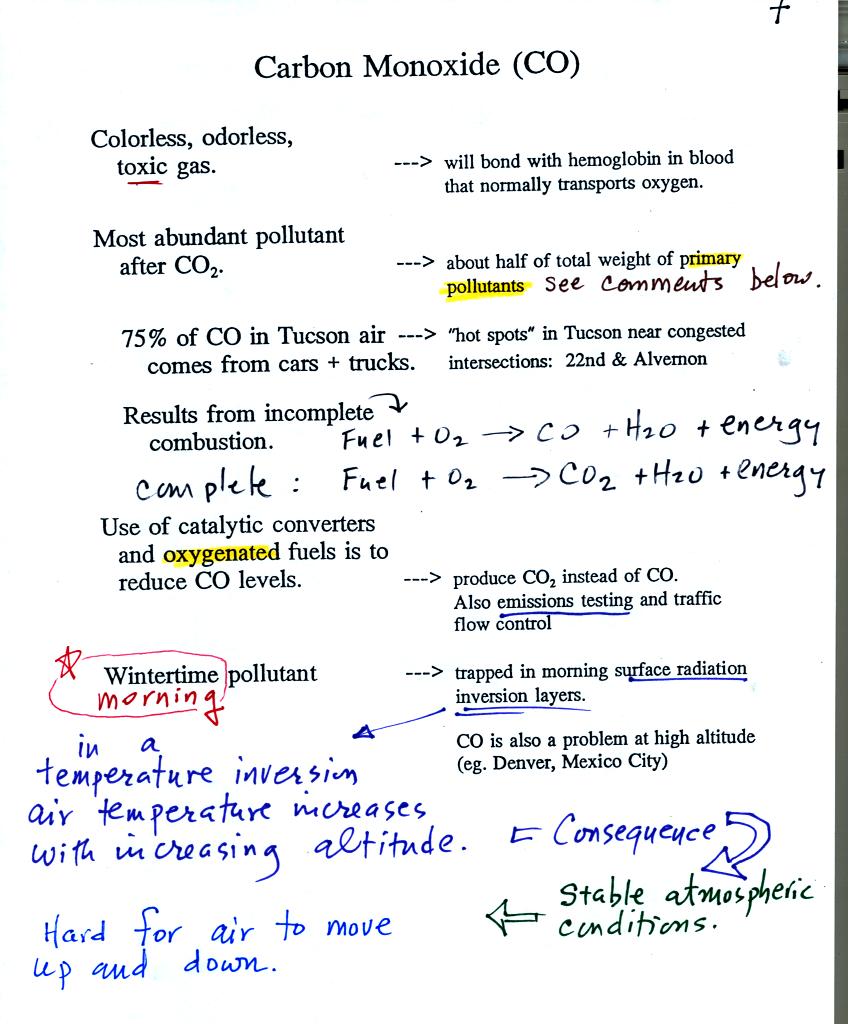
Carbon monoxide molecules bond strongly to the hemoglobin
molecules in
blood and interfere with the transport of oxygen through your
body. CO is a primary pollutant. That means it goes
directly from a source into the air (nitric oxide, NO, and sulfur
dioxide, SO2, are also primary pollutants). CO is
emitted directly from an automobile tailpipe into the atmosphere for
example
CO is produced by incomplete combustion of fossil
fuel. Complete combustion would produce carbon dioxide,
CO2. Cars and trucks produce much of the CO in
the
atmosphere. Vehicles must now be fitted with a catalytic
converter which will change CO into CO2 (and also NO into N2
and
O2). In Pima County vehicles must pass an emissions
test every
year and special formulations of gasoline (oxygenated fuels) are used
during the winter months to try to reduce CO emissions. See if
you can figure out why carbon monoxide is often a problem in cities at
high altitude (the answer is found at the bottom of today's online
notes)
Carbon monoxide is also a serious hazard indoors.
Because it is odorless, concentrations can build to dangerous levels
without you being aware of it. You can purchase a carbon monoxide
alarm that will monitor CO concentrations indoors and warn you when
concentrations reach hazardous levels. Indoors CO is
produced by gas furnaces and water heaters that are
either operating improperly or aren't being adequately vented
outdoors. Many people are killed indoors by carbon monoxide every
year. You can learn
more about carbon monoxide hazards and risk prevention at the Consumer Product
Safety Commission web page.
In the atmosphere CO concentrations peak on winter mornings.
Surface temperature inversion layers form on long winter night when the
ground becomes colder than the air above. Air in contact with the
cold ground cools and ends up colder than air above. Air
temperature increases with increasing altitude in a temperature
inversion and this produces a very stable layer of air at ground level.
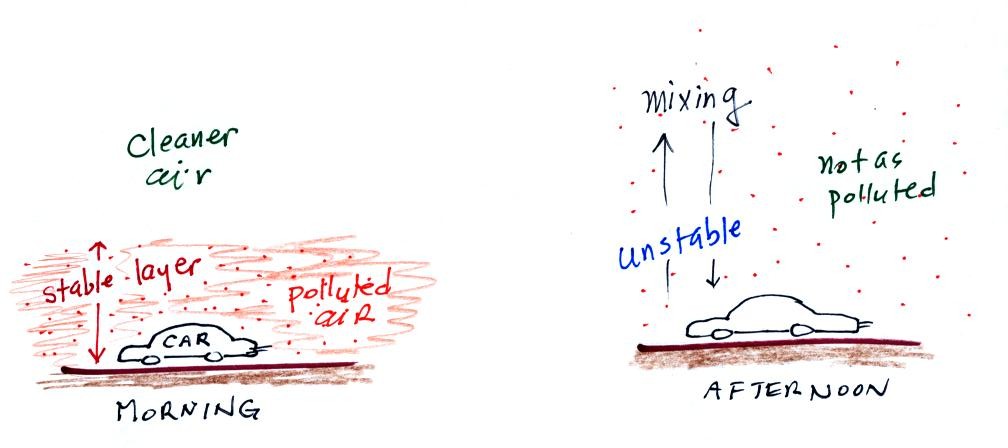
When CO is emitted into a thin stable layer (left figure above), the CO
remains in the layer and doesn't mix with cleaner air above. CO
concentrations build.
In the afternoon the atmosphere becomes more unstable. CO emitted
into air at the surface mixes with cleaner air above. The CO
concentrations are effectively diluted and don't get as high as they do
in the morning.
A portion of a time lapse cloud move was shown at the end of
class. Thunderstorms were developing over the Catalina
mountains. Thunderstorms are a visible indication of unstable
atmospheric conditions.
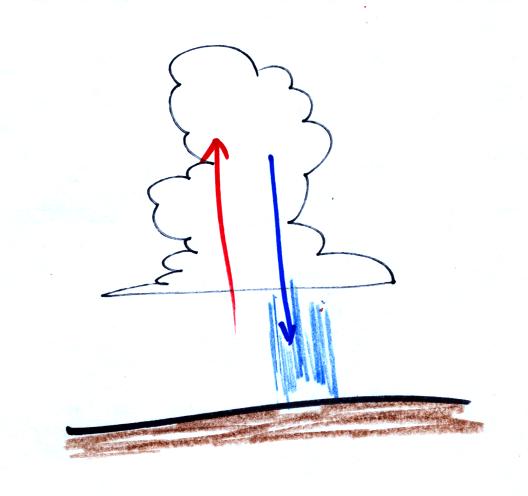
You could see the clouds growing vertically in the movie, evidence of
rising air motions. Falling precipitation also produces a
downdraft, sinking air motions. This downdraft is the source of
the strong, often damaging, surface winds that accompany thunderstorms.
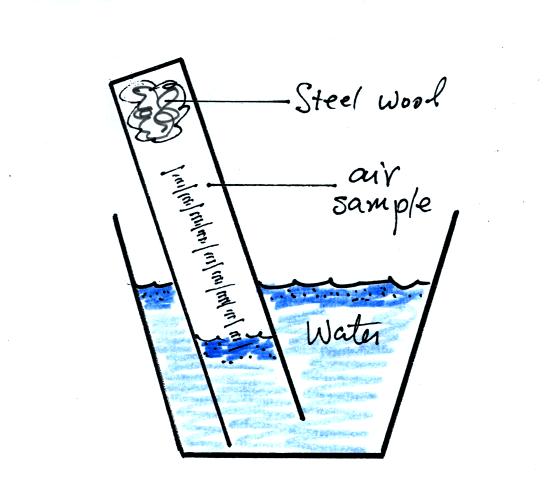
The object
of this experiment is to measure the percentage concentration of the
oxygen in air. Basically a wet piece of steel wool is stuck into
a 100 mL graduated cylinder. The cylinder is turned upside down
and the open end is immersed in a cup of water. The air in the
graduated cylinder is sealed off from the rest of the atmosphere.
The oxygen reacts with the steel wool to form rust and is removed from
the air sample (it turns from a gas and becomes part of the rust, a
solid).
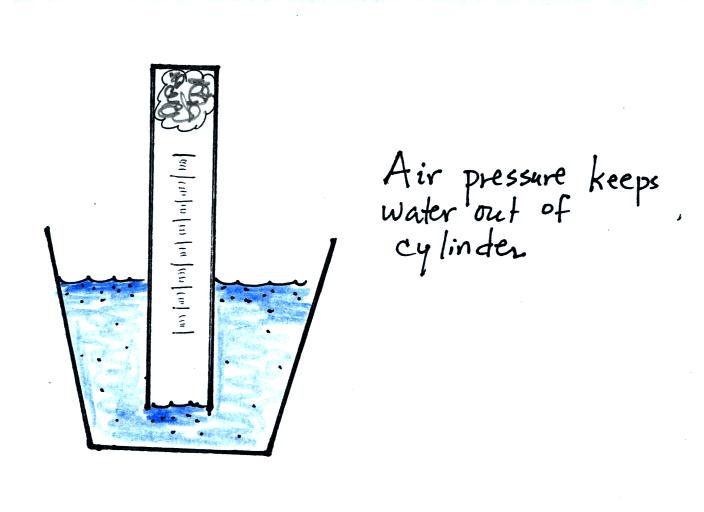
If you simply try to immerse the open end of the cylinder in a cup
of water you would find that the water doesn't enter the
cylinder. Air pressure keeps the water out. You want the
water to enter partway into the cylinder so that the water level can be
read on the cylinder scale.
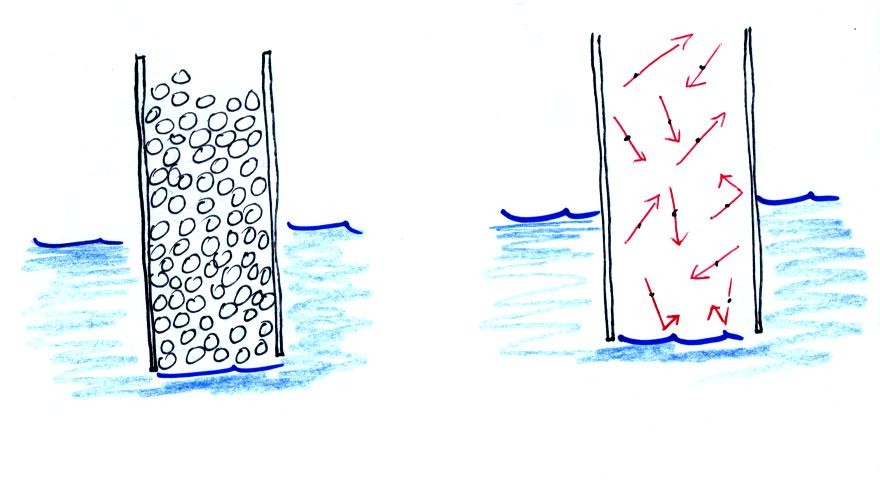
Note that it isn't that the cylinder is full of air that
keeps the
water out (as shown above at left), there's actually a lot of empty
space in the cylinder. Rather it is the fact that the air
molecules are moving around inside the cylinder at 100s of miles per
hour and they strike the water molecules with enough force that the
water can't move into the cylinder.
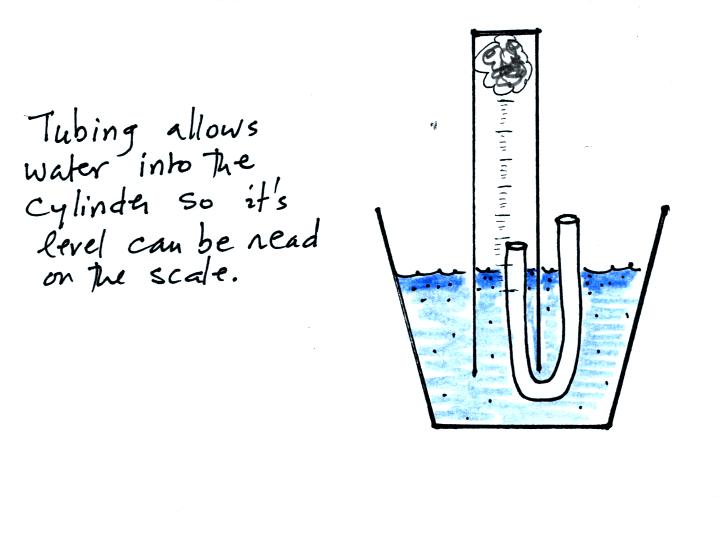
The solution to this problem is to insert a small piece of
flexible tubing into the cylinder as shown above. If you lower
the cylinder into the water while keeping the two ends of the tubing
out of the water, water will enter the cylinder. When the water
level can be read on the scale (ideally between the 90 and 100 ml
marks), the tubing is removed. This seals off the air sample and
the experiment is underway.
You can carefully rest the cylinder against bottom and side of the
cup. Be sure to tell any friends or roommates to leave your
experiment materials alone.
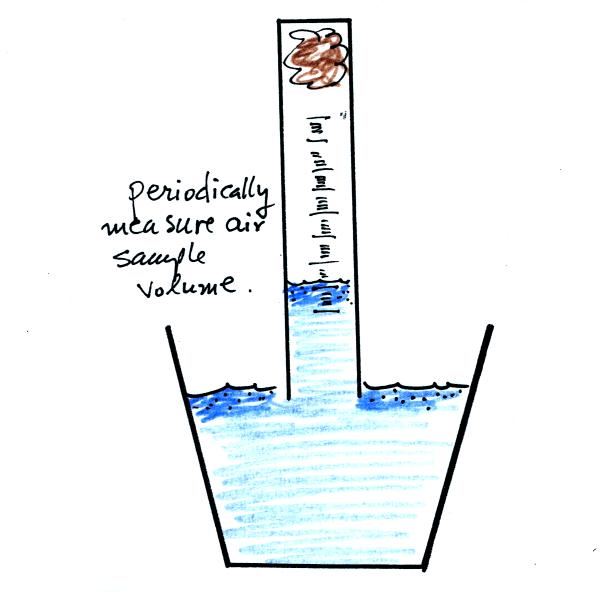
Periodically lift the cylinder just enough to be able to read the
water level. Don't lift the open end of the cylinder out of the
water as this would break the seal and you would need to restart the
experiment (extra pieces of steel wool will be available in class
should this happen). Also make a note of the time.
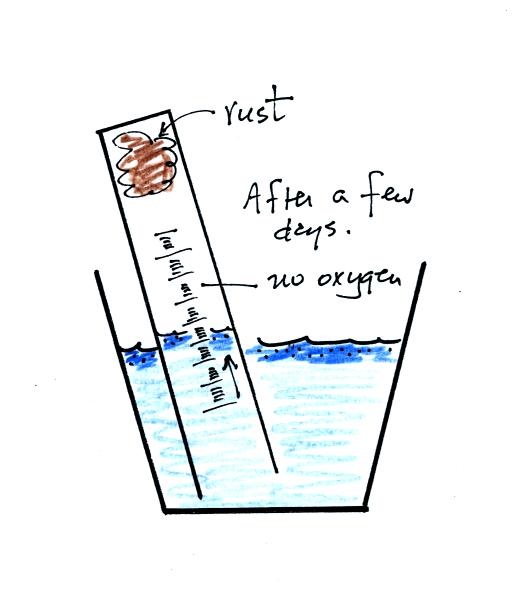
After some time you will notice that the water level doesn't
change between readings. All of the oxygen in the sample has been
removed and the experiment is over. The figure below shows you
one way of removing the steel wool (which should then be
discarded). Return the materials to class and pick up the
supplementary information handout.
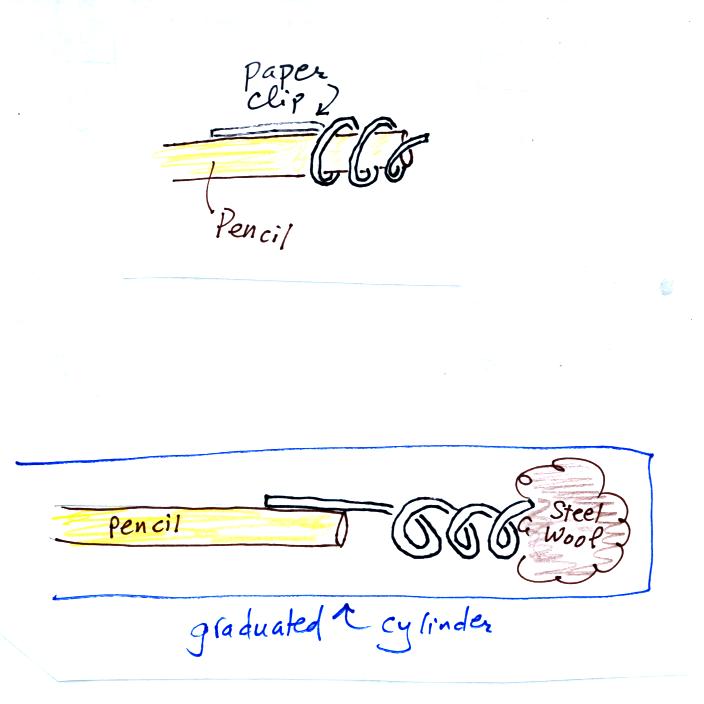
Straighten the paper clip supplied with the experiment and
then bend
about 2/3 rds of it around the end of a pencil to form a
corkscrew. Attach the corkscrew to the end of the pencil and then
insert it into the cylinder. With a list twisting the corkscrew will
snag the steel wool and you will be able to pull it out of the cylinder
and dispose of it.
Answer to the question found earlier in
the notes:
The air in high altitude cities is thinner (less dense) than at lower
altitude. There isn't as much oxygen in a volume of air.
With oxygen in short supply, combustion of fuels will more likely be
incomplete and will produce CO rather than carbon dioxide.