Monday Aug.27, 2007
The remaining Expt. #1 kits have been
checked out. If you are
signed up to do Expt. #1 you will now have to wait until students begin
to return the materials that they have checked out (some additional
materials have also been ordered and should arrive soon). If you
have
your materials please start the experiment as soon as you can
so that
you can return the materials for someone else to use.
We'll
finish the section on carbon monoxide today. Last week we learned
that carbon monoxide is a primary pollutant produced by incomplete
combustion. Peak CO concentrations are observed on winter
mornings.
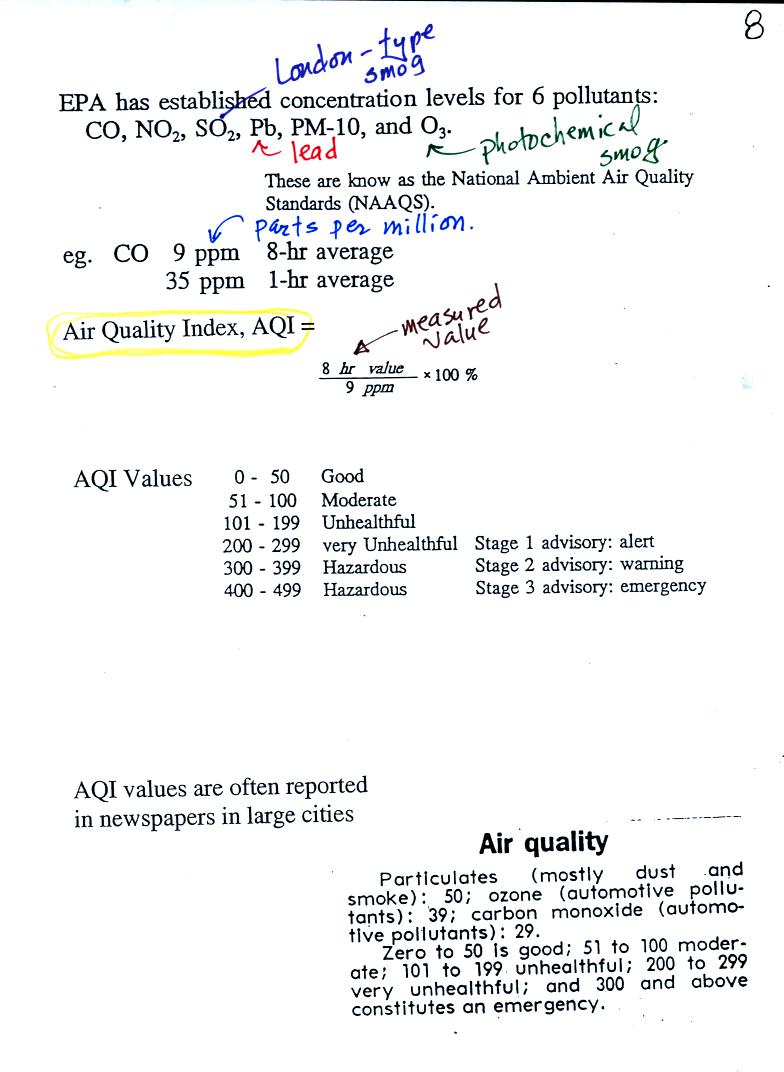
Six main pollutants are listed at the top of this page.
Concentrations of some or all of these pollutants are measured daily in
many
cities. The atmospheric concentration of lead has decreased
significantly since the introduction of unleaded gasoline. PM
stands for particulate matter. These small particles are
invisible, remain suspended in the air, and may be made of harmful
materials..
CO, O3 and particulate matter are the pollutants of most
concern in
Tucson and pollutant concentrations are reported in the newspaper or on
television using the Air Quality Index (formerly the pollutant
standards index). This is basically the measured value divided by
the allowed value multiplied by 100%. Current Air Quality Index values for
Tucson are available online.
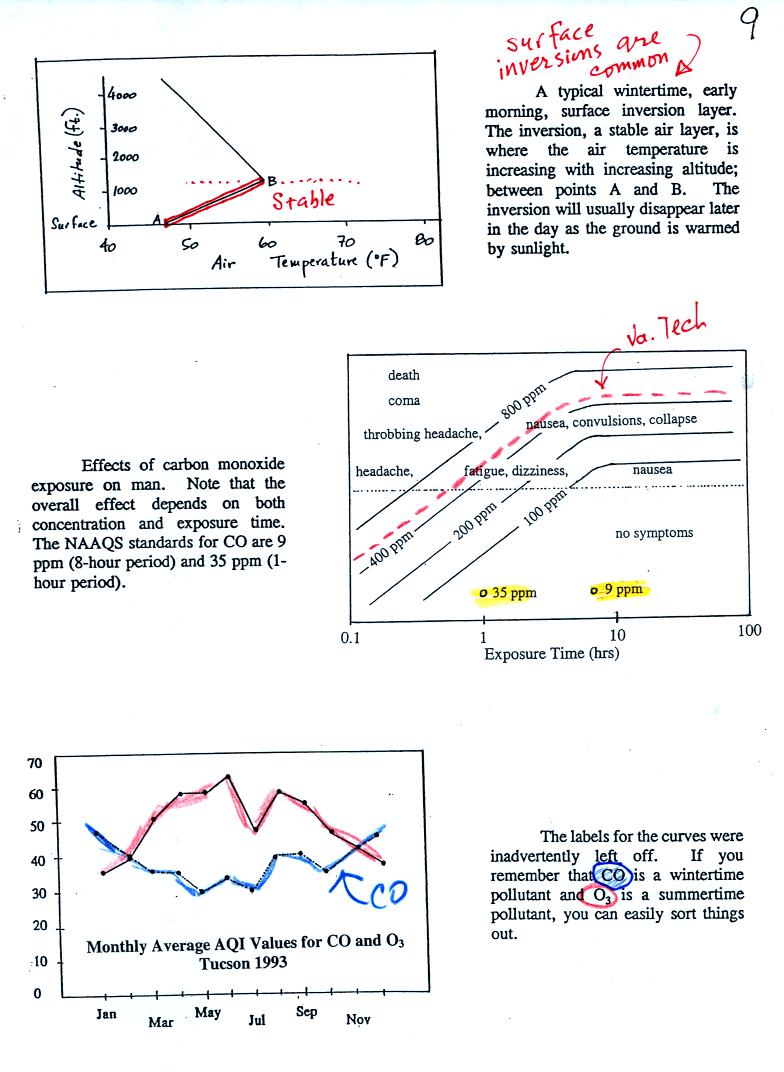
The first graphs shows a typical atmospheric temperature profile
near the ground in the winter. The inversion is the bottom
portion of the plot where temperature increases from 47 F to near
60 F with 1000 feet of altitude gain. The 1000 foot deep
layer is a stable layer.
The middle figure shows some of the health effets and symptoms of CO
poisoning. The effect of CO depends on both the concentration and
the length of exposure. The NAAQS values are shown at
bottom of the chart. Exposure to CO concentrations of these
levels shouldn't cause any symptons in a healthy individual.
Concentrations reached 500 ppm in the apartment building near the
campus of Virginia Tech. Several students were unconscious when
found by rescue personnel.
The bottom figure shows average monthly AQI values for CO and O3
in
Tucson. CO concentrations (blue curve) tend to peak on winter
mornings.

This rather
busy and confusing picture just illustrates how small changes in how
air temperature changes with increasing altitude can determine whether
the atmosphere will be stable or unstable. Just for the
purposes of illustration we imagine riding a bicycle from Swan and
River Rd up a hill to Swan and Sunrise (fhe figure shows an elevation
change of 1000 ft, it is actually quite a bit less than that)
At far left the air temperature drops 6o F. This is a
fairly
rapid rate of decrease with increasing altitude and would make the
atmosphere
absolutely unstable. The atmosphere wouldn't remain this
way. Air at the ground would rise, air above would sink, and the
temperature profile would change. In some ways it would be like
trying to pour vinegar on top of oil in a glass. The lower
density oil would rise because it would "want" to float on top of the
higher density vinegar.
The next picture shows air temperature decreasing a little more slowly
with increasing altitude. This small change makes the atmosphere
conditionally unstable (we won't go into the conditions). The
atmosphere is frequently in this state.
The atmosphere cools only 2o F in the next picture.
This creates
an absolutely stable atmosphere. Air at the ground will remain at
the ground and won't rise and mix with air higher up. Compare
this with the glass containing vinegar and a layer of oil on top.
The two layers won't mix.
Air temperature in the last figure actually increases with increasing
altitude, common on winter mornings in Tucson (and worth bicycling up
the hill on Swan Rd. just to experience on a cool winter morning).
This is a temperature inversion and produces very
stable conditions. If you do find yourself on a bicycle at
Swan and Sunrise, check out the very steep section at the far northern
end of Swan.
Next we
will turn our attention to ozone.
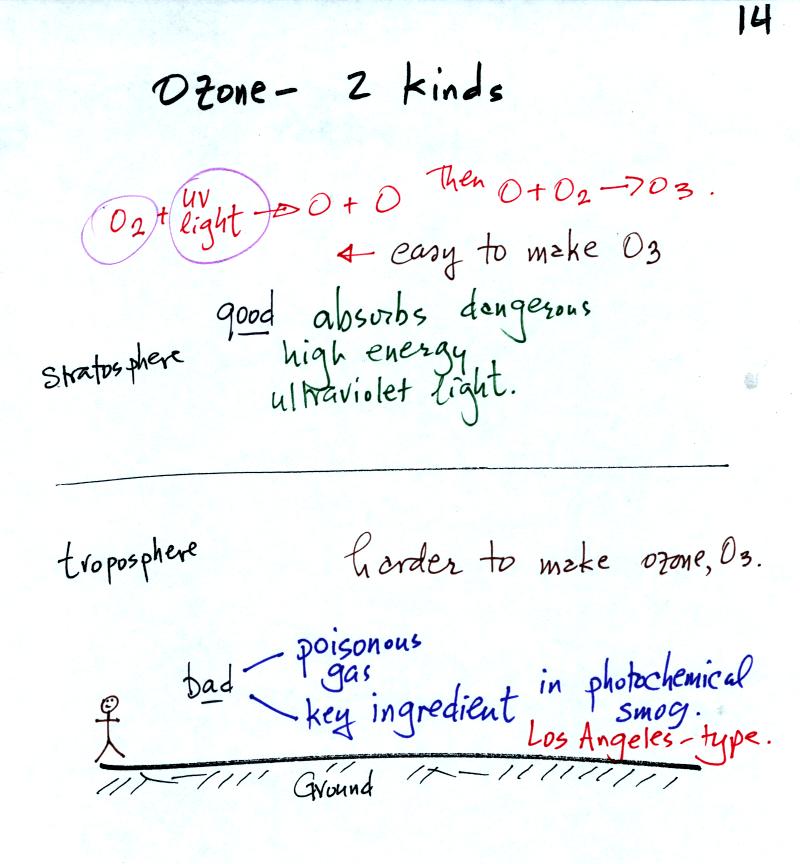
Ozone has a Dr. Jekyll and Mr. Hyde personality.
Ozone in the stratosphere is beneficial, it absorbs dangerous high
energy ultraviolet light (which would otherwise reach the ground and
cause skin cancer, cataracts, and many other problems).
Ozone in the troposphere is bad, it is a pollutant.
Tropospheric
ozone is also a key component of Los Angeles type or photochemical smog.
We'll be making some photochemical smog as a
class
demonstration. This will require ozone (and a hydrocarbon of some
kind). We'll use the simple stratospheric process for making
ozone in the demonstration rather than the more complex tropospheric
process.
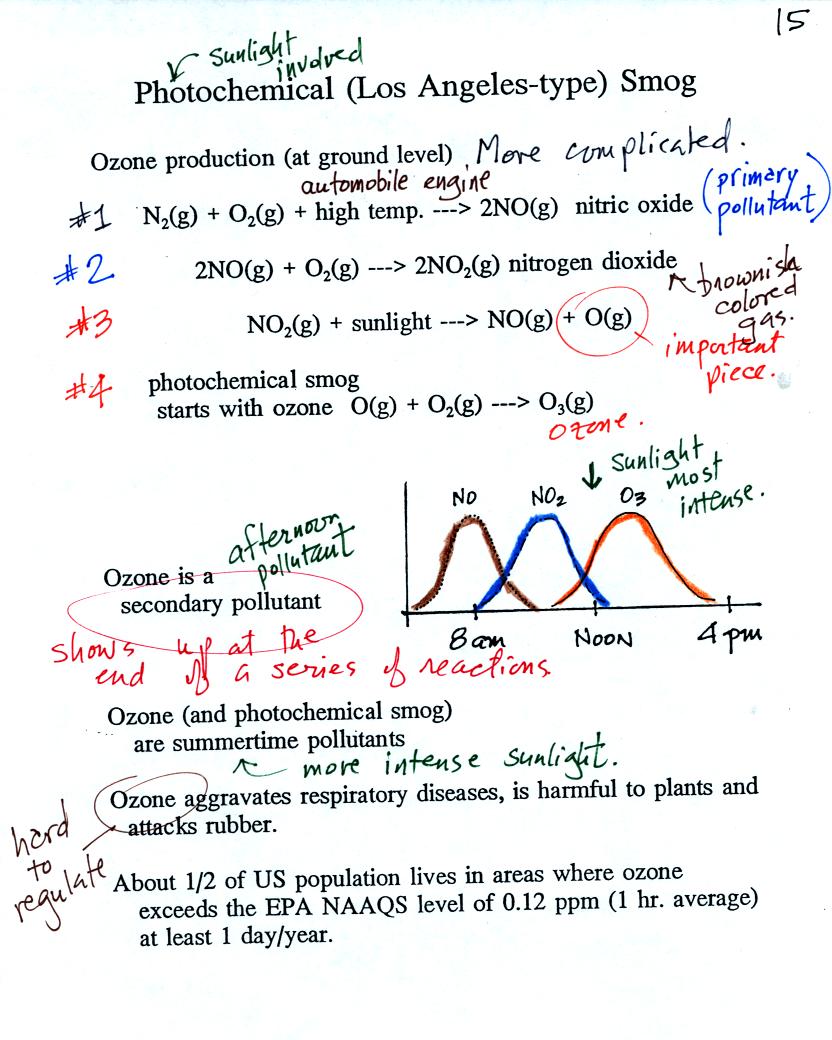
At the top of this figure you see that a more complex series
of
reactions is responsible for the production of tropospheric
ozone. The production of tropospheric
ozone begins with nitric
oxide
(NO). NO is produced when nitrogen and oxygen are heated (in an
automobile engine for example) and react. The NO can then react
with oxygen to make nitrogen dioxide, a poisonous brown-colored
gas. Sunlight can dissociate (split) the nitrogen dioxide
molecule producing atomic oxygen (O) and NO. O and O2
react (just
as they do in the stratosphere) to make ozone (O3).
Because ozone
does not come directly from an automobile tailpipe or factory chimney,
but only shows up after a series of reactions, it is a secondary
pollutant. Nitric oxide would be the primary pollutant in
this example.
NO is produced early in the day (during the morning rush hour).
The concentration of NO2
peaks
somewhat later. Peak ozone concentrations are usually found in
the afternoon. Ozone concentrations are also usually higher in
the summer than in the winter. This is because sunlight plays a
role in ozone production and summer sunlight is more intense than
winter sunlight.
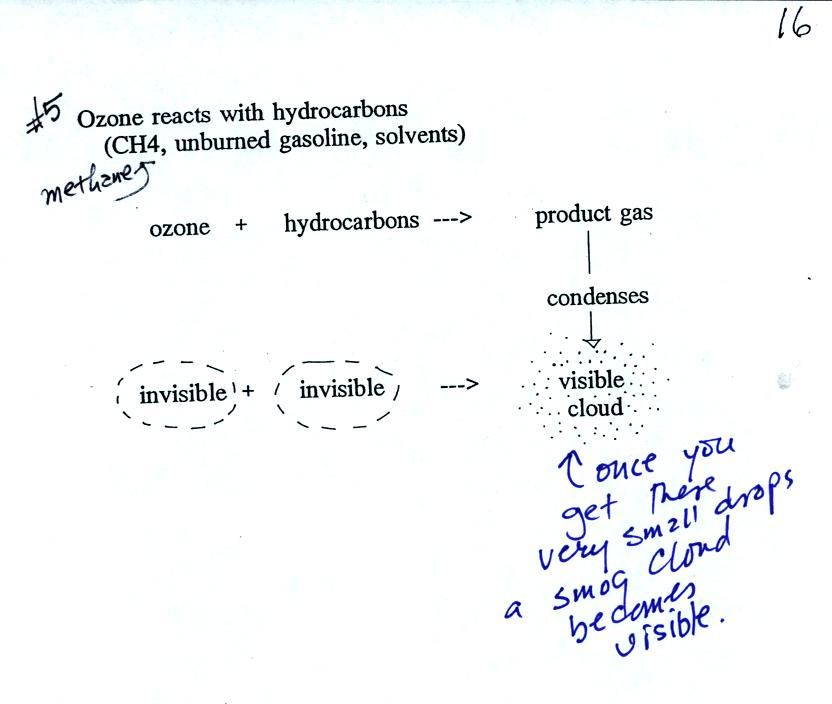
As shown in the figure below,
invisible ozone can react with a hydrocarbon of some kind which is also
invisible to make a
product
gas. This product gas sometimes condenses to make a visible smog
cloud or haze.
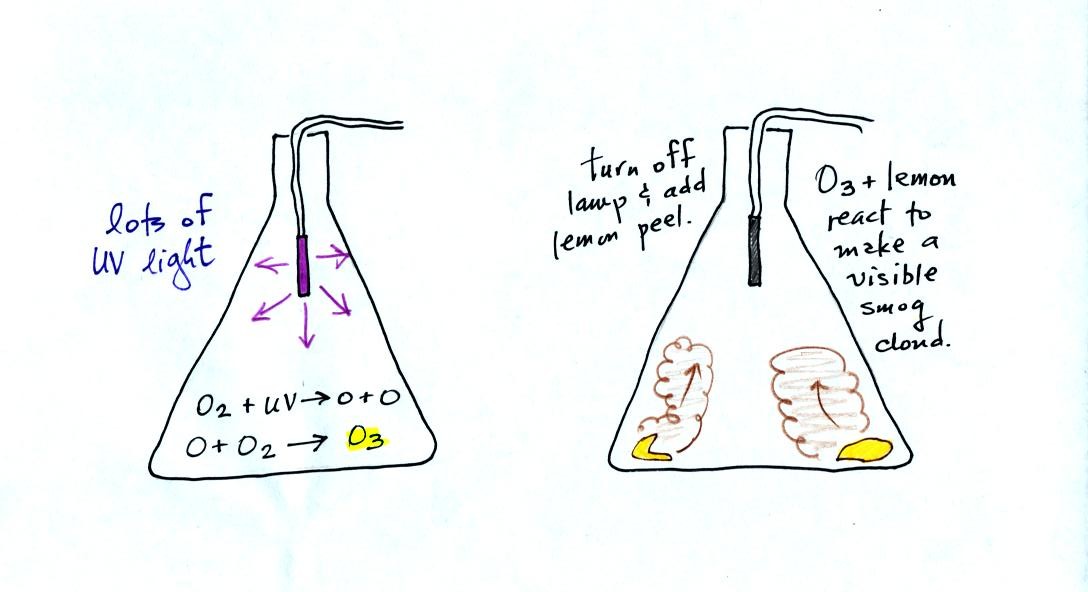
The class demonstration of photochemical smog is summarized
below (a flash was used instead of the aquarium shown on the bottom of
p. 16 in the photocopied class notes). We begin by using the UV
lamp to fill the flask with
ozone. Then a few pieces of fresh lemon peel were added to the
flask. A whitish cloud quickly became visible (colored brown in
the figure below).
On Wednesday we will look at stratospheric ozone in a little more
detail and at anthropogenic destruction of stratospheric ozone
(thinning of the ozone layer). We'll briefly learn about sulfur
dioxide and London-type smog. Then we will begin the middle
portion of Chapter 1 that deals with the vertical structure of the
atmosphere (changes of air pressure, air temperature, and air density
with altitude). Some new reading will be assigned on Wednesday.


