Tuesday Nov. 6, 2007
The graded Experiment #3 reports were returned in class today.
You now have two weeks to revise your report if you wish to. The
revised reports are due Tue., Nov. 20. Please return the original
report with the revised report.
About half of the 1S1P Topic 4 reports and all of the Topic 4
worksheets have been graded and were returned. Note that 1S1P
Assignment #3 is now online. Note that there
are
two due dates. If
you plan to turn in two reports (the maximum allowed), at least one of
the reports must be turned in on the Thu. Nov. 15 due date. The
second due date, Tue., Nov. 20 is the Tuesday before Thanksgiving.
A new optional assignment was handed out in class. It will be due
Tuesday next week, Nov. 13.
We'll
cover a variety of topics in the final month of the semester.
We'll start in Chapter 6 by learning more about the forces that cause
winds.
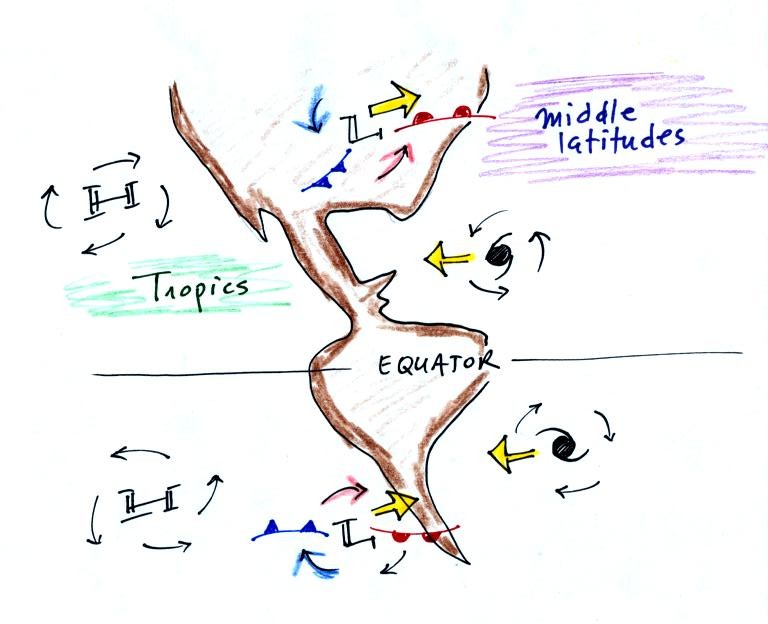
The Coriolis Force is one of these. You
shouldn't leave NATS 101 Intro. to Weather and Climate
without
having been introduced to the Coriolis Force. It is part of the
reason why winds spin counterclockwise (CCW) around Low
pressure
and clockwise (CW) around High pressure in the northern
hemisphere. It also explains why winds spin in the opposite
directions around Highs and Lows in the southern hemisphere.
You may already have been
to the southern hemisphere or you may go there one day. You'll
probably hear about how the Coriolis force or the Coriolis effect
causes water to spin in a different direction in the southern
hemisphere when it is draining out of a sink and toilet bowl (it's not
true).
That's another reason for covering the Coriolis effect in NATS
101.
In Chapter 7 we'll learn why middle latitude storms move in the same
direction, from west to east, in both the northern and southern
hemispheres. Hurricanes move from east to west in both
hemispheres, this is also explained in Chapter 7.
Today we
will look again at upper-level charts, something we covered earlier in
the semester.
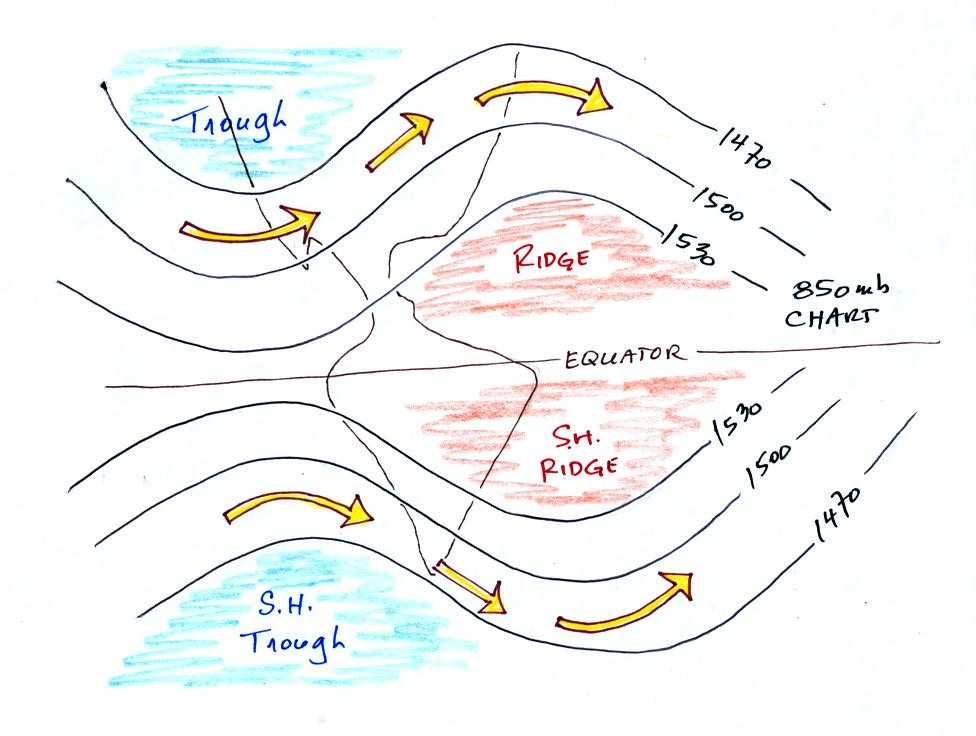
By the end of today's class you should understand what the title "850
mb Chart" on the upper level map above refers to. You should also
understand what the numbers on the contour lines represent and what
their units are. Note that the values on the contours decrease as
you move from the equator toward higher latitude. You
should understand why that happens (temperature also decreases as you
move toward higher latitude, maybe that is the explanation). You
should understand why troughs and ridges are associated with cold and
warm air, respectively.
The upper level winds blow parallel to the contour lines from west to
east in both hemispheres. The winds sometimes turn right,
sometimes left. Once we learn more about the forces that govern
wind motions, you'll understand what causes this.
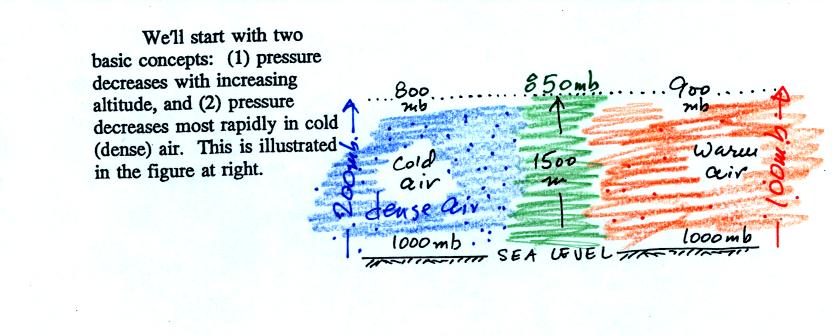
You really only need to remember two things from earlier in the
semester (you'll find the figure above at the bottom of p. 115 in the
photocopied Classnotes): (1) pressure decreases with increasing
altitude, and
(2) pressure decreases rapidly in cold high-density air [it decreases
more slowly with increasing altitude in warm, low-density air].
This is shown at the bottom of the figure above. Pressure drops
from 1000 mb to 800 mb when moving upward 1500 meters in the cold
air. It decreases from 1000 mb to 900 mb in the same distance in
the warm low density air.
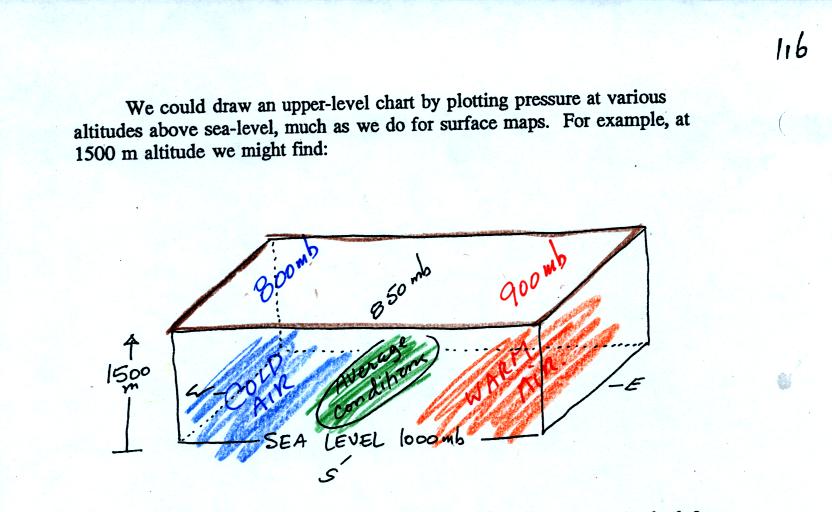
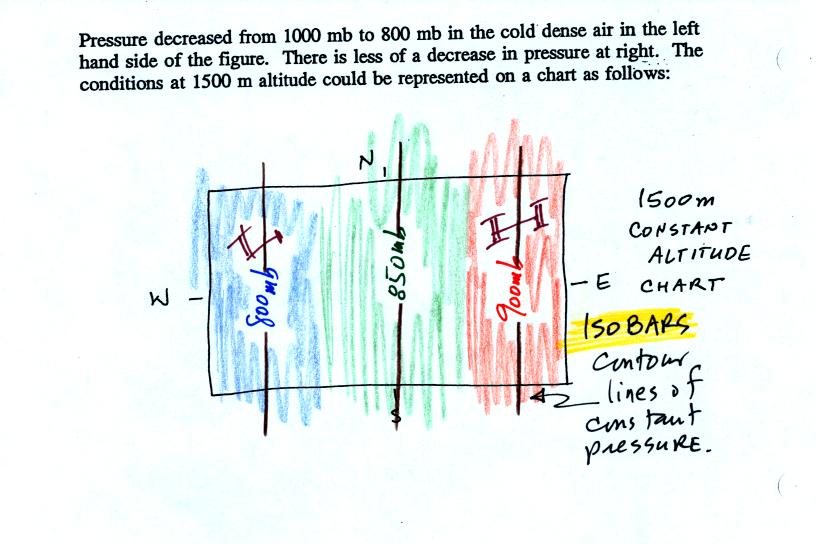
One way of depicting upper level conditions would be
to measure
pressure values at some fixed altitude above the ground. This
approach is shown above. Pressures range from 800 mb to 900 mb at
1500 meters altitude. The
pressure pattern could then be plotted on a constant altitude chart
using isobars (figure below). Note the lowest pressures are found
in the
cold air, higher pressures would be found in the warm air.
Note a surface weather map is a constant altitude chart (sea level
altitude).
That would
seem to be a logical way of mapping upper level atmospheric
conditions. Unfortunately that isn't how things are done.
Just to make life difficult for NATS 101 students
meterologists do
things differently. Rather than plotting conditions
at a constant altitude
above the
ground, meterologists measure and plot conditions at a particular
reference pressure level above the ground.
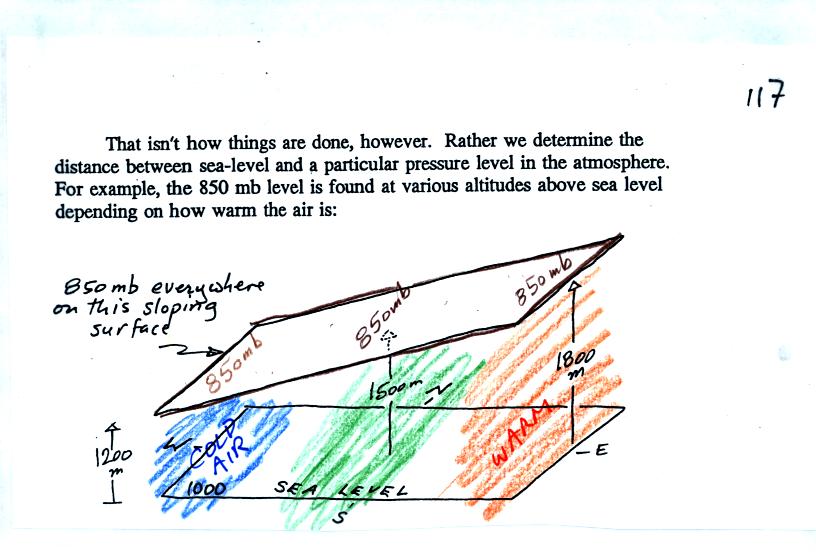
In the picture above you start at the ground (where the pressure is
1000 mb) and travel upward until you find the pressure has dropped to
850 mb. You
make a note of the altitude at which that occurs. In the cold
dense air at the left pressure decreases rapidly so you wouldn't need
to go very
high, only 1200 meters. In the warm air at right pressure
decreases more
slowly, you would have to going higher, to 1800 m.
Every point on the
sloping surface above has the same pressure, 850 mb. The altitude
above the ground is what is changing. You could draw a
topographic map of the sloping constant pressure surface by
drawing contour lines of altitude or height.
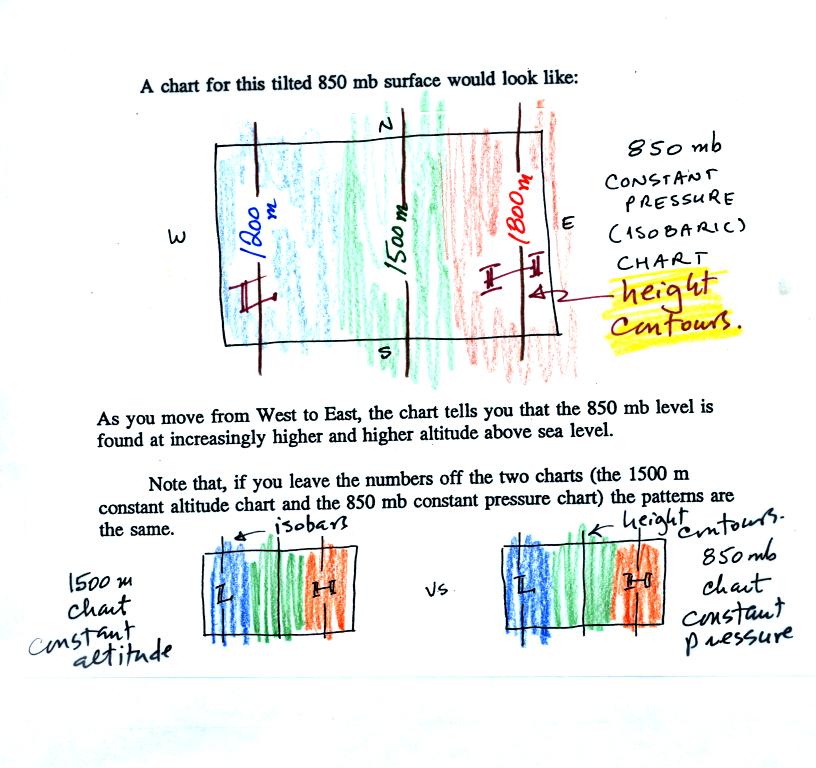
The two inds of charts (constant altitude or constant pressure) are
redrawn at the bottom of the picture above. The numbers on the
contour lines have been left off in order to clearly see that both
types of maps have
the same overall pattern (they should because they're both depicting
the same
upper level atmospheric conditions).
In the example above temperature changed smoothly from cold to warm as
you move from left to right (west to east).
See if you can figure out what temperature pattern is producing the
wavy 850 mb constant pressure surface below.
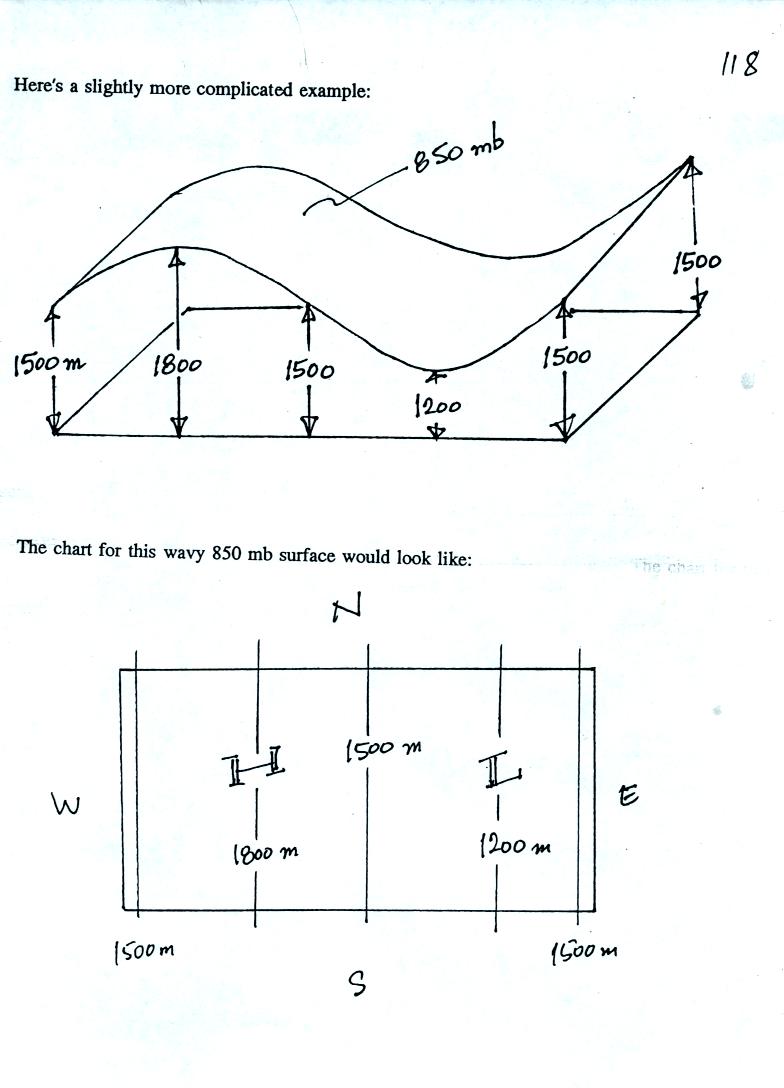
It shouldn't be too hard if you remember that the 850 mb level will be
found at relatively high altitude in the warm air where pressure
decreases slowly with increasing altitude. The 850 mb level will
be found closer to the ground in cold air where pressure decreases
rapidly with increasing altitude. Click here when you think you
have
it figured out.
In the next figure we are going to add south to north temperature
changes in addition to the west to east temperature gradient.
Here's what the temperature pattern will look like.
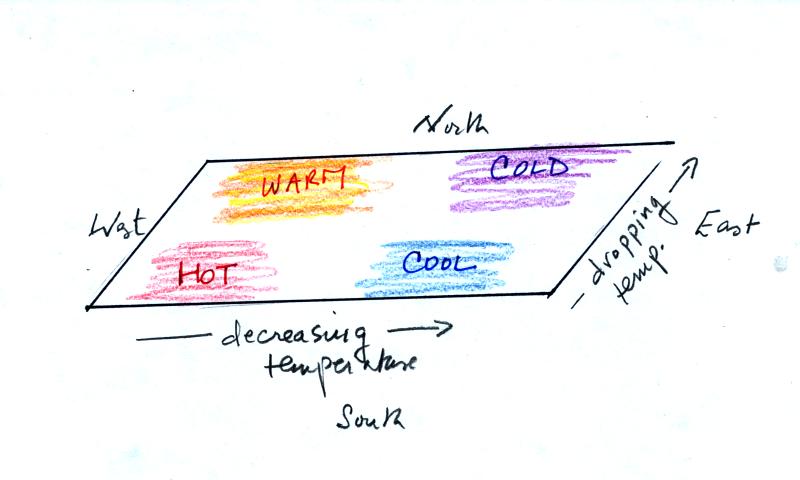
Temperature drops as you move from west to east (as it did in the
previous pictures) and now it drops as you move from south to
north. What will the wavy 850 mb constant pressure surface look
like now? Click here
when you think you know (or if you just want to see the answer and
would rather not think about it).
Now let's go back to the figure at the top of p. 115 in the photocopied
Classnotes.
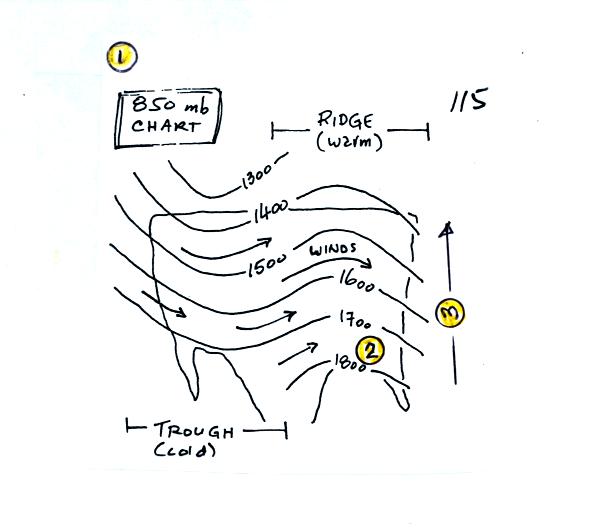
1. The title tells you this is a map depicting the 850 mb constant
pressure level in the atmosphere.
2. The numbers on the contour lines (height contours) are
altitudes (the units are meters)
3. The numbers get smaller as you head north because the air up
north is colder. The 850 mb level is closer to the ground (closer
because pressure decreases rapidly in cold dense air, you don't have to
go as high before you reach 850 mb pressure).
Here's
another figure with some questions to test your understanding of this
material.
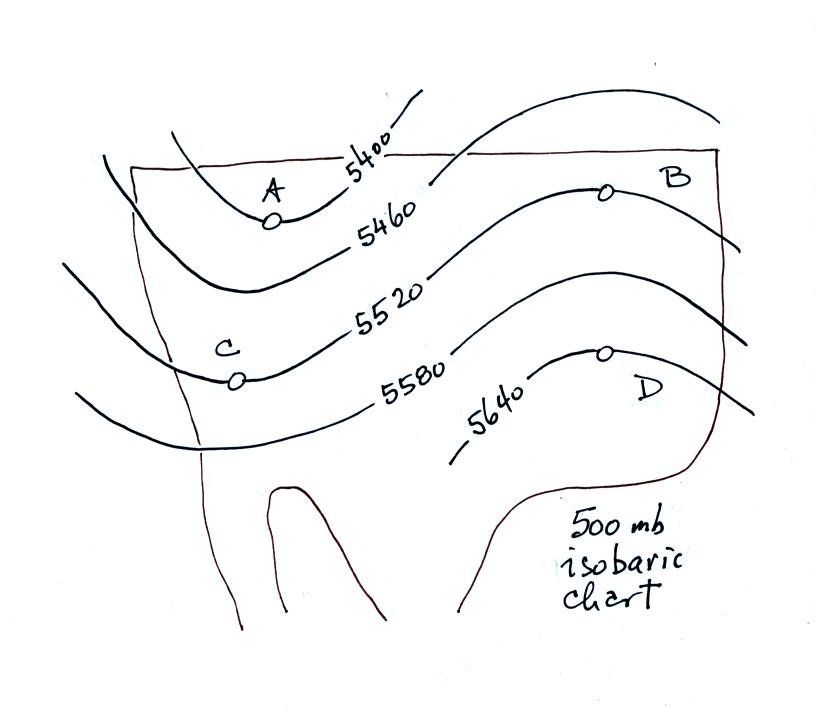
This is a 500 mb constant
pressure chart not an 850 mb chart like in the previous examples.
The values on the height contours are larger, the 500 mb pressure level
is higher than the 850 mb level.
Is the pressure at Point C greater than, less
than, or equal to the pressure at Point D (you can assume that Points C
and D are at the same latitude)? How do the pressures at Points A
and C compare?
Which of the four points is found at the lowest altitude above the
ground, or are all four points found at the same altitude?
The coldest air would probably be found below which of the four
points? Where would the warmest air be found?
What direction would the winds be blowing at Point C?
Click here
for all the
answers.
We're
working toward understanding what causes winds to blow the way they
do. The next step will be to learn about the forces that cause
the wind to blow. Before doing that we need to
review Newton's 1st and 2nd laws of motion.
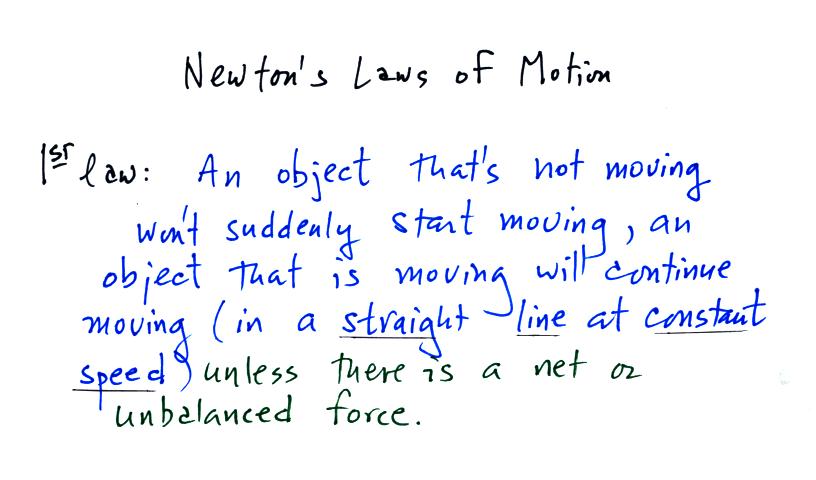
The 1st law really has two parts: one that deals with
stationary
objects and another part that treats moving objects.
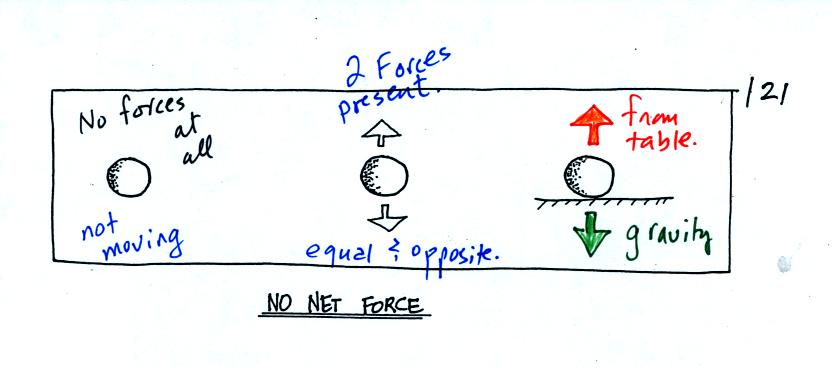
Stationary objects are shown in all three figures
above (found on p. 121 in the photocopied Class Notes). In
the left example there aren't any forces at all being exerted on the
object, there is no reason for it to suddenly start to move. In
the middle and right examples there are two forces present but they are
of equal strength and point in opposite directions. They cancel
each other out and the net or total force is zero. Again the
stationary object won't suddenly begin to move.
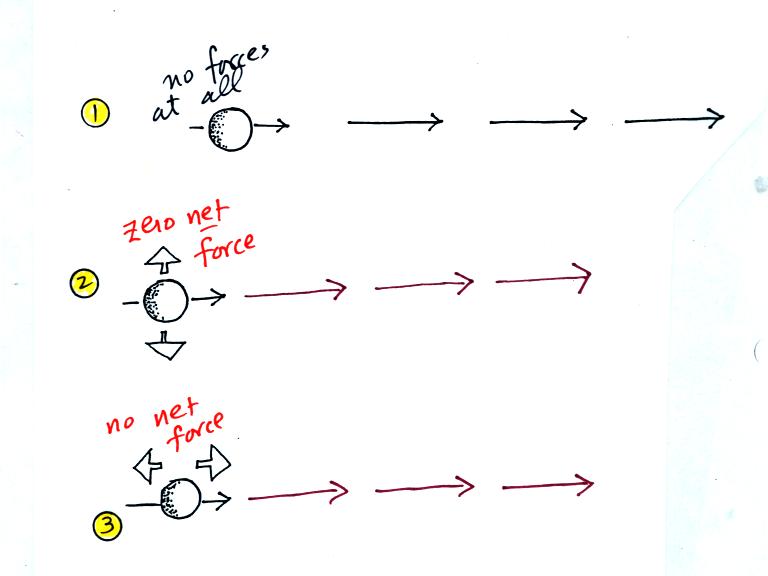
Here are moving objects. In the first example above
there aren't any forces at
all. In Examples #2 & #3 and #4 & #5 below (on p. 121 in
the photocopied notes) the
net force is zero (the two forces present cancel each other
out). The objects will continue to move in a
straight line at constant speed (the thin arrows show the direction of
motion, the length of the arrow provides an idea of speed.
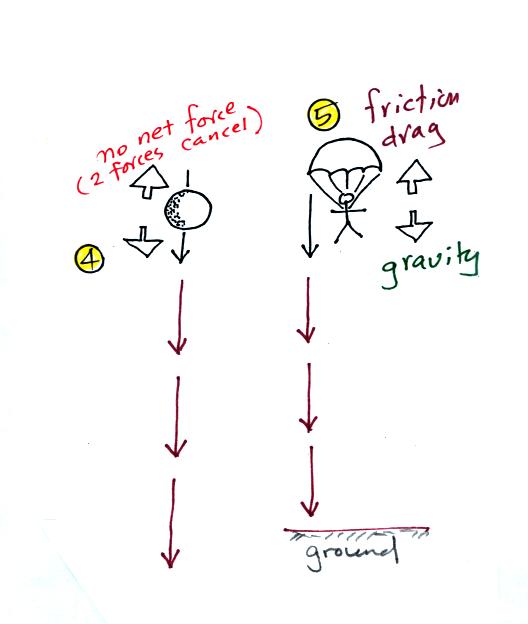
We are used to seeing falling objects pick up speed as they
fall. But if an upward drag or friction force becomes strong
enough to balance the downward pull of gravity, the net force is
zero, and the object will fall at constant speed. Parachutists
take
advantage of this.
Next
we will look at the motion that occurs when a net force is
present. You should be able to look at the motion and determine
whether a net force is needed (if the motion is anything but straight
line motion at constant speed, then a net force is present).
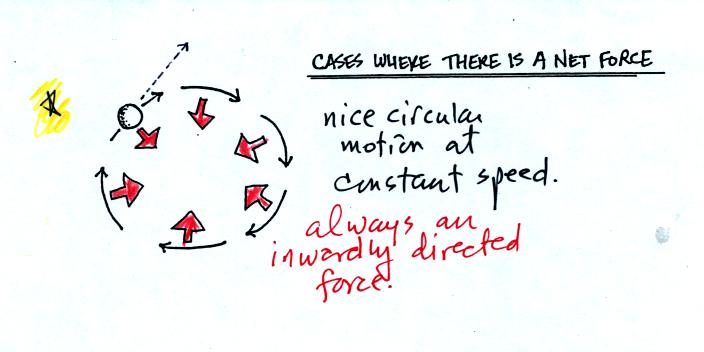
If there were no net force at the point indicated,
Newton's 1st law of
motion would say the object would travel in a straight line at constant
speed (the dotted line). But the object turns to the
right. A force acting perpendiculary and to the right of the
object's direction of motion is needed. A net inward force is
needed to keep an object moving in a circular path.
An example of circular motion would be a satellite orbiting
the earth
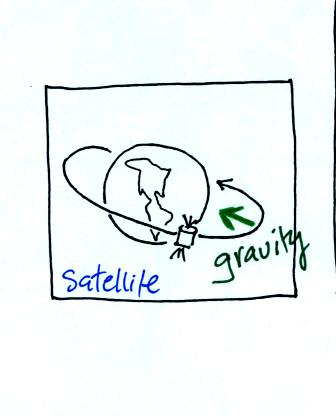
Gravity supplies the net inward force needed to keep the
satellite in a
circular orbit.
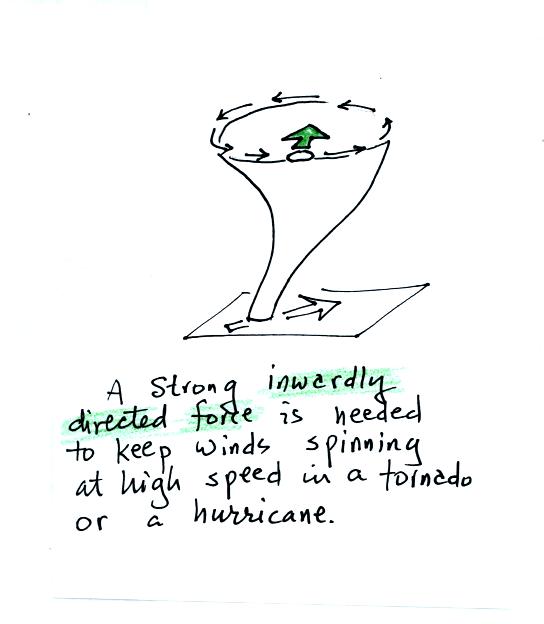
In the case of the rapid winds in a tornado, a very
strong inward force is needed (it turns out to be the pressure gradient
force
(PGF) or pressure difference force).
What we will be most interested in are the upper level winds
which, if
you remember from earlier in the semester, blow parallel to the contour
lines on an upper level chart from west to east.
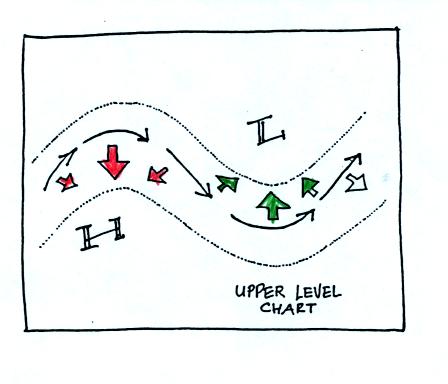
Note that the net force is sometimes to the right of the
wind and
sometimes to the left of the wind.
Newton's
1st law of motion tells you that if no net force is exerted on an
object the object will remain stationary or move in a straight
line. Newton's 2nd law (below) explains what happens when a net
force is present.
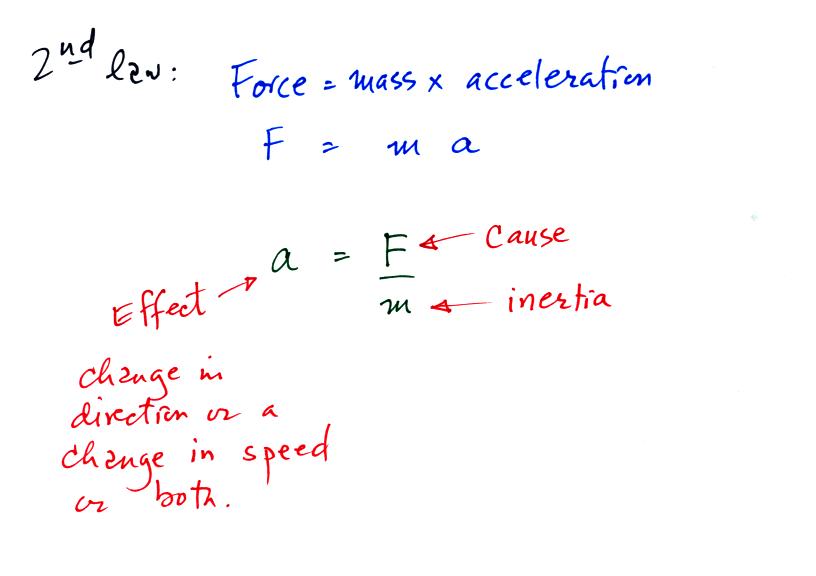
The 2nd law of motion really just says that if you exert a
net force on
an object it will accelerate. Acceleration can mean starting to
move, speeding up or slowing down, stopping, or starting moving in a
different direction.
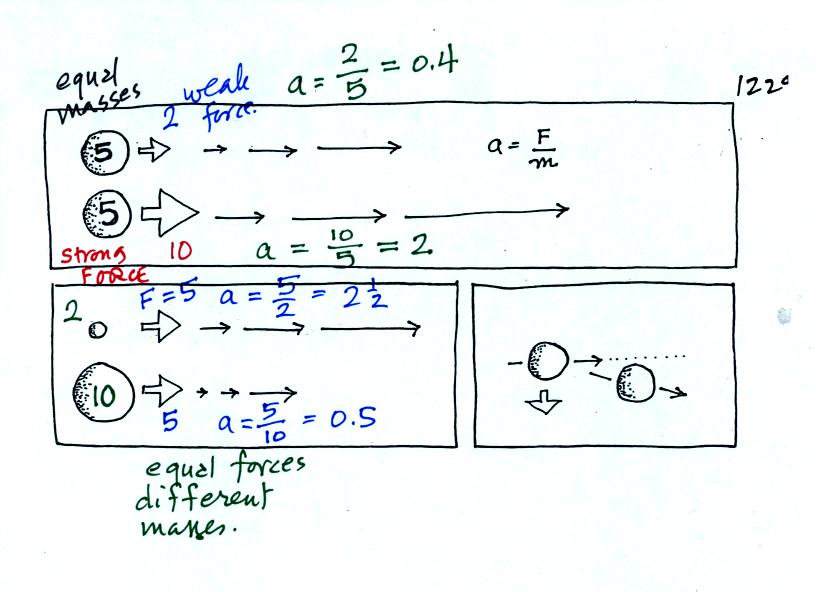
In the first example unequal forces (2 and 10) are applied
to
equal
masses (5 and 5), don't worry about the units. You
can calculate the acceleration
by dividing force by mass. This gives you the acceleration, the
lower object will speed up five times faster than the top object which
has a weak force exerted on it.
In the bottom example equal forces (5 and 5) are applied to two
different masses (2 and 10). Mass can be thought as being
inertia, or resistance to change. An object with a large mass is
resistant to a change of
direction or speed. A large object is harder to start moving than
a small object (imagine pushing a stalled Volkswagen and a stalled
Cadillac out of an intersection). The large mass accelerates 5
times more slowly than the smaller mass. Once the large mass gets
up to speed however, is is hard to slow it down (a decrease in speed
with time is a form of acceleration, we usually call it deceleration)
Note that a change in direction, with or without a change in speed, is
also a form of acceleration.
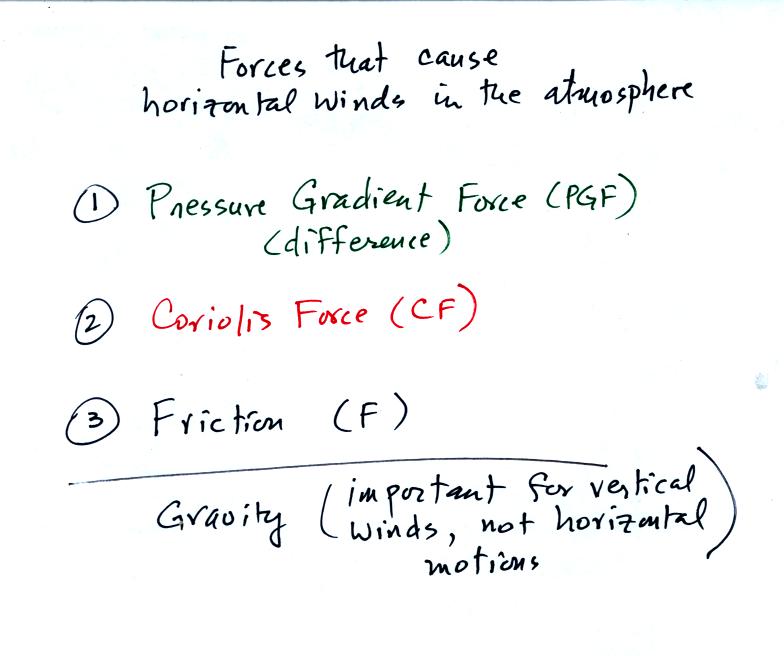
The first two forces above determine upper level winds; we'll
study
them first. For surface winds you must include the frictional
force.
Next we will try to understand what causes these forces. That's
pretty easy with the pressure gradient and frictional force, not so
easy with the Coriolis force. In each case we will learn rules
that determine the direction and the strength of these forces.
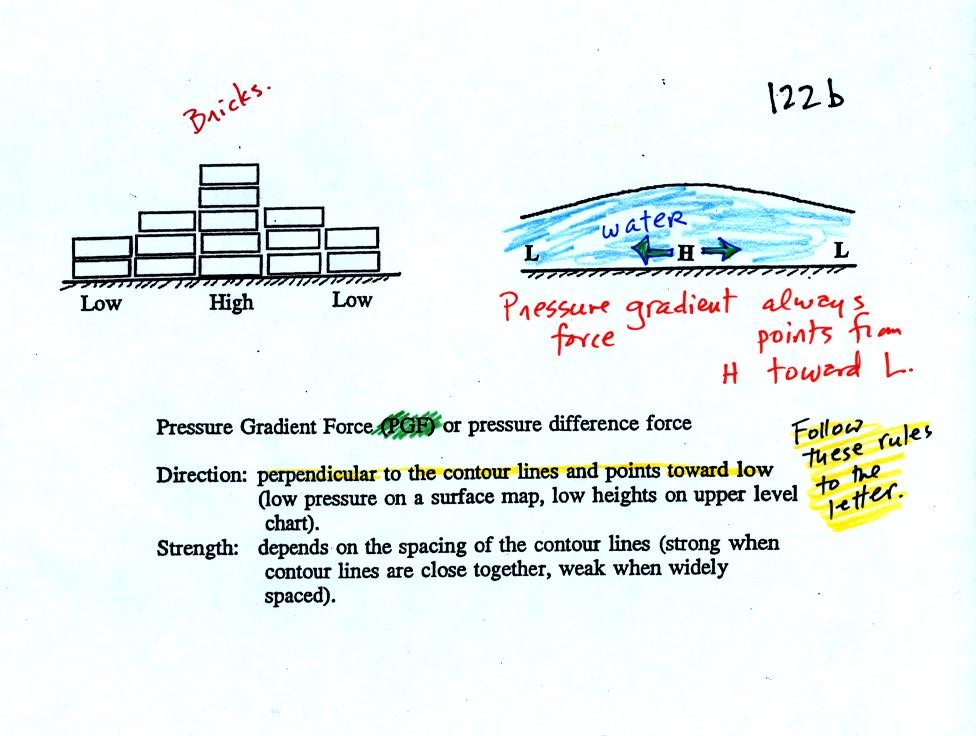
Pressure at any level in the atmosphere is determined by the
weight of the air overhead. If you stack up a bunch of bricks as
shown at upper left it is easy to understand that the pressure at the
bottom center of the picture would be higher than an the edges.
Now imagine carrying a bucket of water to the center of a swimming pool
and pouring it out on the water that is already there. You
wouldn't be able to pile up water at the center of the pool. As
soon as you tried the higher pressure at the bottom of the pool would
cause water to flow. The same kind of thing happens with
air. The pressure difference force pushes air from high to low
pressure.
The rules used, on weather maps, to determine the direction
and strength of the PGF are
given at the bottom of the picture.
Some examples of PGF force directions and relative strengths
are shown in the figure below. Note the analogy between weather
maps and geographical features like hills and valleys.
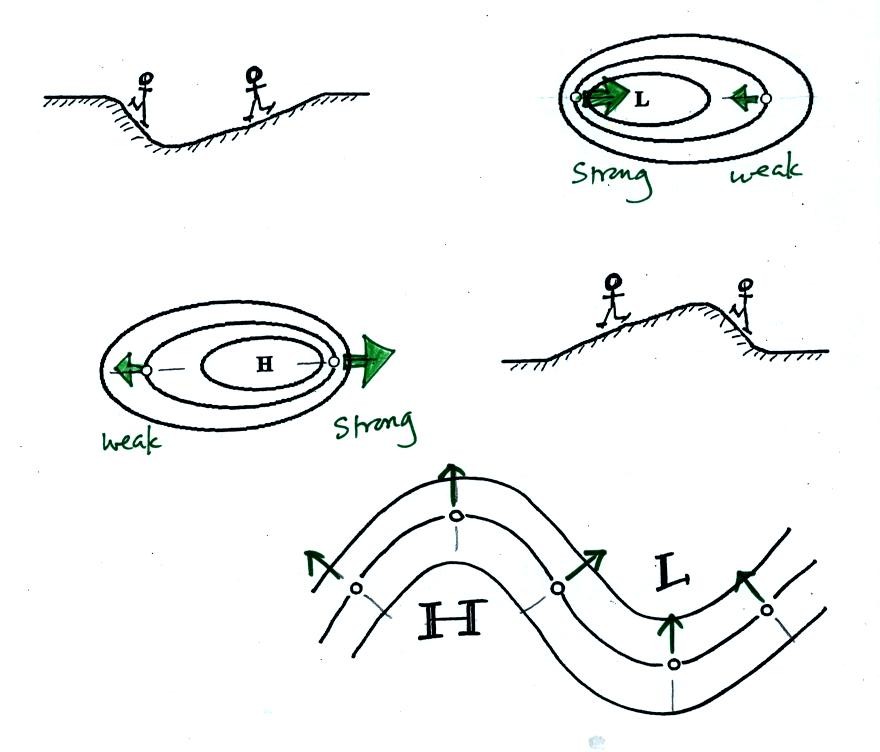
The pressure gradient force can cause stationary air to
begin to blow
(there is nothing in the rule that says the strength of the PGF depends
on wind speed). The next
figure wasn't shown in class.
In the top
example a stationary volume of air is placed in a center of low
pressure. The PGF will cause the air to begin to move toward low
pressure in the center of the picture. The dotted line shows the
direction of initial motion. This like placing a ball on the side
wall of a valley. The ball will roll downhill.
In the second example, a center of high pressure, the PGF causes a
stationary volume of air to again begin to move toward low pressure
which is outward and away from high pressure. In the analogy a
ball placed on the side of a hill will roll downhill and away from the
summit.
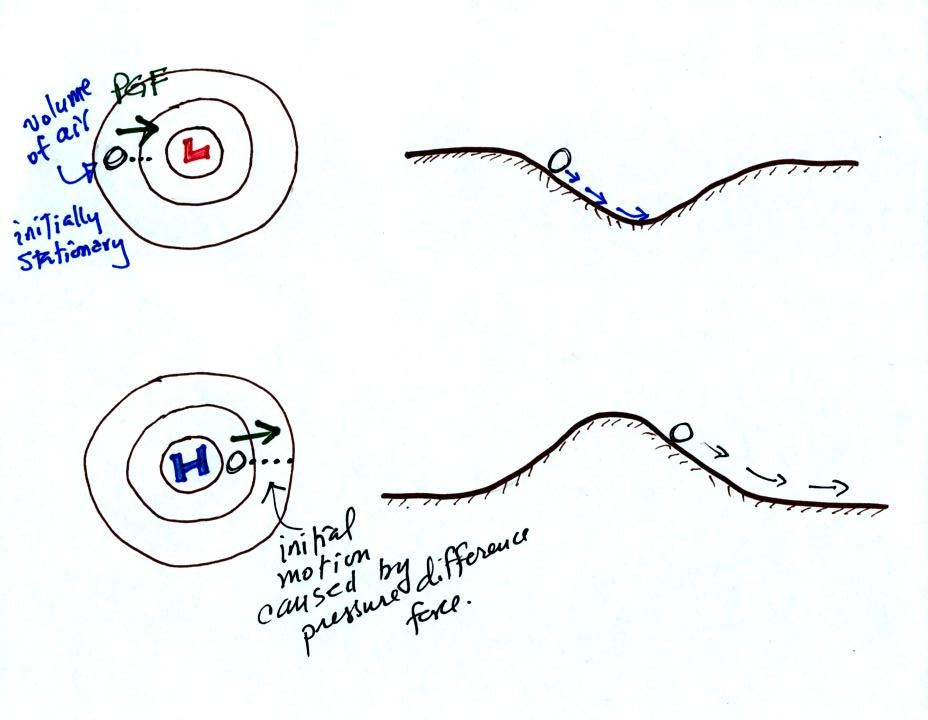
So given a pressure pattern you should be able to determine
the
direction of initial motion. The initial motion will always be in
the direction of low pressure.


