Thursday Nov. 8, 2007
Please check to see if your name is on this
list, this list, or this list
The Quiz #4 Study Guide has made an
early appearance on the class web page. The study guide isn't
complete, material will be added once it is covered in class.
We covered
the pressure gradient force last Tuesday but didn't have time to give
the Coriolis force (CF) the full attention it deserves. It is
confusing, don't worry too much if you don't understand what causes
it. You'll learn some simple rules that will allow you to
determine the direction and strength of the CF.
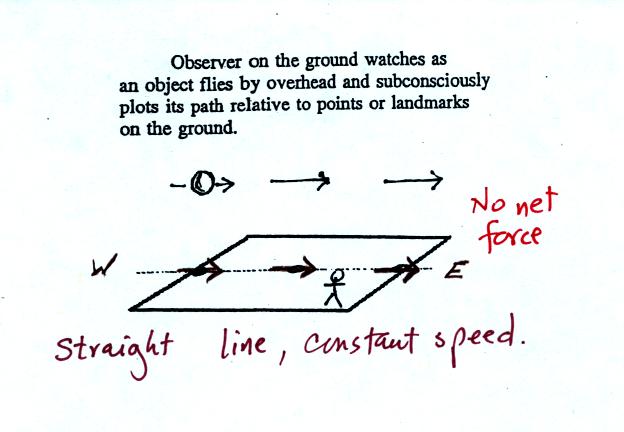
You'll find the figure above on p. 122c in the photocopied
Class
Notes. Imagine an object of some kind flies over
Tucson. It
travels
straight from west to east at constant speed. The next figure
shows the path that
the object followed relative to the ground as it passed over the city.
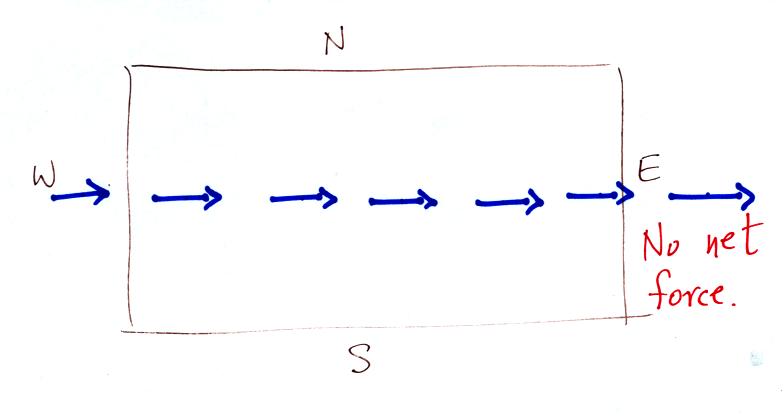
The moving object appeared to be
moving in a
straight line at constant speed. You would conclude that there
was zero net force acting on the object.
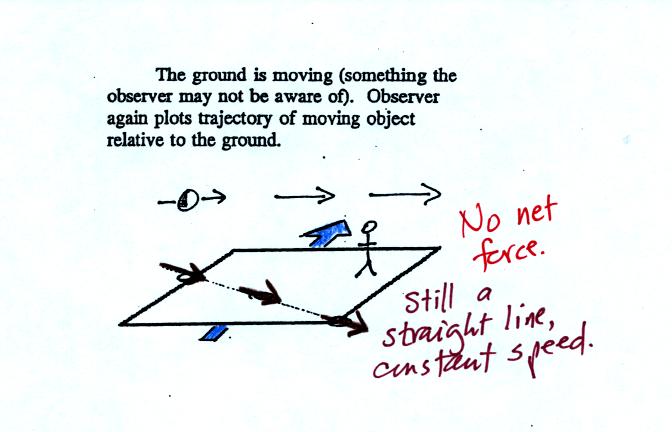
In this second picture the object flies by overhead
just as it
did in the previous picture. In this picture, however, the ground
is moving (don't worry about what might be causing the ground to move).
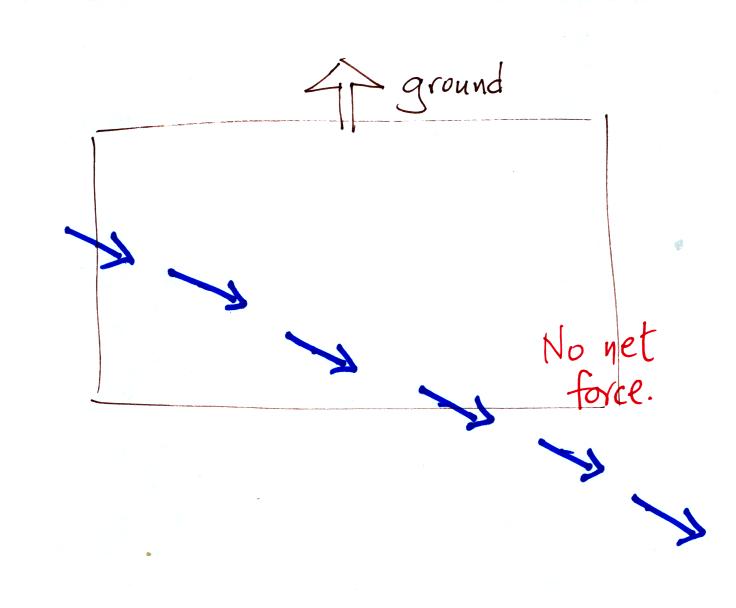
This is the path that you would see relative to the ground
in this
case. Even though the object flew from west to east it
appears to have been traveling from the NW toward the SE because the
ground was moving as the object passed overhead. Because
the motion is still in a straight line at constant speed, you would
conclude the net force acting on the object was zero.
At most locations on the earth the ground is not just moving
but rotating or spinning. This is
most easily seen at the poles.
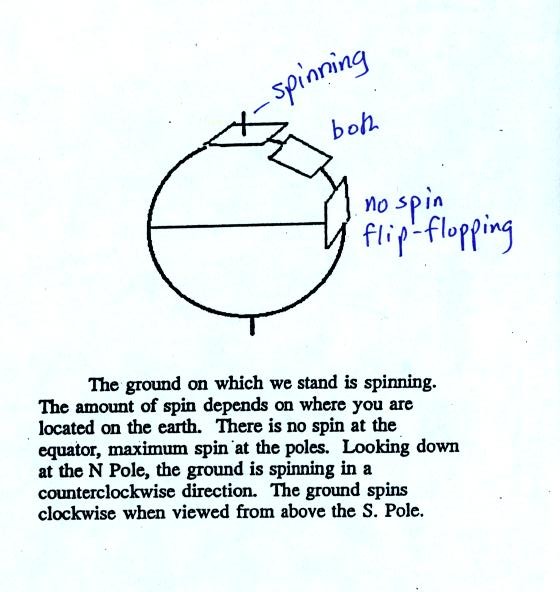
Imagine a piece of paper glued to the top of a globe.
As the
globe spins the piece of paper will rotate. A piece of paper
glued to the globe at the equator won't spin, it will flip over.
At points in between the paper would spin and flip, the motion gets
complicated.
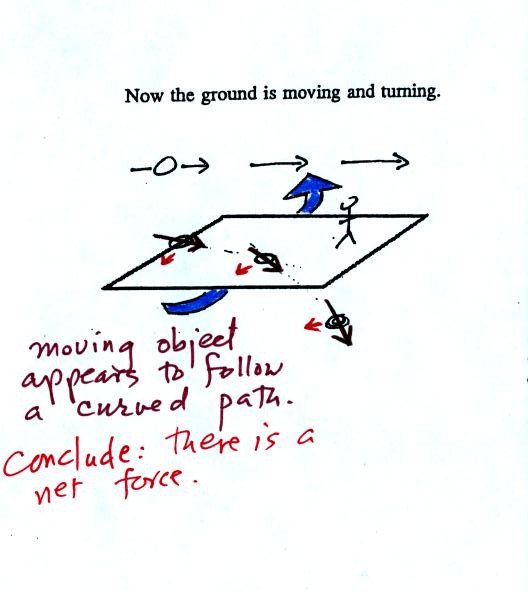
In this last figure the object flies by again from
west to
east. In this case however the ground is rotating. The path
that the moving object would appear to follow relative to the ground is
shown below:
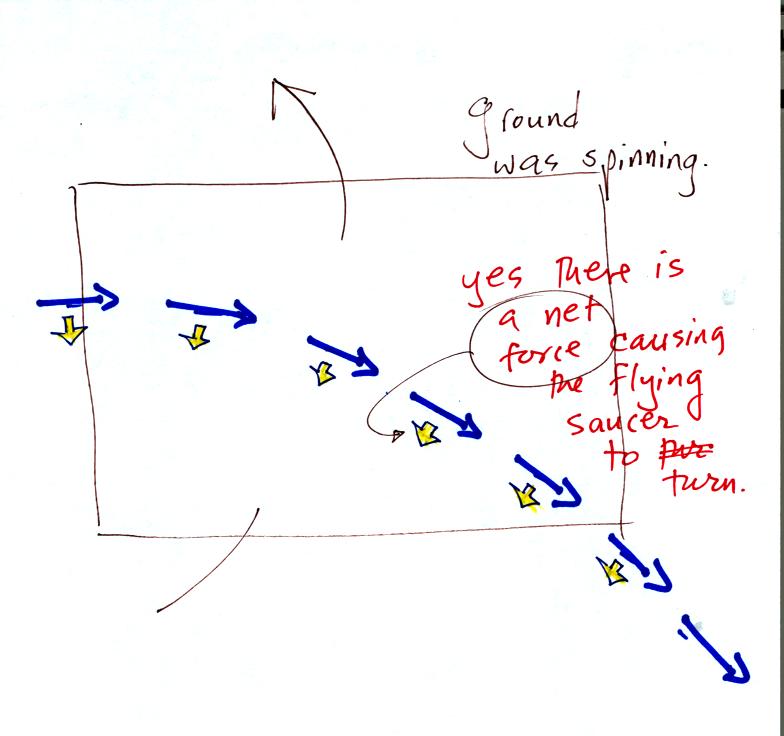
Now the object appears to have been turning to the
right as it
passed over Tucson. Because it is no longer traveling in a
straight line you would conclude there was a net force acting on the
object. The direction of this net force would be to the
right of the motion.
The easiest thing for us to do is to ignore the fact that the ground on
which we are standing is rotating (it's not something we are really
aware of anyway). However, if we do that we need
to account for the curved paths that moving objects will take when they
move relative to the earth's surface. That is what the Coriolis
force does.
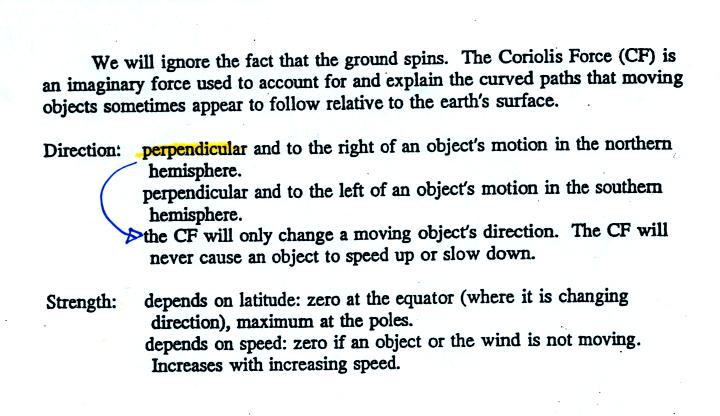
Here are some rules that you can use to determine the
direction and
strength of the Coriolis force (whether you understand what causes it
or not). It always points in a direction
that is perpendicular to the wind, it can't cause the wind to speed up
or slow down, it will only change the wind's direction.
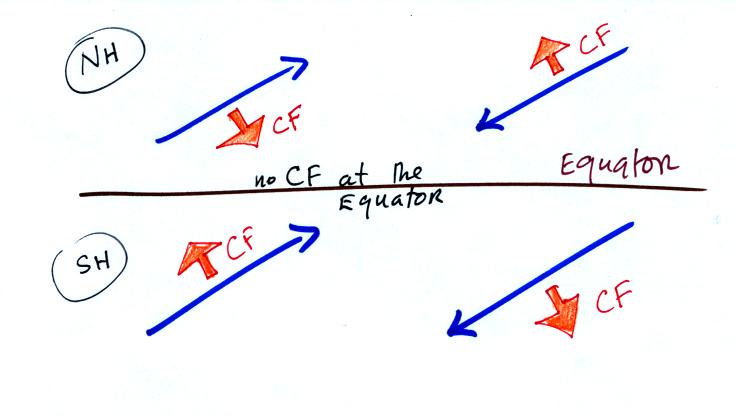
Here are some examples of winds in the northern and southern
hemispheres (NH and SH in the figure). The red arrows show the
direction of the CF. The CF is to the right of the wind (you
need to look in the direction the wind is blowing, you need to look
downstream) in the northern hemisphere and to the left of the wind in
the southern hemisphere.
Now we are
ready to work through several examples showing how the PGF and CF
determine
how upper level winds blow. First a couple of things that we will
use over and over again.
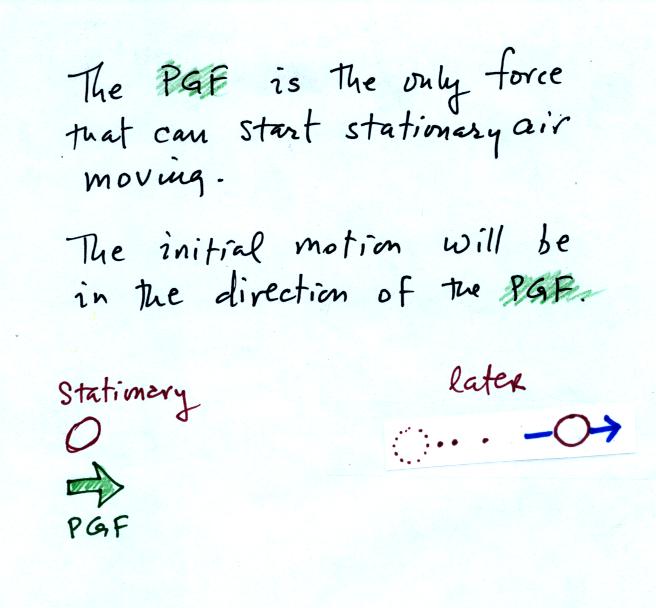
The strength of the Coriolis force and the Frictional force both
depend on wind speed. If the wind is blowing there isn't any
Coriolis or Frictional force. Thus the PGF is the only force that
can cause stationary air to start to move.
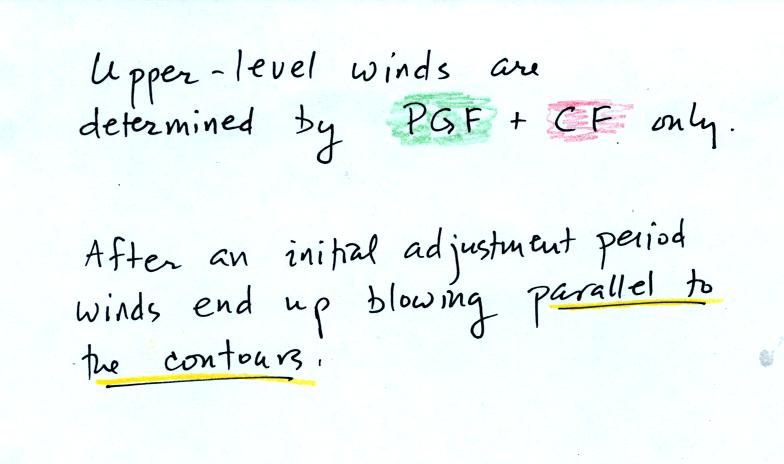
We will start with upper level winds because they involve only the
PGF and the CF. For surface winds you must include the frictional
force.
We'll start with a simple upper level contour pattern,
straight
parallel contour lines. The figure below is found at the top of
p. 123 in the photocopied Classnotes.
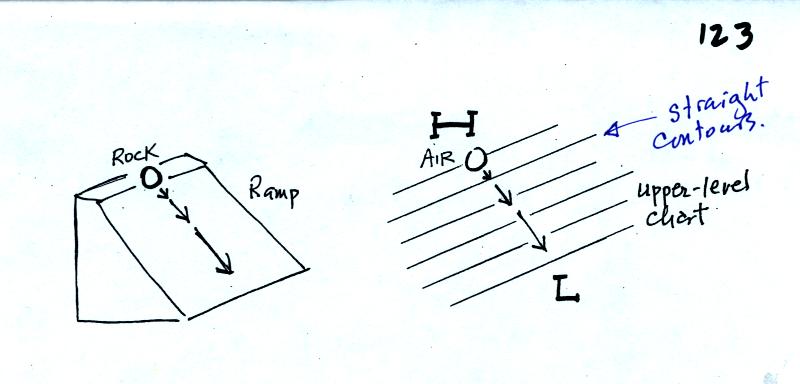
Placing a parcel of air in the pressure pattern below is
analogous
to placing a rock on a ramp. The rock will begin to roll
downhill, the
air will begin to move toward low pressure (or low height on a constant
pressure chart). The wind will pick up speed as it goes.
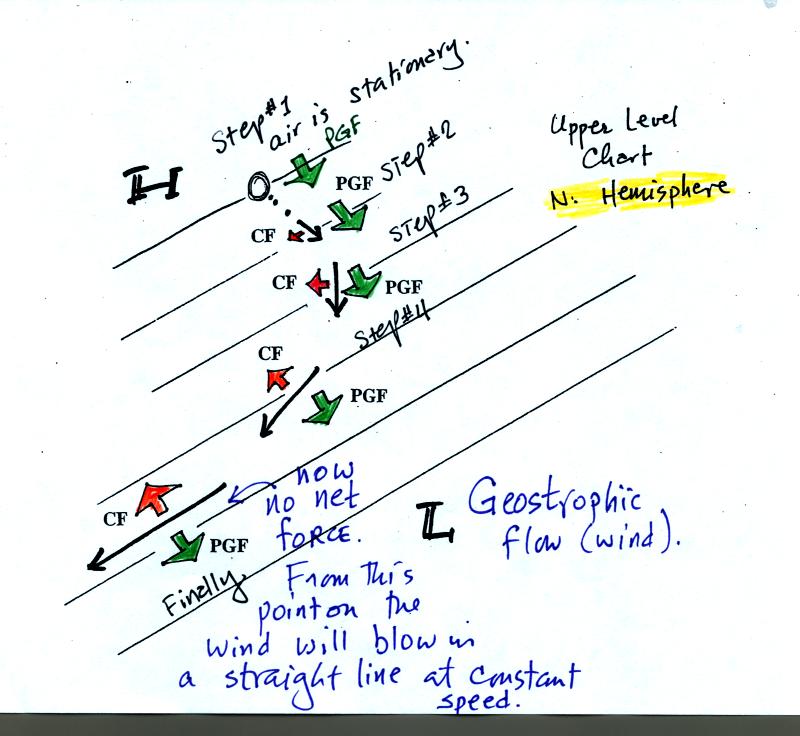
On the upper level chart above, we
start with a
stationary volume of air at Point 1. The PGF (perpendicular to
the
contour lines and pointing toward low) will start the air moving toward
low pressure. The dots show this initial motion.
At Point 2 the air is moving and the Coriolis force appears. It
is perpendicular and to the right of the
wind (this is a northern hemisphere map). It is
weak because the wind speed is low. The CF begins to bend the
wind (it is bending to the right if you look in the direction the wind
is blowing).
The wind picks up speed and, in Points 3 and 4, the CF is getting
stronger
and the wind is continuing to bend.
At Point 5, the wind is blowing parallel to the contours, and the wind
speed is high enough that the CF is able to
balance the PGF. The net force is now zero. From this point
on the
winds will blow in a straight line at constant speed parallel to the
contour lines. This is known as a geostropic wind or geostrophic
flow.
Some more
examples and some questions from p. 124 in the photocopied Class Notes.
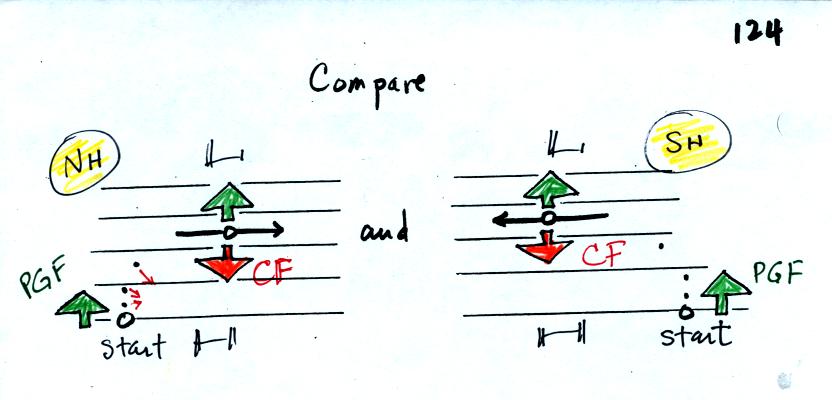
The
PGF force
starts the stationary air (at the starting position) moving (the dots
show the direction of this
initial motion). Low pressure would be found at the top
of both maps in this figure. Then if we watch the motion
carefully we see the
air
beginning to turn to the right in the left figure and
turning to the left in the right hand figure. This is caused by
the
Coriolis force. The CF is to the right of the wind in the left
figure, this is a northern hemisphere (NH) chart. The CF is to
the left of the wind in the right figure, this is a southern hemisphere
(SH) chart.
The CF and PGF again balance by the time you get to point where the
winds are blowing parallel to the contour lines.
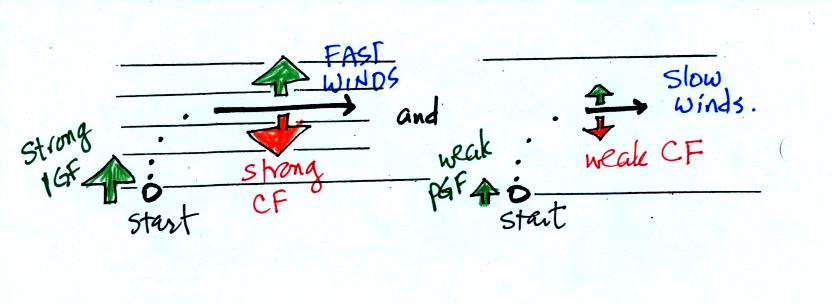
The two figures above (middle of p. 124) show maps
with strong and weak pressure
gradients. The wind in the left figure ends up blowing much
faster
than the wind in the right figure (much as a rock would roll quickly
down a steep ramp and slowly down a more gradual slope). The fast
wind
in the left figure produces a strong Coriolis force that is eventually
able to balance
the strong PGF. The slow winds at right produce a weaker
CF. The CF is to the right of the wind in both examples, so these
are both in the northern hemisphere.
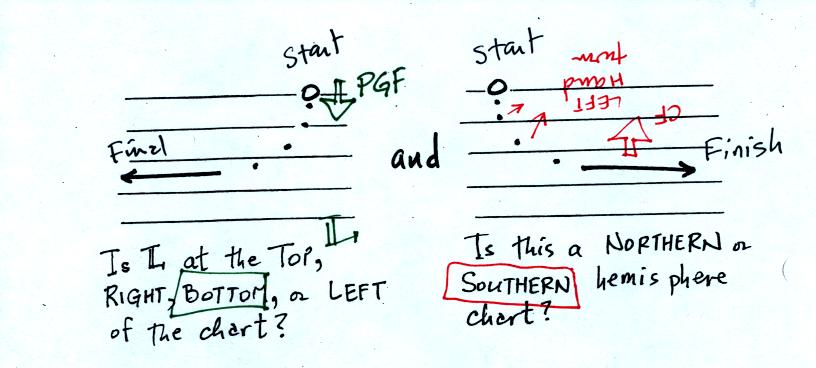
In the left figure the direction of the initial motion (the
dots) is toward the bottom of the figure. The initial motion is
caused
by the PGF. The PGF points toward low pressure at the bottom of
the
chart.
In the right figure the wind takes a left turn once it
begins
to blow (turn the page upside down so you are looking in the direction
the wind is
blowing). That identifies this as a southern hemisphere chart.
Now we'll
look at upper level circular centers of low and high pressure.
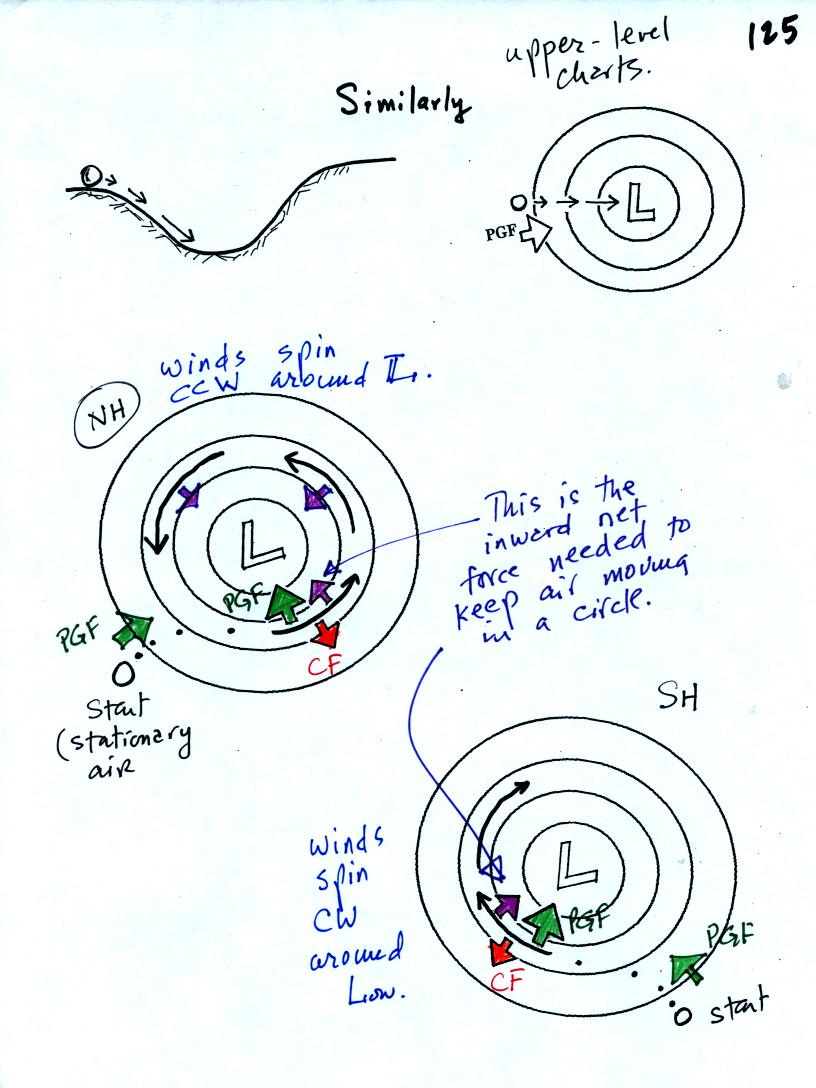
Just like a rock rolling downhill toward the center of a
depression, air will begin to move inward toward a center of low
pressure
The dots tell you the direction of the
initial motion. They tell you the direction of the PGF, inward
toward low pressure in both these figures.
In the middle figure
the wind takes a right turn (identifying this as a northern hemisphere
chart) and eventually ends up blowing parallel to the contour lines in
a counterclockwise direction.
In the bottom figure the wind turns to the left and ends up blowing
parallel to the contour lines in a clockwise direction. The CF
points to the left of the wind in this figure, this is a southern
hemisphere chart.
Note in both charts that the PGF and the CF point in
opposite directions but they are no longer equal in strength. The
inward pointing PGF is stronger than the outward CF. The
difference
provides the net inward force (the purple arrow) needed to keep the
wind blowing in a
circular path.
Because of the Coriolis force, winds blow counterclockwise around low
pressure in the NH and clockwise around low in the SH.
Here's
what happens with upper level high pressure centers.
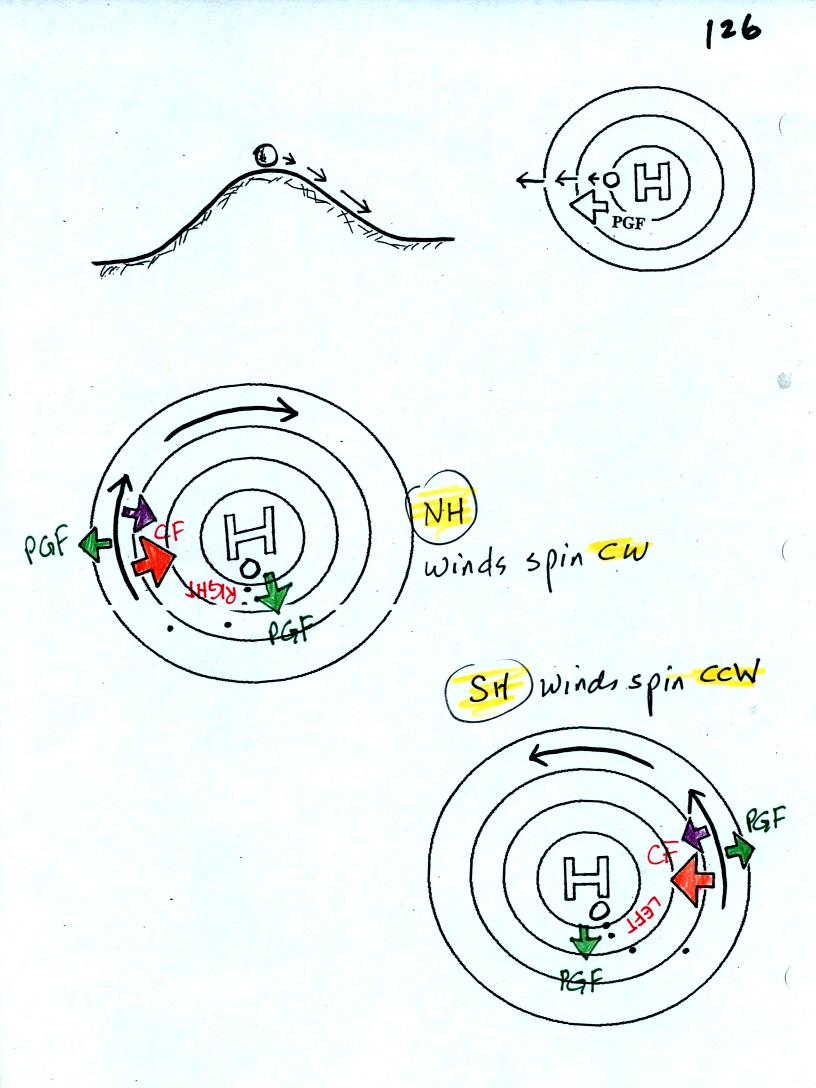
The initially stationary
air begins to move outward and away from the high pressure in the
center (the dots show this initial motion).
In the middle figure the CF is to the right of the wind. This is
a northern hemisphere map. Winds blow parallel to the contours
and spin clockwise around high in the northern hemisphere.
The winds blow parallel to the contours and in a counterclockwise
direction around circular centers of high pressure in the southern
hemisphere.
Note the net force is inward in both cases.
Now before
you get the idea that all winds change directions in the NH and SH
we'll look at the next figure.
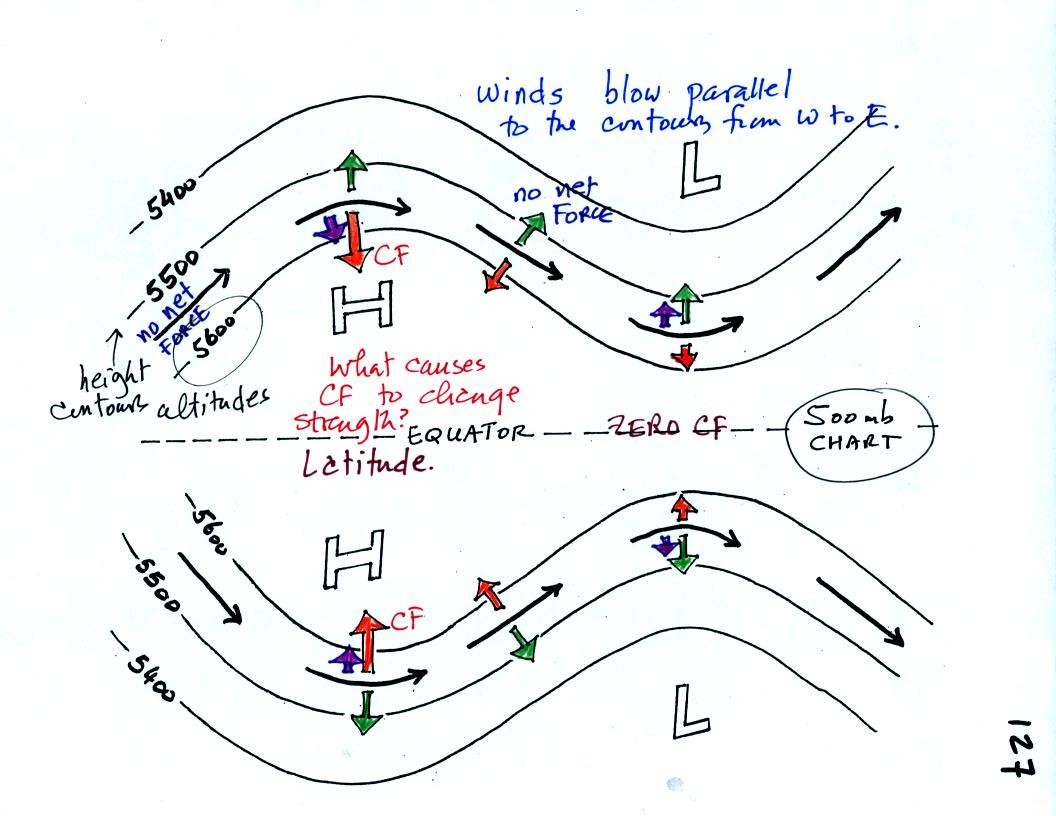
The winds are blowing from west to east in both hemispheres
even though
the CF changes directions in the NH and SH. How is this
possible. If you look closely you will notice that the pressure
pattern is also "flipped." Low pressure is found at the top of
the map in the NH and at the bottom of the chart in the SH. The
direction of the CF changes directions in the NH and SH hemisphere, the
PGF also charnges directions and the winds blow in the same direction.
The spacing of the contour lines and the strength of the PGF stays
about constant on this chart. If you look closely at the figure
you will notice that the CF force is
sometimes stronger and sometimes weaker than
the PGF. This changing imbalance results in a net force needed
for the right and left
turns that the winds take as they blow through this pattern. If
you remember that the strength of the CF depends on latitude (as well
as wind speed) you can understand why the CF changes strength.
The CF is strongest when the winds are far from the equator, weakest
when the winds are close to the equator (the CF is zero at the equator).
Now we will have a brief look at
surface winds. Upper level winds are determined by the pressure
gradient force and the Coriolis force.
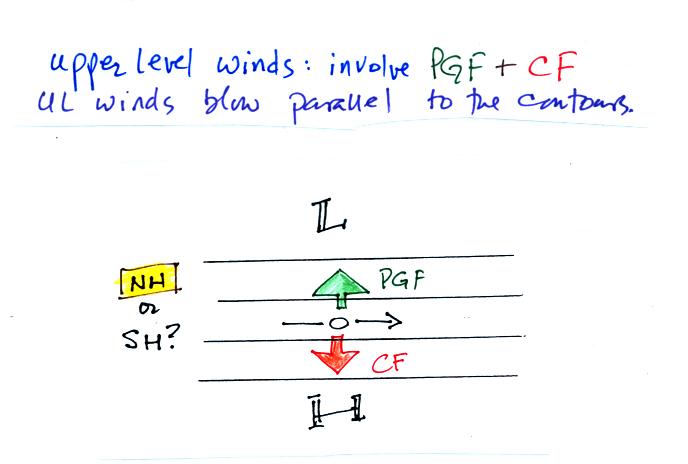
In the figure above, we drew in the
pressure gradient force arrow (perpendicular to the contour lines and
pointing toward low pressure). Then we can drew in an equal and
oppositely directed CF so that the net force would be zero. We
then saw that the CF was to the right of the wind and we could then say
this was a N. hemisphere chart.
For surface winds, you must add the frictional force to the mix.
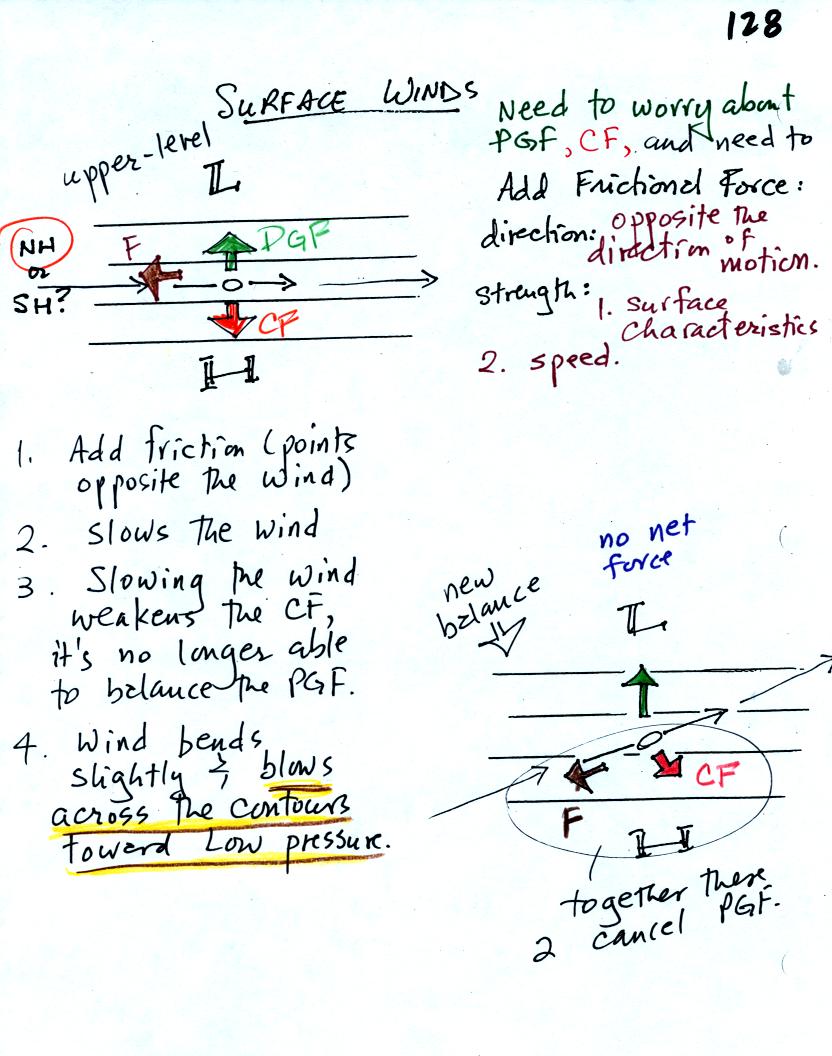
The frictional force will always point in a direction
opposite the
wind. Friction always try to slow moving objects (it doesn't
cause you
to speed up on your bicycle or to veer suddenly to the right or
left).
The strength of the frictional force depends on wind speed (stronger
when the winds are fast and zero when the wind isn't blowing at
all).
Friction also depends on the type of surface the wind is blowing over
(there is less friction when winds blow over the ocean than when
blowing over land).
Note in the figure above that adding friction slows the wind.
This in turn weakens the Coriolis force and the CF no longer balances
the PGF. The PGF turns the wind slightly toward low pressure, the
winds blow across the contours toward low pressure. You
eventually end up with a new balance: CF together with F are able to
balance the PGF and the net force becomes zero.

This figure summarizes most everything we have done. The
upper level
winds are shown in the figure at left. The upper level winds blow
parallel to the contour lines.
At right surface winds around centers of high and low pressure are
shown. You should remember from early in the semester that winds
blow counterclockwise and inward around low pressure in the NH.
They blow clockwise and outward around high pressure.
In the southern hemisphere the directions of spin change (clockwise
around low and counterclockwise around high). Winds still blow
converge into low pressure and diverge from centers of high
pressure. This means that rising air (which expands and cools)
and clouds will be found with centers of low pressure in both the
northern and southern hemispheres.
Note the locations and directions of motion of the southern hemisphere
warm and cold fronts. The winds spin clockwise around low
pressure in the southern hemisphere. The coldest air is found in
the south in the southern hemisphere.


