Thursday Aug. 28, 2008
click here to download these notes in more printer friendly Microsoft WORD format

Today is the 45th anniversary of Martin Luther King's "I Have a Dream" speech.  To commemorate that event, a couple of songs by Patty Griffin, "Up to the Mountain MLK Song" and "Heavenly Day", were played before class today.

Signup sheets for the experiment reports were circulated in class today.  If you didn't sign up today you can do so in class next week.  The materials for Expt. #1 will be distributed in class next Tuesday.

For the next few days you can go to the National Hurricane Center website and track the progress of Tropical Storm/Hurricane Gustav as it moves into the Gulf of Mexico and heads for the Gulf Coast.  A second storm, Hanna, might pose a threat to Florida or the East Coast of the US.  You'll find satellite photographs of these storms here.

We reviewed a small bit of new information, not covered in class, that was stuck on to the end of the Tuesday Aug. 26 class notes. 

We then returned to the topic of the origin of oxygen and its buildup in the atmosphere at the beginning of today's class.  This is summarized on p. 1 in the photocopied ClassNotes. 


This somewhat confusing figure shows some of the important events in the history of the earth and evolution of the atmosphere.  The numbered points were emphasized.
First, Point 1, the earth is thought to be between  4.5 and  4.6 billion years old.
The iron catastrophe was an important event (but wasn't discussed in class).  Circulation of liquid metal in the core of the earth gives the earth a magnetic field.  The magnetic field deflects the solar wind around the earth.  Remember the solar wind may have swept away the earth's original atmosphere.

Stromatolites (Points 2 and 3) are column-shaped structures made up of layers of sedimentary rock.  They are created by microorganisms living at the top of the stromatolite (note I've never actually seen a stromatolite, so this is all based on photographs and written descriptions).  Fossils of the very small microbes (cyanobacteria) have been found in stromatolites as old as 2.7 B years and are some of the earliest records of life on the earth.  Much older (3.5 to 3.8 B years old) stromatolites presumably produced by microbes but without microbe fossils have also been found. 


We're learning about stromatolites because the cyanobacteria were able to produce oxygen using photosynthesis.


Living stromatolites are found in a few locations today.  The picture above is from Coral Bay Australia, located on the western tip of the continent.


Once cyanobacteria began to produce oxygen in ocean water, the oxygen reacted with dissolved iron (iron ions in the figure below) to form hematite or magnetite.  These two minerals precipitated out of the water to form a layer on the sea bed.

Periodically the oxygen production would decrease or stop (rising oxygen levels might have killed the cyanobacteria or seasonal changes might have slowed the photosynthesis).  During these times of low oxygen concentration, layers of jasper would form on the ocean bottom.  Eventually the cyanobacteria would recover, begin producing oxygen again, and a new layer of hematite or magnetite would form.  The rocks that resulted, containing alternating layers of black hematite or magnetite and red layers of jasper are known as the banded iron formation.  A couple of small polished pieces of banded iron rock (actually "tiger iron")  were passed around class.   In addition to the red and black layers, the tiger iron contains yellow layers made of fibers of quartz.  Thanks for returning them safely to me.


Eventually the dissolved iron in the ocean was used up (Point 4 in the timeline figure above).  Oxygen produced by cyanobacteria diffused out of the ocean into the atmosphere.  Once in the air, the oxygen could react with iron in sediments on the earth's surface.  This produced red colored sedimentary rock.  None of these socalled red beds are older than about 2 B years old.  Thus it appears that a real buildup up of oxygen in the atmosphere began around 2 B years ago. Oxygen concentrations reached levels that are about the same as today around 500 to 600 years ago (Point 5 in the figure).


We listed the 5 most abundant gases in the atmosphere in class on Tuesday.  Several more important trace gases were added to the list in class today.  Trace gases are gases found in low concentrations.  Low concentrations doesn't mean they aren't important, very low concentrations of some of the gases below are enough to kill you.  The figure below may be a little different from the one shown in class, it was redrawn for improved clarity.


Water vapor, carbon dioxide, methane, nitrous oxide (N2O = laughing gas), chlorofluorocarbons, and ozone are all greenhouse gases.  Increasing atmospheric concentrations of these gases are responsible for the current concern over climate change and global warming.  We should begin discussing this topic late next week and learn more about how the greenhouse effect actually works later in the course.

Carbon monoxide, nitric oxide, nitrogen dioxide, ozone, and sulfur dioxide are some of the major air pollutants.  We learned a little bit about carbon monoxide today.  We'll cover sulfur dioxide and ozone next week.

Be careful with ozone, it has a "Dr. Jekyll and Mr. Hyde" personality:
(i)  Ozone in the stratosphere (a layer of the atmosphere between 10 and 50 km altitude) is beneficial because it absorbs dangerous high energy ultraviolet (UV) light coming from the sun.  Without the protection of the ozone layer, life as we know it would not exist on the surface of the earth.  Chlorofluorocarbons are of concern in the atmosphere because they destroy stratospheric ozone.
(ii)  In the troposphere (the bottom 10 kilometers or so of the atmosphere) ozone is a pollutant and is one of the main ingredients in photochemical smog.


We have been discussing the composition of air.  Air is mostly composed of invisible gases.  This past summer I thought it might be interesting to bring in several examples of gases that you can actually see (the gases are colored, not clear; you can't of course see the individual gas atoms or molecules).  Once I started to do some research I found that many of these gases are very poisonous.  In some cases a sample large enough for you to be able to see would be a potentially fatal dose if it were to be released accidentally into the classroom.  You're going to have to settle for pictures of chlorine (a gas with a yellow-green color), and bromine (a liquid that evaporates, the resulting gas has a very vivid reddish color).  The caution on the www.webelements.com website: "Bromine is a serious health hazard and maximum safety precautions should be taken when handling it" worried me a little bit.  I will bring in some iodine (a solid that sublimates producing a gas with a faint pink color) later in the semester (it's poisonous but not nearly as scary as bromine).

We did however make some nitrogen dioxide, a toxic pollutant.  Nitrogen dioxide has a brownish color.  We did this by putting an ordinary copper penny (Cu(s) in the equation below) into a large thick walled 4 liter glass flask that contained a small amount of concentrated nitric acid ( HNO3(aq) ).


Air Pollution is a serious health hazard in the US and around the world.  The following statistics were shown briefly at the end of class.  A few additional details were added after class.   Click here to download a copy of this handout (which was not distributed in class).


Keep in mind that many of these numbers are difficult to determine and some may contain a great deal of uncertainty.  The row that is highlighted, toxic agents, contains estimates of deaths caused by indoor and outdoor air pollution, water pollution, and exposure to materials such as asbestos and lead both in the home and at the work place.  It is estimated that 60% of these deaths are due to exposure to particulate matter, something that we will examine in a little more detail next week.


Air pollution is a serious hazard worldwide.  Interestingly indoor air pollution is, in many places, a more serious threat than outdoor air pollution.


I like lists.  The Blacksmith Institute has listed the Top 10 polluted places in the world in a 2007 report.  The report has received a lot of worldwide attention.  If you go to this address, you can view the report online or download and print a copy of the report.  Just in case you are interested.


We had enough time to get started on the first air pollutant we will be covering: carbon monoxide.  The basic information below is found on p. 7 in the photocopied ClassNotes. 
You'll find additional information at the Pima County Department of Environmental Quality website and also at the US Environmental Protection Agency website.  Just in case you are interested.


Carbon monoxide is insidious, you can't smell it or see it and it can kill you.  Once inhaled, carbon monoxide molecules bond strongly to the hemoglobin molecules in blood and interfere with the transport of oxygen throughout your body.

CO is a primary pollutant (Point 1 above).  That means it goes directly from a source into the air, 
CO is emitted directly from an automobile tailpipe into the atmosphere for example. The difference between primary and secondary pollutants is probably explained best in a series of pictures.


Nitric oxide, NO, and sulfur dioxide, SO2, are also primary pollutants.  Ozone is a secondary pollutant.  It shows up in the atmosphere only after a primary pollutant has undergone a series of reactions.

Point 2 explains that CO is produced by incomplete combustion of fossil fuel (insufficient oxygen).  Complete combustion would produce carbon dioxide, CO2.   Cars and trucks produce much of the CO in the atmosphere.  Vehicles must now be fitted with a catalytic converter that will change CO into CO2 (and also NO into N2 and O2).  In Pima County vehicles must also pass an emissions test every year and special formulations of gasoline (oxygenated fuels) are used during the winter months to try to reduce CO emissions. 

In the atmosphere CO concentrations peak on winter mornings (Point 3).  Surface temperature inversion layers form on long winter nights when the sky is clear and winds are calm.  The ground cools quickly and becomes colder than the air above.  Air in contact with the cold ground ends up colder than air above.  Air temperature increases with increasing altitude in a temperature inversion layer and this produces a very stable layer of air at ground level.  A very reasonable wintertime morning temperature profile in Tucson is shown at the top of p. 9 in the photocopied Classnotes.  This figure wasn't shown in class on Thursday.


Temperature increases from 47o F at the ground (Point A) to about 60o F at 1000 feet altitude (Point B), that's the stable inversion layer.  Temperature begins to decrease with increasing altitude above Point B.

There is very little vertical mixing in a stable air layer. 


When CO is emitted into the thin stable layer (left figure above), the CO remains in the layer and doesn't mix with cleaner air above.  CO concentrations build.

In the afternoon, the ground warms, and the atmosphere becomes more unstable.  CO emitted into air at the surface mixes with cleaner air above.  The CO concentrations are effectively diluted.


Thunderstorms contain strong up (updraft) and down (downdraft) air motions.  Thunderstorms are a sure indication of unstable atmospheric conditions.  When the downdraft winds hit the ground they spread out horizontally.  These surface winds can sometimes reach 100 MPH, stronger than many tornadoes.  An unusually strong and narrow thunderstorm downdraft is called a microburst.


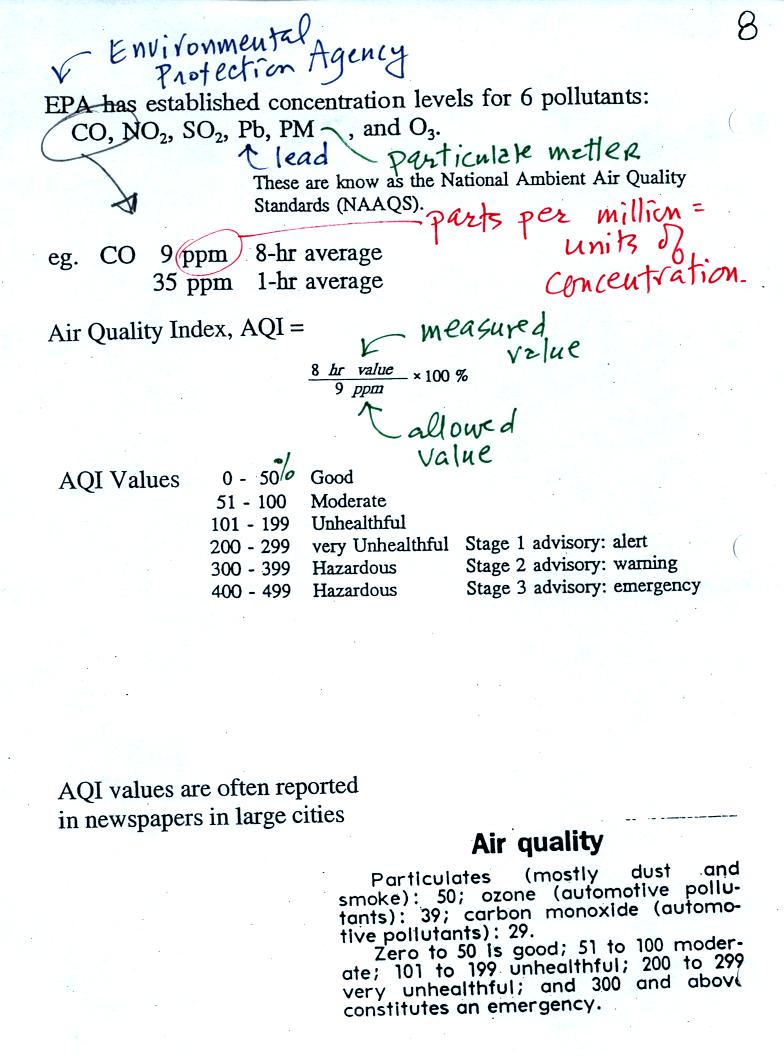
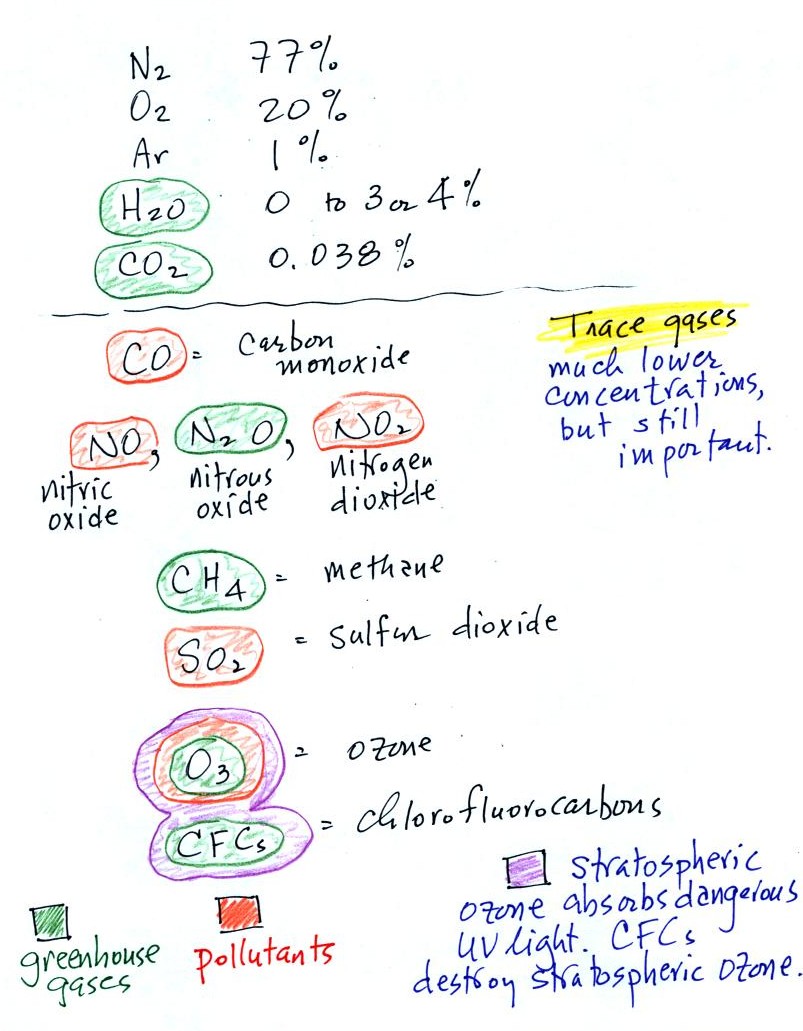
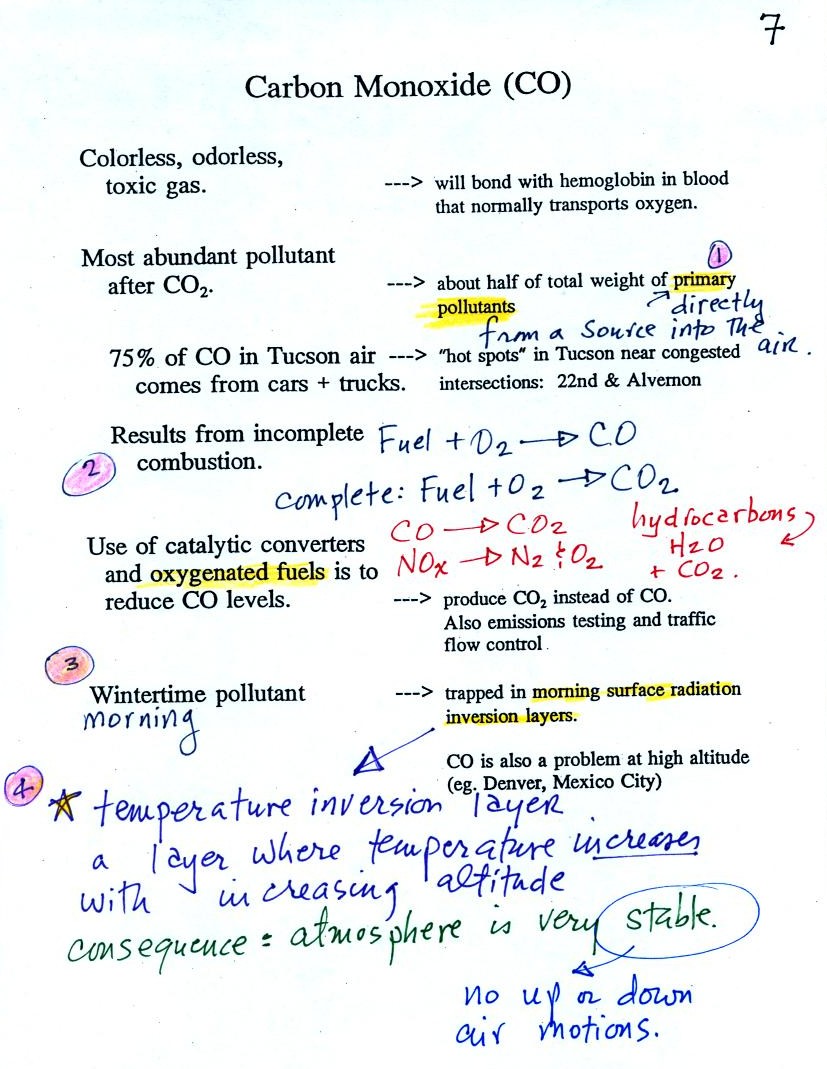
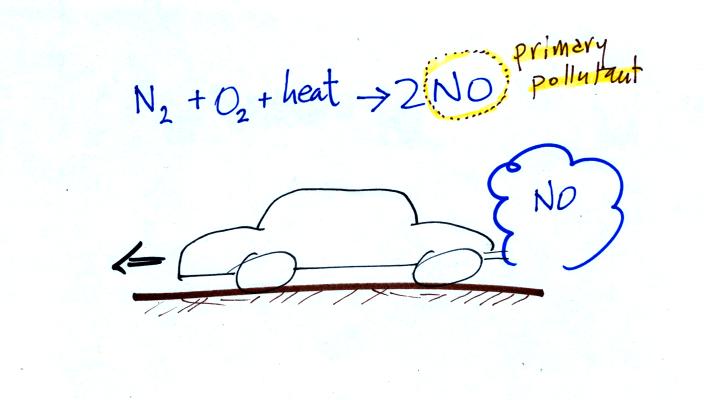
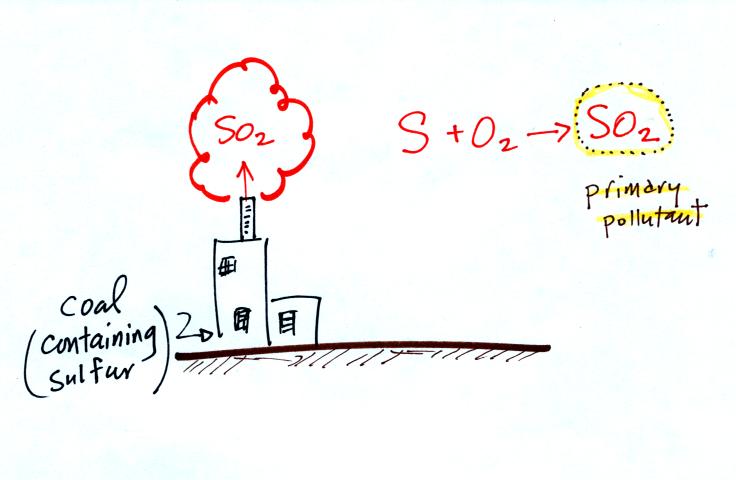
Six main air pollutants are listed at the top of this page.
  Concentrations of some or all of these pollutants are monitored daily in many cities.  The atmospheric concentration of lead has decreased significantly since the introduction of unleaded gasoline.  PM stands for particulate matter.  These small particles are invisible, remain suspended in the air, and may be made of harmful materials.

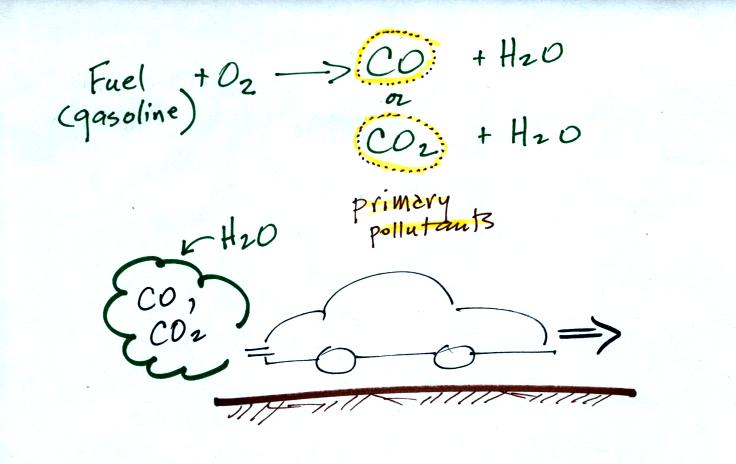
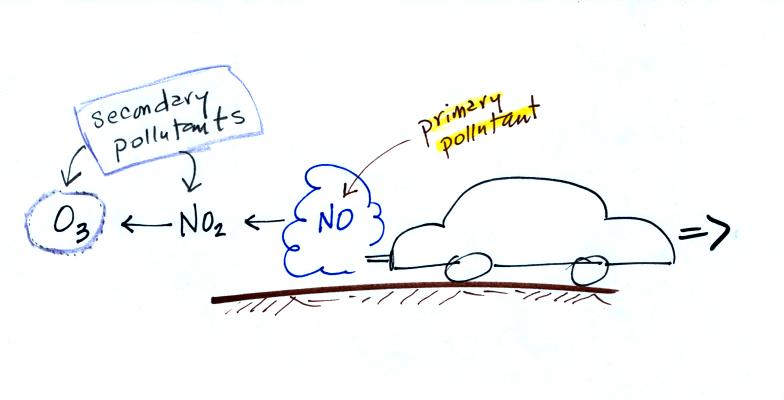
CO, O3 and particulate matter are the pollutants of most concern in Tucson and pollutant concentrations are reported in the newspaper or on television using the Air Quality Index (formerly the pollutant standards index).  This is basically the measured value divided by the allowed value multiplied by 100%.  For carbon monoxide concentrations up to 35 ppm (parts per million) for a 1 hour period and 9 ppm for an 8 hour period are allowed.   Current Air Quality Index values for Tucson are available online.

Yearly changes in the AQI values for ozone and carbon monoxide measured in Tucson in 1993 are plotted at the bottom of p.9 in the photocopied Classnotes.  This figure wasn't shown in class.

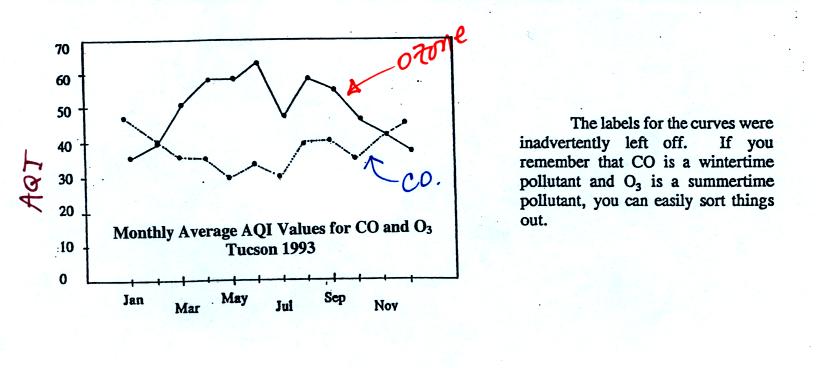
There are a couple of things to 
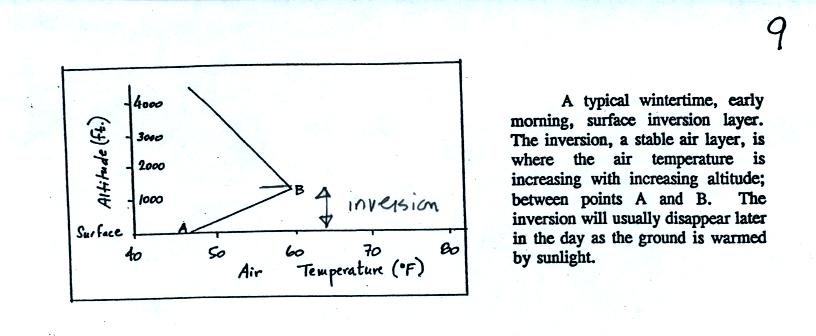
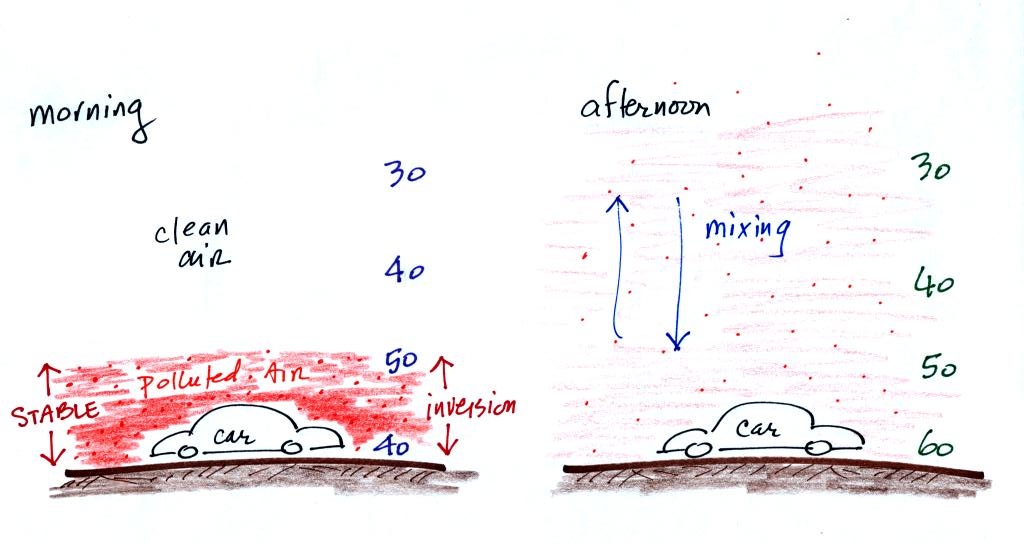
note in this figure.  First the highest AQI values for carbon monoxide are observed in the winter.  CO is a winter morning pollutant.  The highest ozone AQI values are observed in the summer.  Ozone, it turns out, is a summer afternoon pollutant (we'll learn why next week).  Also ozone AQI values almost reach 70 in the summer.  There are many people that think this is high enough to present a risk to people with existing lung disease.


So are we have been talking about carbon monoxide found in the atmosphere.  Carbon monoxide is also a serious hazard indoors where is can build to much higher levels than would ever be found outdoors.  You may remember having heard about an incident at the beginning of the school year in 2007.  Carbon monoxide from a malfunctioning hot water heater sickened 23 Virginia Tech students in an apartment complex.  The CO concentration is thought to have reached 400 ppm.  You can get an idea of what kinds of health effects concentrations this high could cause from the figure below (from p. 9 in the photocopied Classnotes).  This figure wasn't shown or discusses in class.

Follow the 400 ppm line (shaded orange) from left to right.  At exposure times less than 1 hour you should experience no symptoms.  Beginning at 1 hour you might experience headache, fatique, and dizziness.  Exposures of a few hours will produce throbbing headache, nausea, convulsions, and collapse.  The 400 ppm trace level approaches the level where CO would cause coma and death.  At Virginia Tech several students were found unconscious and one or two had stopped breathing.

Carbon monoxide alarms are relatively inexpensive and readily available at any hardware store.  They will monitor CO concentrations indoors and warn you when concentrations reach hazardous levels. Indoors CO is produced by gas furnaces and water heaters that are either operating improperly or aren't being adequately vented to the outdoors.  A few hundred people are killed indoors by carbon monoxide every year in the United States.  You can learn more about carbon monoxide hazards and risk prevention at the Consumer Product Safety Commission web page.


We'll wait until next Tuesday to discuss p. 10 in the photocopied ClassNotes.  It involves bicycling, one of my favorite topics.