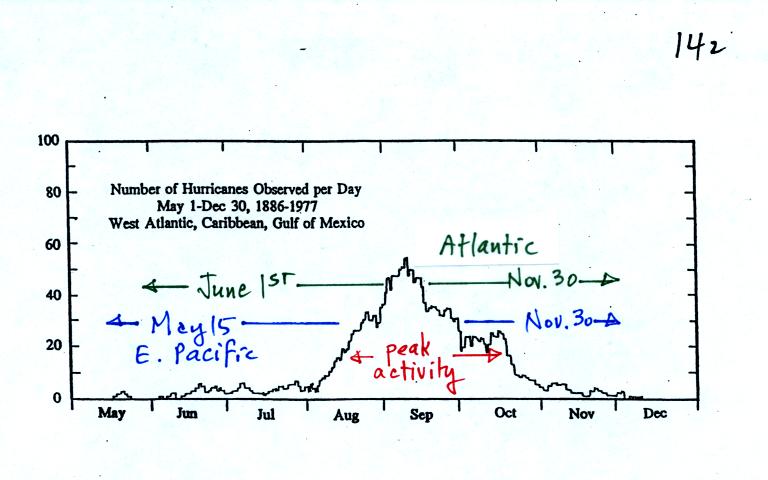
Hurricane season in the Atlantic
officially runs from
June 1 through to November 30. The peak of hurricane season is in
September. In 2005, an unusually active hurricane season in the
Atlantic, hurricanes continued through December and even into January
2006. Hurricane season in the Pacific begins two weeks earlier on
May 15 and
runs through Nov. 30.
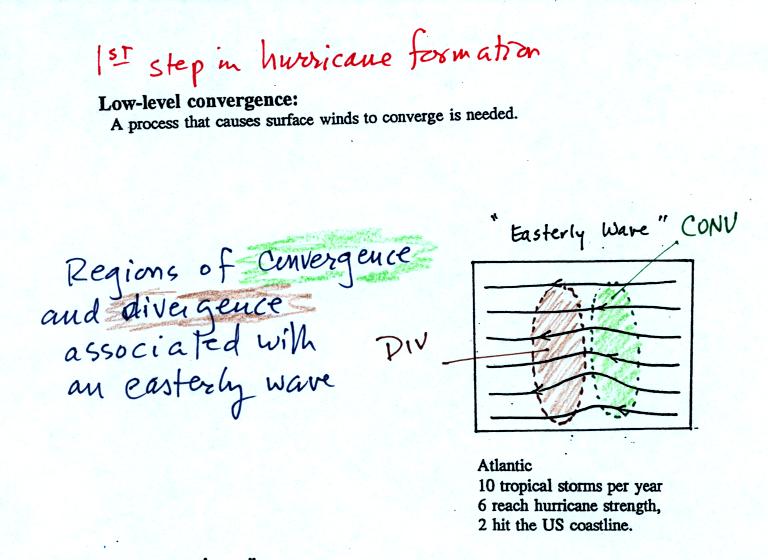
Some kind of meteorological process that produces low
level
convergence
is needed to initiate a hurricane. One possibility, and the one
that fuels most of the strong N. Atlantic hurricanes, is an "easterly
wave." This is just a "wiggle" in the wind flow pattern.
Easterly waves often form over Africa or just off the African coast and
then travel toward the west across the N. Atlantic. Winds
converge as they approach the wave and then diverge once
they are
past it . The convergence will cause air to rise and
thunderstorms
to begin to develop.
In an average year, in the N.
Atlantic, there will be 10 named
storms
(tropical storms or hurricanes) that develop during hurricane
season. 2005 was, if you remember, a very unusual
year. There
were 28 named storms in the N. Atlantic in 2005. That beat the
previous record of 21 names storms that had been set in 1933. Of
the 28 named storms, 15 developed into hurricanes.
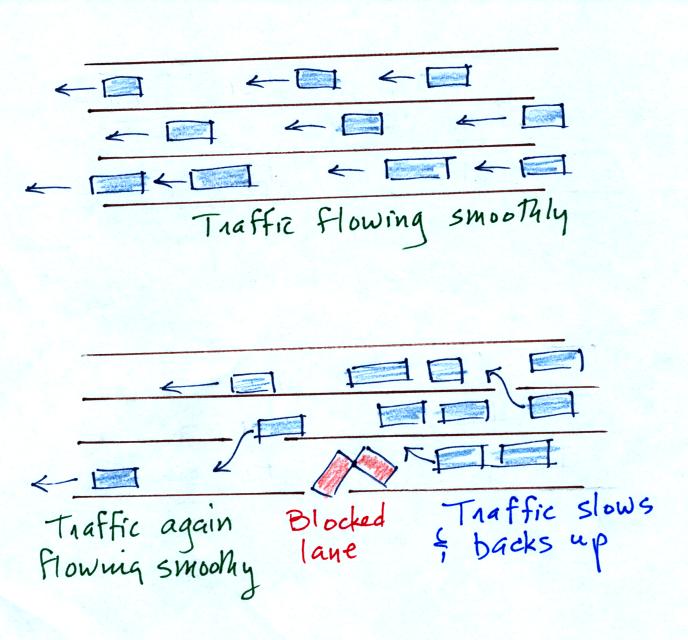
In some ways winds blowing through an easterly wave resembles
traffic
on a multi-lane highway. Traffic will back up as it approaches a
section of the highway with a closed lane. Once through the
"bottleneck" traffic will begin to flow more freely.
Another process that causes surface
winds to converge is a "lee side low."
Winds blowing over mountains on the
west coast of Mexico will
sometimes
form a surface low on the downwind side of the mountains. Surface
winds will spiral inward toward the center of the low. Note
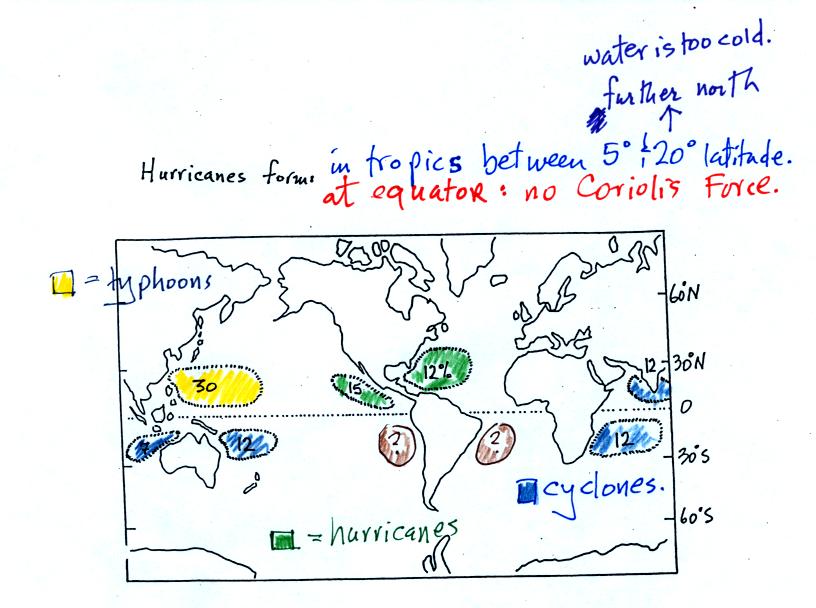
there are generally a few more tropical
storms and hurricanes in the E. Pacific than in the N. Atlantic.
They generally move away from the US coast, though the Hawaiian Islands
are sometimes affected.
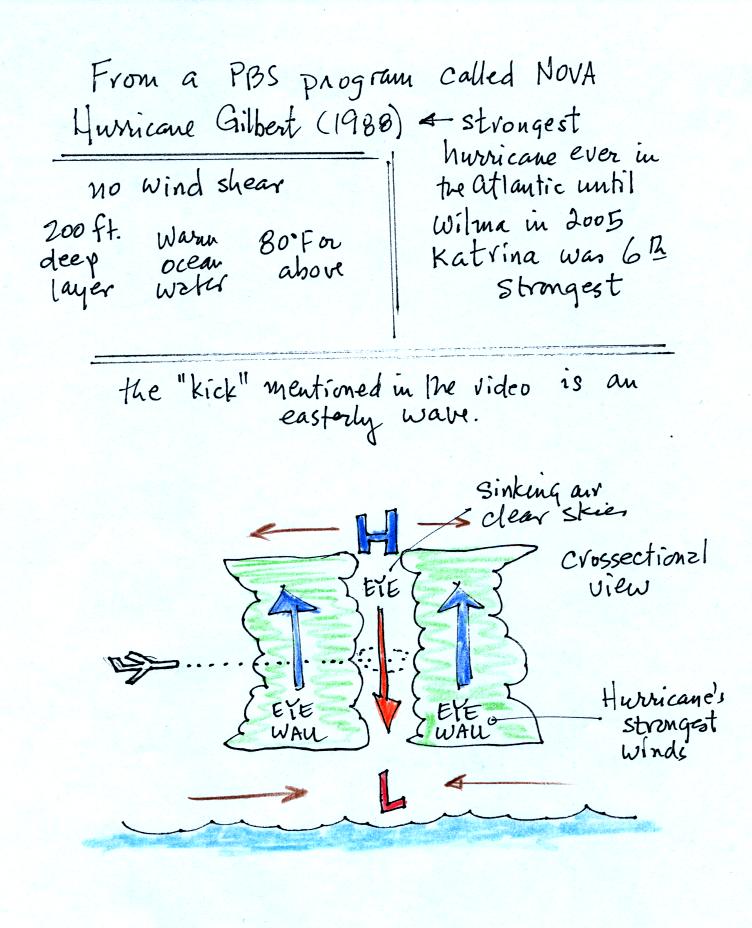
This figure tries to explain how a
cluster of thunderstorms can organize and intensify into a hurricane.
1. Converging surface winds pick
up heat and moisture from the ocean. These are the two mains
sources of energy for the hurricane.
2. Rising air cools and thunderstorm clouds form. The
release of latent heat during condensation warms the atmosphere.
The core of a hurricane is warm.
3. Pressure decreases more slowly with increasing altitude
in the warm core of the hurricane. The result is that pressure at
the top center of the hurricane is higher than the pressure at the top
edges of the hurricane (pressure at the top center is still lower than
the
pressure at the bottom center of the hurricane). Upper levels
winds diverge and spiral outward
from the top center of the hurricane.
4. The upper level divergence will cause the surface
pressure at the center of the hurricane to decrease. The speed of
the converging surface winds increases
and the storm intensifies. The converging winds pick up
additional heat and moisture which warms the core of the hurricane even
more. The upper level high pressure and the upper level
divergence increase. The increased divergence lowers the surface
pressure even more.
Here's another illustration of hurricane intensification ( not shown in class ).
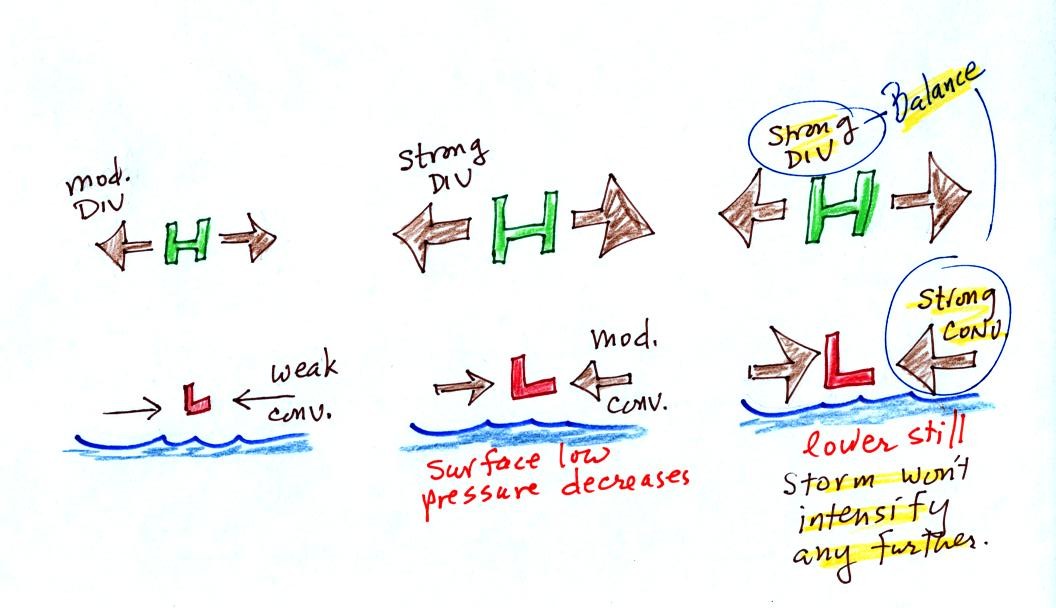
In the figure at left the upper level divergence is stronger
than the
surface convergence. The surface low pressure will
decrease. The decrease in surface pressure will cause the
converging surface winds to blow faster.
In the middle picture, the surface low pressure is lower, the surface
convergence is stronger. The upper level divergence has also been
strengthened a little bit. The upper level divergence is still
stronger than the surface convergence so the surface low pressure will
decrease even more.
In the right figure the surface low pressure has decreased enough that
the surface convergence now balances the upper level divergence.
The storm won't strengthen any more.
Generally speaking the lower the surface pressure at the center of a
hurricane the stronger the storm and the faster the surface winds will
blow.
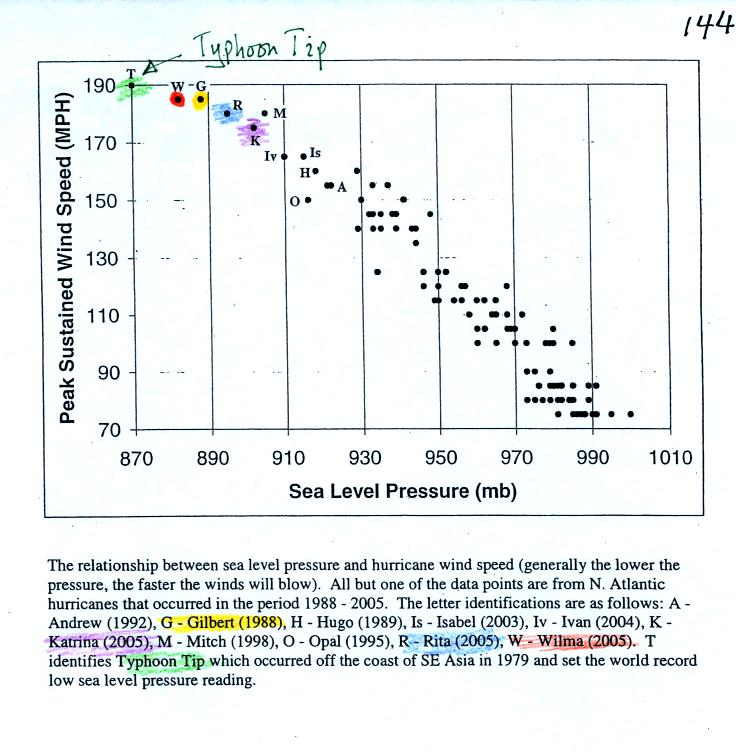
This figure tries to show the
relationship between surface
pressure and surface wind speed. The world record low
sea level pressure reading, 870 mb, was set
by Typooon Tip off the SE Asia coast in 1979. Sustained winds in
that storm were 190
MPH. Three 2005 Atlantic hurricanes: Wilma, Rita, and Katrina had
pressures in the 880 mb to 900 mb range and winds ranging from 170 to
190 MPH.
The stages of storm development that lead up to a hurricane
are shown
at the bottom of p. 143a in the photocopied ClassNotes.
A tropical disturbance is just a localized cluster of
thunderstorms
that a meterologist might see on a satellite photograph. But this
would merit observation because of the potential for further
development. Signs of rotation would be evidence of organization
and the developing storm would be called a tropical depression.
In order to be called a tropical storm the storm must
organize a little
more, and winds must
increase to 35 knots. The storm receives a name at this
point. Finally when winds exceed 75 MPH (easier to remember than
65 knots or 74 MPH) the storm becomes a hurricane.
That was
about all the new material we had time to cover in class because a
20
minute segment from a NOVA program (PBS network) on hurricanes was
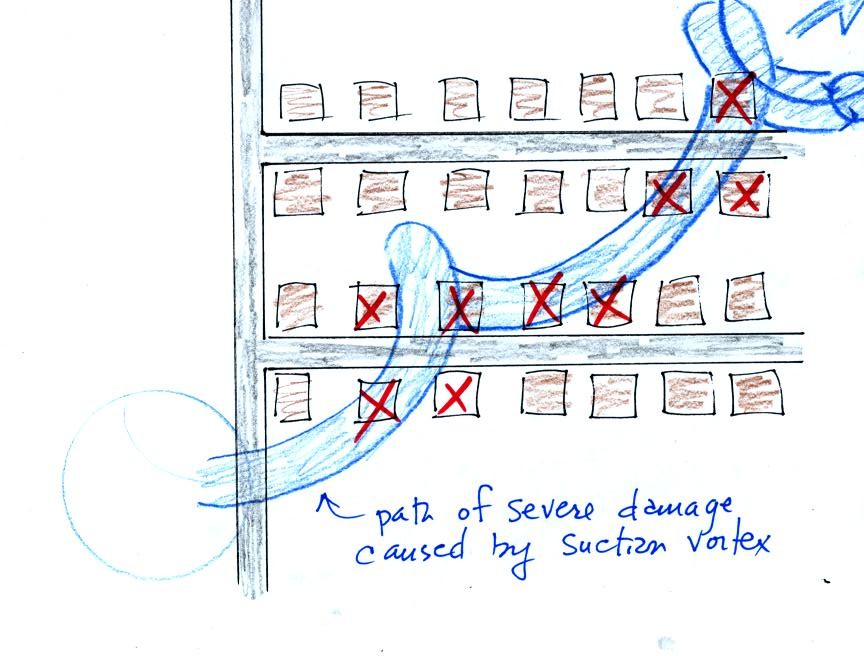
shown. A film crew was on board a NOAA
reconnaissance plane as it flew into the narrow eye of hurricane
GILBERT. Gilbert set the record low sea level pressure reading
for the Atlantic ocean (888 mb). That record stood until the 2005
hurricane season when WILMA set a new record of 882 mb. The world
record low sea level pressure, 870 mb, was set in a SE Asian typhoon in
1979.
The following two figures (on the back of the handout distributed in
class) explain material mentioned during the video tape.