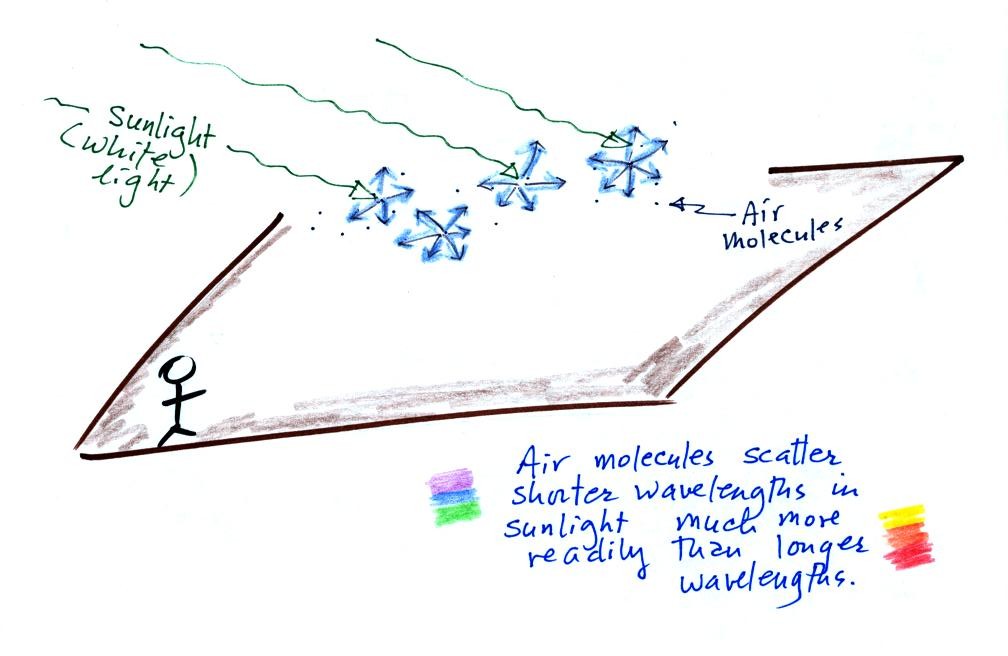
Air molecules scatter
sunlight. Because the air molecules are small (relative to the
wavelength of visible light) they scatter shorter wavelengths more
readily than longer wavelengths. When you look away from the sun
and toward the sky you see this scattered light, it has a deep blue
color.
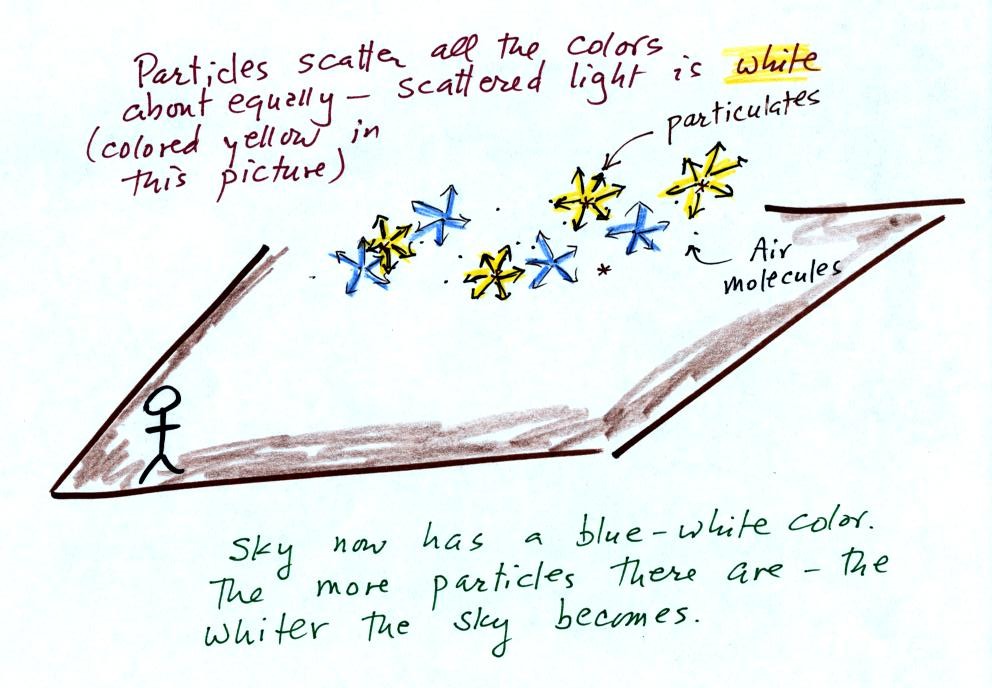
Particles also scatter light
(remember the chalk dust used in the demonstration last week).
But because the particle size is about equal to or somewhat greater
than the wavelength of visible light the particles scatter all the
colors equally. The light scattered by particles is white.
As the amount of particulate matter in the air increases the color of
the sky changes from deep blue to whitish blue. The higher the
particle concentration, the white the sky becomes.
Scattering of sunlight by air molecules turns distant
mountains blue
and eventually makes them fade from view
(there is eventually much more sunlight being scattered by air than
there is sunlight being reflected by the mountains; there is a limit to
how far you can see even when the air is very clean).
A nearby mountain might appear dark green or brown. You are
mainly seeing light reflected off the mountain. As the mountain
gets further away you start seeing increasing amounts of blue light
(sunlight scattered by air molecules in between you and the
mountain). As the mountain gets even
further the amount of this blue light from the sky increases.
Eventually the mountain gets so far away that you only see blue sky
light and none of the light reflected by the mountain itself.

Note the PM10 annual National
Ambient Air Quality Standard (NAAQS) value of 50 micrograms/meter3 at
the bottom of p. 13c in the photocopied ClassNotes (shown above).
The following list shows that there are several cities around the world
where PM concentrations 2 or 3 times the NAAQS value.
There was some concern this past summer that the polluted air in
Beijing would affect the athletic competition during the Olympic
Games. Chinese authorities restricted transportation and
industrial activities both before and during the games in an attempt to
reduce pollutant concentrations. Rainy weather during the games
may have had the greatest effect, however. The figure below wasn't shown in
class.
I included here just to be sure you wouldn't miss the important fact
that clouds are the best way of cleaning pollutants from the air.
Here are
some of the key things to remember about particulate matter.
Today and
next Monday we
will take a brief look at the current concern over increasing
concentrations
of
carbon
dioxide in the earth's atmosphere and the
worry that this might lead
to global warming and climate change. This is a big, complex, and
contentious subject and we will only
scratch the
surface.
We'll start with the information on
the top of p. 3a in the photocopied ClassNotes (p. 3 was broken into a
couple of pieces and redone for improved clarity). The numbered
points were added after class.

1. Carbon dioxide is one of several greenhouse
gases. Much
of what we say about CO2 applies to the other greenhouse
gases as well.
2. Atmospheric CO2 concentrations are
increasing.
This is pretty generally accepted as fact. We'll look at some of
the evidence below.
3. Before we look at enhancement of the greenhouse effect,
it is important to understand first that the greenhouse effect is
beneficial.
3a. If the earth's
atmosphere didn't contain any greenhouse gases, the global annual
average surface temperature would be about 0o F.
That's pretty
cold
3b. The presence of greenhouse gases raises this
average
temperature to about 60o F.
4. The concern is that increasing atmospheric greenhouse
gas concentrations might cause some additional warming. This
might not sound like a bad thing. However a small change in
average temperature might melt
polar ice and cause a rise in sea level and
flood coastal areas. Warming might change weather patterns and
bring more precipitation to some areas and less to places like
Arizona.
Now some of the data that show atmospheric carbon dioxide
concentrations are increasing.
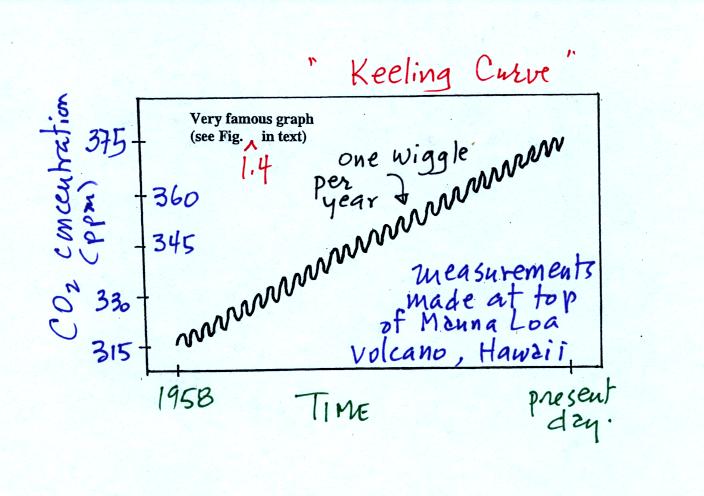
The "Keeling" curve shows measurements of CO2
that
were begun
in 1958 on top of the Mauna Loa volcano in Hawaii. Carbon dioxide
concentrations have increased from 315 ppm to about 385 ppm between
1958 and the present day. The small wiggles (one wiggle per year)
show that CO2
concentration
changes slightly during the course of a year.
You'll find an up to date record of atmospheric CO2
concentration from
the Mauna Loa observatory at the Scripps
Institution of Oceanography site.
Once scientists saw this data they began to wonder about
how
CO2
concentration might have been changing prior to 1958. But how
could you now, in 2008, go back and measure the amount of CO2
in the
atmosphere in the past? Scientists have found a very clever way
of
doing just that. It involves coring down into ice sheets that
have
been building up in Antarctica and Greenland for hundreds of thousands
of years.
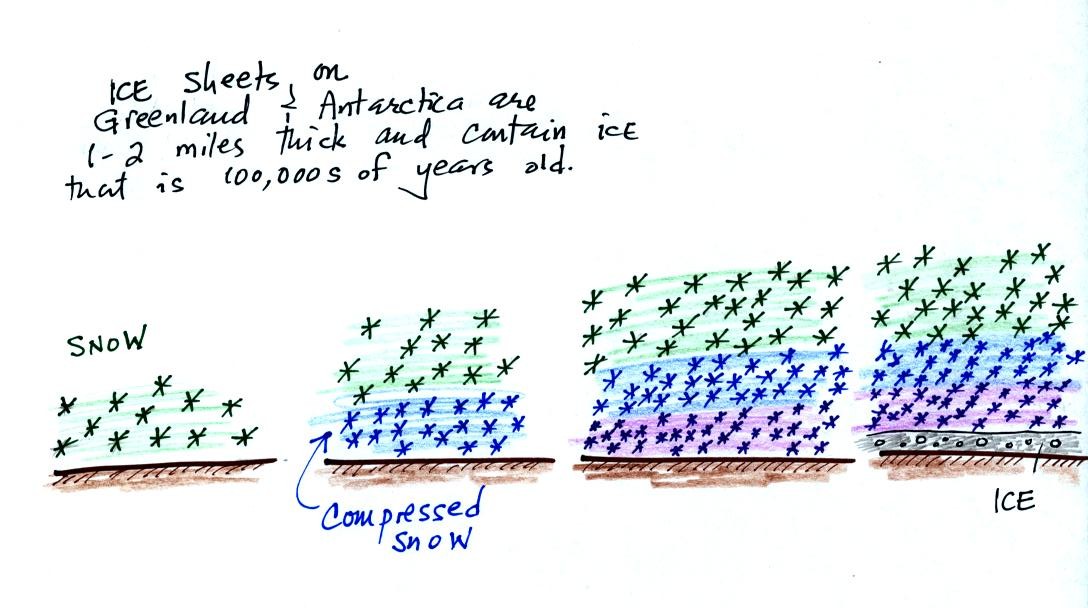
As layers of snow are piled on top
of each other year
after
year, the
snow at the bottom is compressed and eventually turns into a thin layer
of
solid
ice. The ice contains small bubbles of air trapped in the snow,
samples of the atmosphere at
the time the snow originally fell. Scientists are able to date
the ice layers and then
take the air out of these bubbles and measure the carbon dioxide
concentration. This isn't easy, the layers are very thin, the
bubbles are small and it is hard to avoid contamination.
Using the ice core measurements
scientists have determined
that
atmospheric CO2 concentration was fairly constant at about
280 ppm
between
1000 AD and the mid-1700s when it started to increase. The start
of rising CO2 coincides with the beginning of the
"Industrial
Revolution."
Combustion of fossil fuels needed to power factories began to add
significant amounts of CO2
to the
atmosphere.
Shown below are some more carefully
drawn graphs of changing carbon dioxide, methane, and
nitrous oxide concentrations during the past 1000 years from
Climate
Change 2001 - The Scientific Basis
Contribution of Working Group I to the 3rd Assessment Report of the
Intergovernmental Panel on Climate Change (IPCC) These figures weren't shown in class
Now before we look at what the earth's
temperature has been doing during this period we will try to understand
better how man has been able to change atmospheric CO2 concentrations.
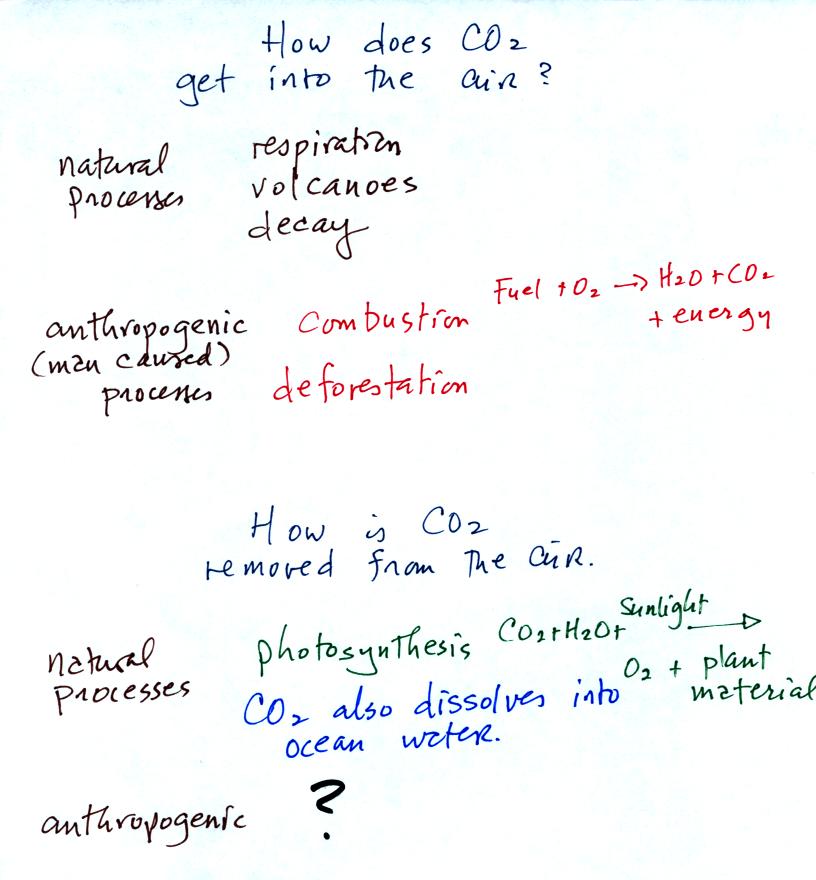
Carbon dioxide is added
to the
atmosphere naturally by respiration (people breathe in oxygen and
exhale carbon dioxide), decay, and volcanoes. Combustion of
fossil fuels, a human activity also adds CO2 to the
atmosphere. Deforestation,
cutting down and killing a tree (or burning the tree) will keep
it from removing CO2 from the air by photosynthesis.
The dead
tree will also decay and release CO2 to the air.
The chemical equation illustrates the combustion of a fossil
fuel. The by products are carbon dioxide and water vapor.
The steam cloud that
you sometimes see come from a rooftop vent or the tailpipe of an
automobile (especially during cold wet weather) is evidence of the
production of water vapor during the
combustion.
Photosynthesis removes CO2 from the air (in some respects,
photosynthesis is the opposite of combustion, photosynthesis
manufactures fuel and adds
oxygen to the air). CO2
also dissolves in
ocean water.
The ? means your instructor is
not aware of an anthropogenic process
that removes large amounts of carbon dioxide from the air.
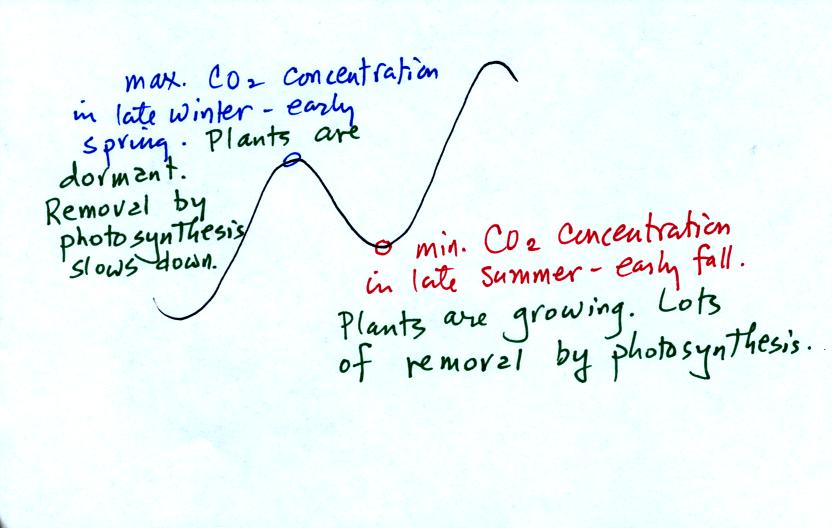
We are now able to better understand the
yearly
variation in atmospheric CO2
concentration (the "wiggles" on the Keeling Curve).
The figure below was not shown in
class.
Atmospheric CO2 peaks in the late winter
to early
spring. Many
plants die or become dormant in the winter. With less
photosynthesis, more CO2 is added to the atmosphere than can
be
removed. The concentration builds throughout the winter
and reaches a peak value in late winter - early spring. Plants
come back to life at that time and start to remove the "excess" CO2.
In the summer the removal of CO2 by photosynthesis
exceeds
release. CO2 concentration decreases throughout the
summer and
reaches a minimum in late summer to early fall.
With careful measurements you could probably also observe a daily
variation in atmospheric CO2 concentrations.