Thursday Sept. 18, 2008

A couple of more songs, "The Ballad of Cable Hogue" and "Si Tu Disais," from Calexico, Mariachi Luz de Luna, and a French singer, Françoiz Breut, before class today.

The Bonus 1S1P reports were collected in class today.  It will take some time (probably at least one week) to grade those reports and return them to you.

The In-class Optional Assignment from Tuesday was returned in class today.  You'll find answers here.

The Quiz #1 Study Guide is now available.  Quiz #1 will cover material on both the Practice Quiz Study Guide and the Quiz #1 Study Guide.  An extra review has been scheduled for next Tuesday afternoon from 2-3 pm in Modern Languages 310. 

Hey!  Look carefully through today's online notes - there's a hidden optional assignment.  If you decide to do the assignment it's due at the beginning of class next Tuesday.


Last Tuesday
we looked at how air density change with increasing altitude.  We should have looked at how air temperature changes with altitude.  I completely forgot to do that in class on Tuesday.  We came back to that topic at the beginning of class today.  You'll find the notes, however, embedded in the notes from last Tuesday


Next an abrupt transition to a different topic.


Nobody has told me yet why hot air balloons rise.  It isn't just hot air balloons, but the warm air in a thunderstorm updraft also rises.  Conversely cold air sinks.  A full understanding of why this occurs is a 3-step process.  We worked through the first two steps today.

The figure above is the bottom part of p. 49 in the photocopied ClassNotes.  We will first learn about the ideal gas law.  That is an equation that tells you how properties of the air inside a balloon work to determine the air's pressure.  Then we will look at Charles' Law, a special situation involving the ideal gas law. 

The figure above makes an important point: the air molecules in a balloon "filled with air" really take up very little space.  A balloon filled with air is really mostly empty space.  It is the collisions of the air molecules with the inside walls of the balloon that keep it inflated.

Up to this point in the semester we have been thinking of pressure as being determined by the weight of the air overhead.  Air pressure pushes down against the ground at sea level with 14.7 pounds of force per square inch.  If you imagine the weight of the atmosphere pushing down on a balloon sitting on the ground you realize that the air in the balloon pushes back with the same force.  Air everywhere in the atmosphere pushes upwards, downwards, and sideways. 

The ideal gas law equation is another way of thinking about air pressure.  We ignore the atmosphere and concentrate on just the air inside the balloon.  We are going to "derive" an equation.  Pressure (P) will be on the left hand side.  Properties of the air inside the balloon will be found on the right side of the equation.


In A
t
he pressure produced by the air molecules inside a balloon will first depend on how many air molecules are there.  If there weren't any air molecules at all there wouldn't be any pressure.  As you add more and more air to something like a bicycle tire, the pressure increases.  Pressure is directly proportional to N - an increase in N causes an increase in P.  If N doubles, P also doubles (as long as the other variables in the equation don't change).

In B
air pressure inside a balloon also depends on the size of the balloon.  Pressure is inversely proportional to volume, V .  If V were to double, P would drop to 1/2 its original value.

Note
it is possible to keep pressure constant by changing N and V together in just the right kind of way.  This is what happens in Experiment #1 that some of you are working on.  Oxygen in a graduated cylinder reacts with steel wool to form rust.  Oxygen is removed from the air sample which is a decrease in N.  As oxygen is removed, water rises up into the cylinder decreasing the air sample volume.  N and V both decrease in the same relative amounts and the air sample pressure remains constant.
  If you were to remove 20% of the air molecules, V would decrease to 20% of its original value and pressure would stay constant.

Increasing the temperature of the gas in a balloon will cause the gas molecules to move more quickly.  They'll collide with the walls of the balloon more frequently and rebound with greater force.  Both will increase the pressure.  You shouldn't throw a can of spray paint into a fire because the temperature will cause the pressure inside the can to increase and the can could explode.  We'll demonstrate the effect of temperature on pressure in class on Friday. 


A short demonstration shows how changes in air temperature affect pressure.  We used a flask connected to a manometer.  A manometer is able to detect differences in pressure (differences between the pressure of the air inside the flask compared to the air outside the flask)

Initially the air in the flask was exactly the same as the air outside.  The levels of the red liquid in the manometer were the same indicating the Patmosphere and Pflask were the same.  Next we both warmed (with my hands) and cooled the air (with some liquid nitrogen) in the flask. 

Warming the air in the flask increased the pressure inside the flask.  Cooling the flask reduced the pressure of the air in the flask.  The changing liquid levels revealed these changes in pressure.


Now if you refer back a couple of figures to p. 51, you'll see that, surprisingly, the pressure of the air in a balloon does not depend on the mass of the air molecules.  Pressure doesn't depend on the composition of the gas.  Gas molecules with a lot of mass will move slowly, the less massive molecules will move more quickly.  They both will collide with the walls of the container with the same force.

The figure below (which replaces the bottom of p. 51 in the photocopied ClassNotes) shows two forms of the ideal gas law.  The top equation is the one we just derived and the bottom is a second slightly different version. 
You can ignore the constants k and R if you are just trying to understand how a change in one of the variables would affect the pressure.  You only need the constants when you are doing a calculation involving numbers.


We now turn our attention to Charles' Law, a special situation involving the ideal gas law.  In Charles Law, the pressure inside a balloon stays constant.  This is possible because the balloon is free to expand or shrink if there is a change of the temperature of the air in the balloon.


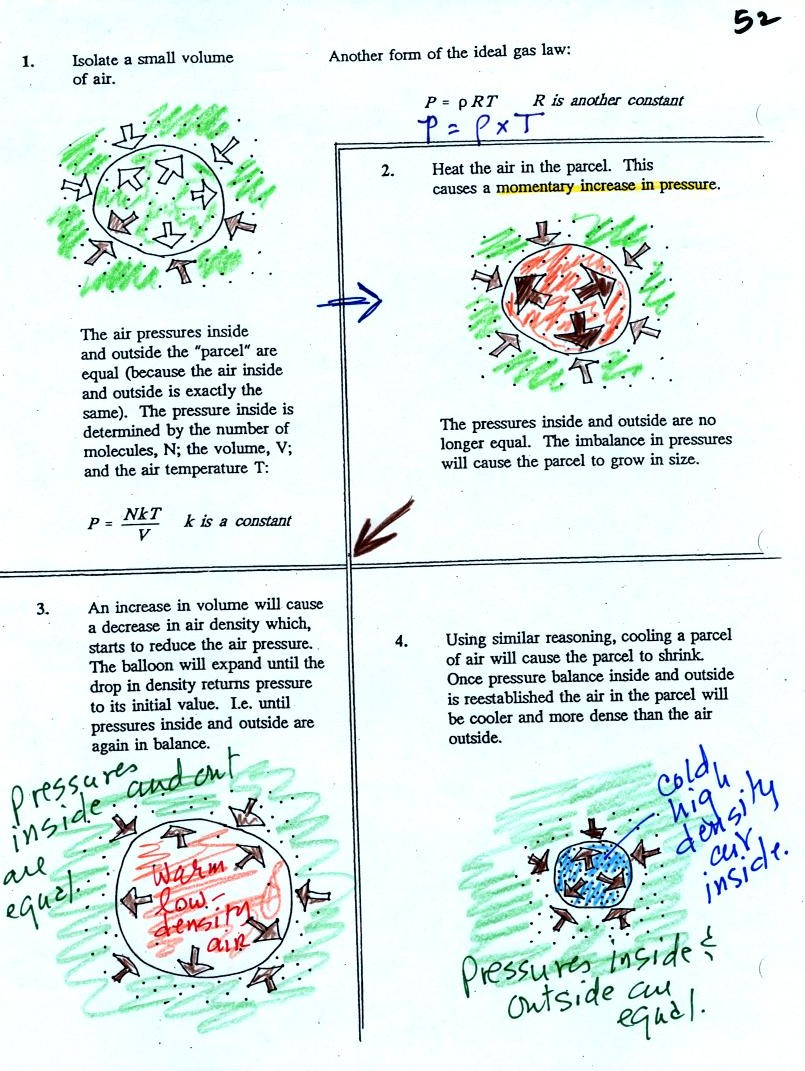
Read through the explanation on p. 52 in the photocopied Classnotes. 

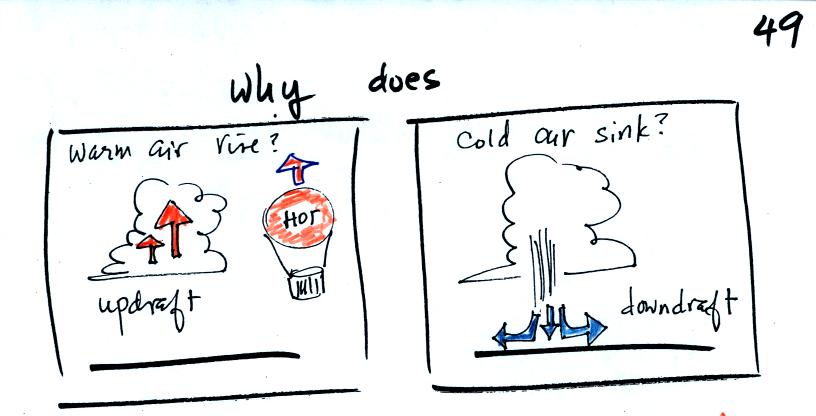
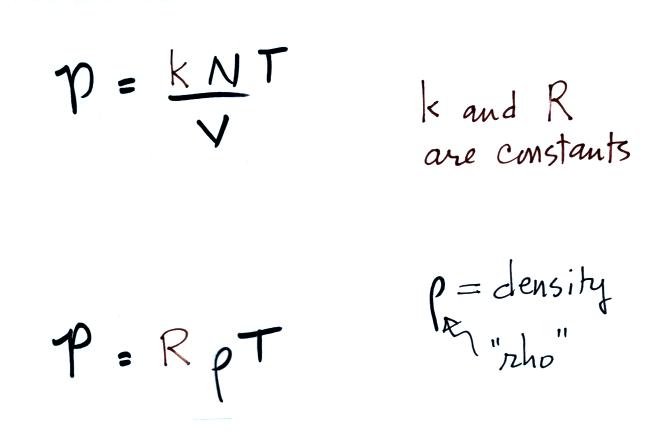
These two associations:
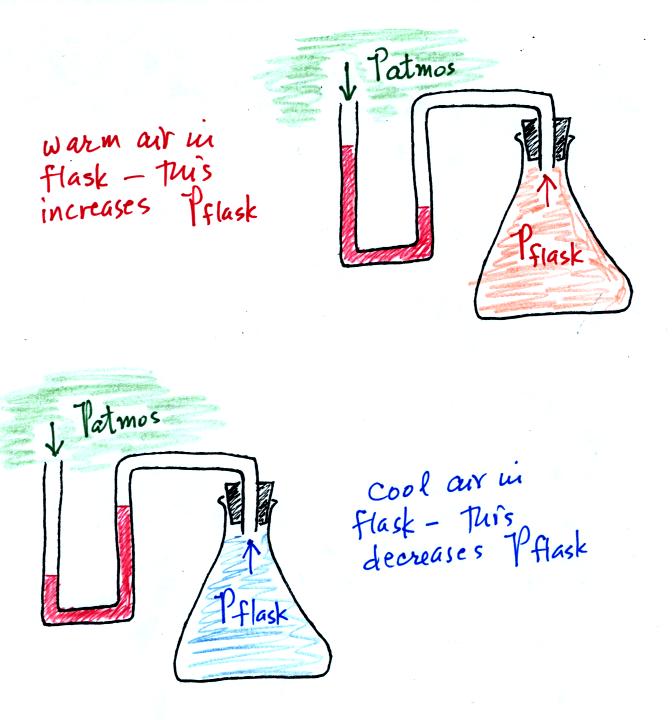
(i)   warm air = low density air
(ii)  cold air = high density air
are important and will come up a lot during the remainder of the semester.

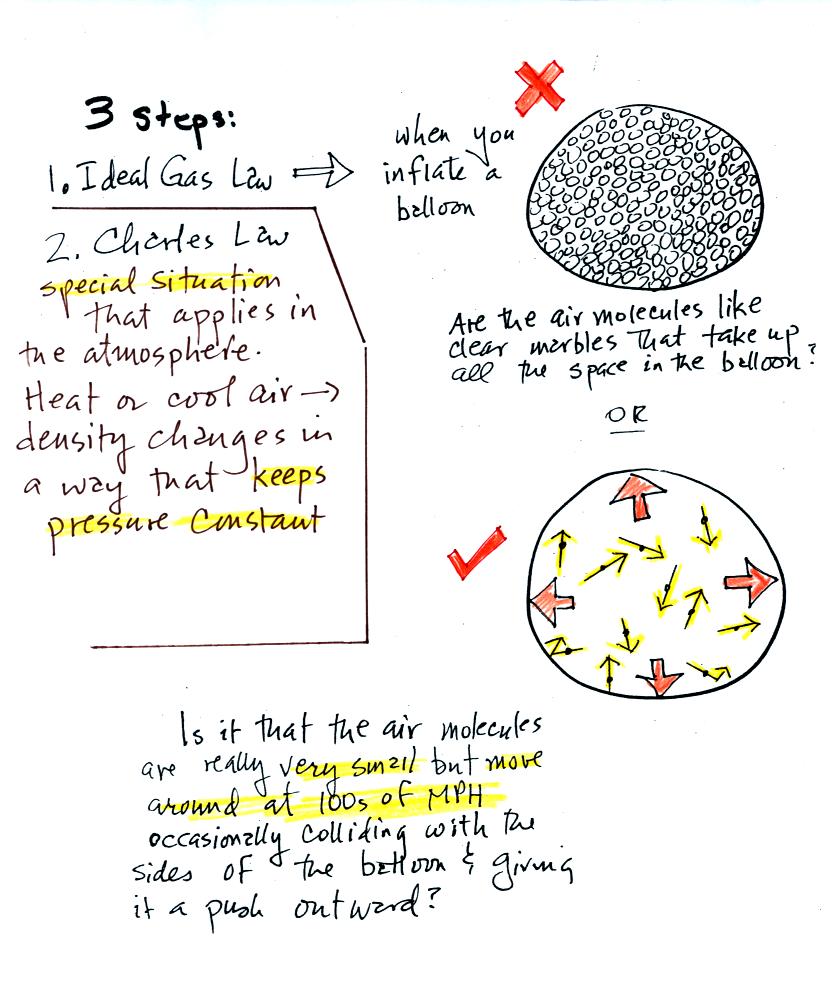
Click here if you would like a little more detailed, more step-by-step, explanation of Charles Law.  Otherwise proceed on to the Charles' Law demonstration that we did in class.


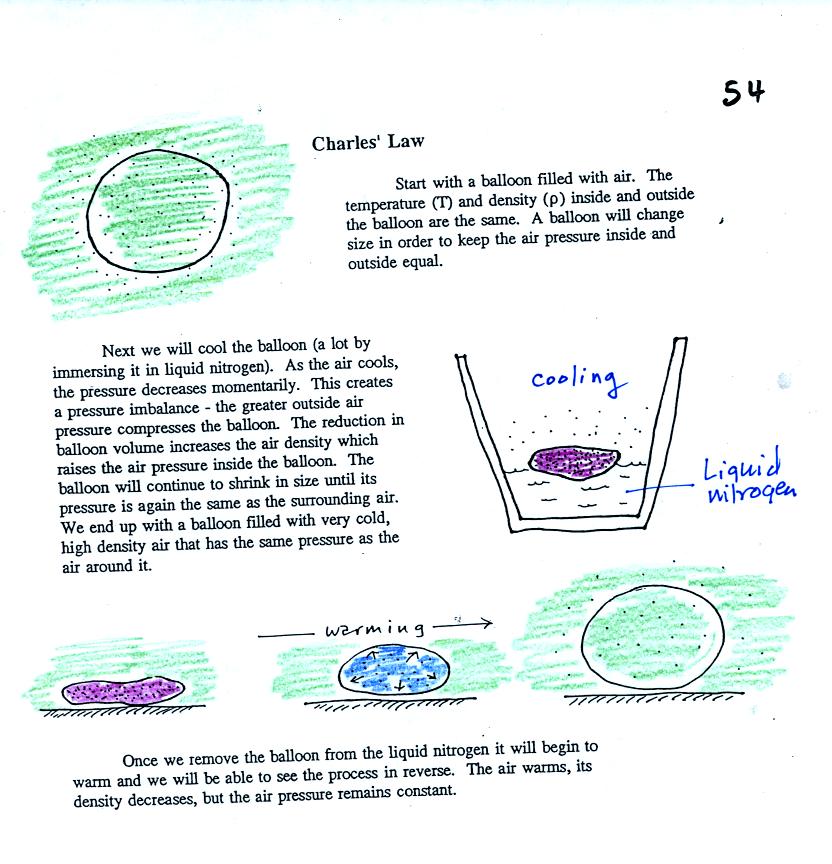
Charles Law can be demonstrated by dipping a balloon in liquid nitrogen.  You'll find an explanation on the top of p. 54 in the photocopied ClassNotes.


The balloon had shrunk down to practically no volume when pulled from the liquid nitrogen.  It was filled with cold high density air.  As the balloon warmed the balloon expanded and the density of the air inside the balloon decreased.  The volume and temperature kept changing in a way that kept pressure constant.
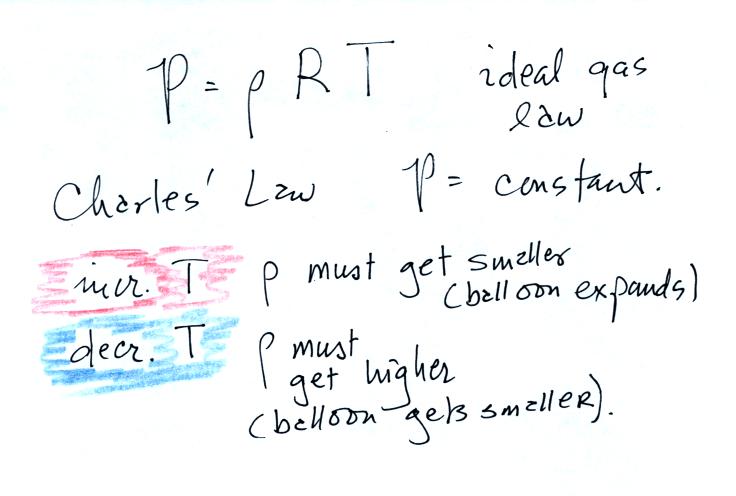
Here's a summary


Now we're going to go back to the surface weather map topic that we started on Tuesday.  We've covered a lot of material already today, this might be a good time to go outside for a smoke, or a drink, or a stretch, or maybe a good yell.

A bunch of weather data has been plotted on a map in the figure below. 

Plotting the surface weather data on a map is just the beginning.  For example you really can't tell what is causing the cloudy weather with rain (the dot symbols are rain) and drizzle (the comma symbols) in the NE portion of the map above or the rain shower at the location along the Gulf Coast.  Some additional analysis is needed.  A meteorologist would usually begin by drawing some contour lines of pressure to map out the large scale pressure pattern.  We will look first at contour lines of temperature, they are a little easier to understand.

I told you I would finish coloring the map when I got back to my office.  Isotherms, temperature contour lines, are usually drawn at 10 F intervals. They do two things: (1) connect points on the map that all have the same temperature, and (2) separate regions that are warmer than a particular temperature from regions that are colder.  The 40o F isotherm highlighted in yellow above passes through City A which is reporting a temperature of exactly 40o.  Mostly it goes between pairs of cities: one with a temperature warmer than 40o and the other colder than 40o.  Click here to download the hidden optional assignment.  Temperatures generally decrease with increasing latitude.

Now the same data with isobars drawn in.  Again they separate regions with pressure higher than a particular value from regions with pressures lower than that value.    Isobars are generally drawn at 4 mb intervals.  Isobars also connect points on the map with the same pressure.  The 1008 mb isobar (highlighted in yellow) passes through a city  where the pressure is exactly 1008.0 mb.  Most of the time the isobar will pass between two cities.  The 1008 mb isobar passes between cities A and B with pressures of 1009.1 mb and 1004.7 mb.  You would expect to find 1008 mb somewhere in between those two cites, that is where the 1008 mb isobar goes.

The pattern on this map is very different from the pattern of isotherms.  On this map the main features are the circular low and high pressure centers.

We had time to work through the pictures on p. 40a in the photocopied ClassNotes.  The figures have been redrawn below for improved clarity.

Air will start moving toward low pressure (like a rock sitting on a hillside that starts to roll downhill), then something called the Coriolis force will cause the wind to start to spin (we'll learn more about the Coriolis force later in the semester). Winds spin in a counterclockwise (CCW) direction around surface low pressure centers.  The winds also spiral inward toward the center of the low, this is called convergence.  [winds spin clockwise around low pressure centers in the southern hemisphere but still spiral inward]

When the converging air reaches the center of the low, the starts to rise.  Rising air expands and cools.  If the air is sufficiently moist clouds can form and then begin to rain or snow.  Thus you often see cloudy skies and stormy weather associated with surface low pressure.

We didn't have time to look at what happens with surface high pressure centers, it is pretty much just the opposite:

Winds spin clockwise (counterclockwise in the southern hemisphere) and spiral outward.  The outward motion is called divergence.

Air sinks in the center of surface high pressure to replace the diverging air.  The sinking air is compressed and warms.  This keeps clouds from forming so clear skies are normally found with high pressure (clear skies but not necessarily warm weather, strong surface high pressure often forms when the air is very cold).