Friday Sep. 4, 2009
click here to download today's notes in
a more printer friendly format
Three songs from the Doors today before class: "Love Me Two
Times", "Soul Kitchen", and "Love Her Madly."
At this point the Tucson Weather
Service webpage is showing a 60%
chance of heavy rain for Saturday. It looks like the UA football
home opener might be wet.
I added a
slightly different explanation of how particles in the air can affect
visibility to the end of the Wed., Sep. 2 online
notes. We reviewed this quickly at the start of class.
We spent the period today and will spend part of class next Wednesday (before
the Practice Quiz) looking
at the current concern over increasing
greenhouse concentrations in the earth's atmosphere, global warming,
and climate change. This is a big, complex, and
contentious subject and we will only
scratch the
surface.
Quite a bit of information needs to
be added to p. 3a in the photocopied ClassNotes; we will break it up
into several smaller pieces for clarity.
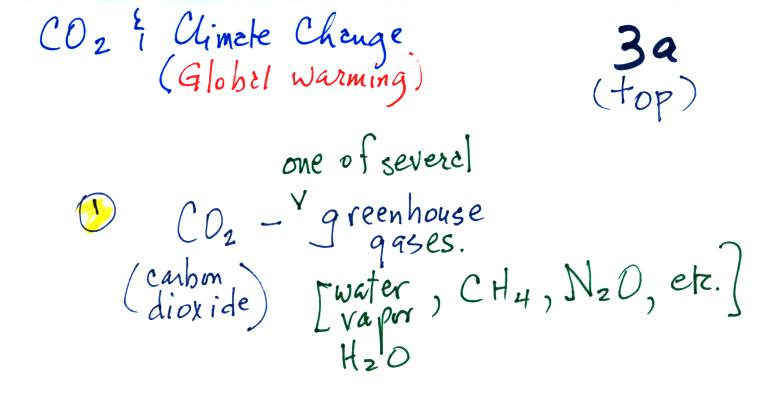
Point 1. Carbon
dioxide is probably the best known of several greenhouse
gases (water vapor is a more important greenhouse gas). Much
of what we say about CO2 applies to the other greenhouse
gases as well.
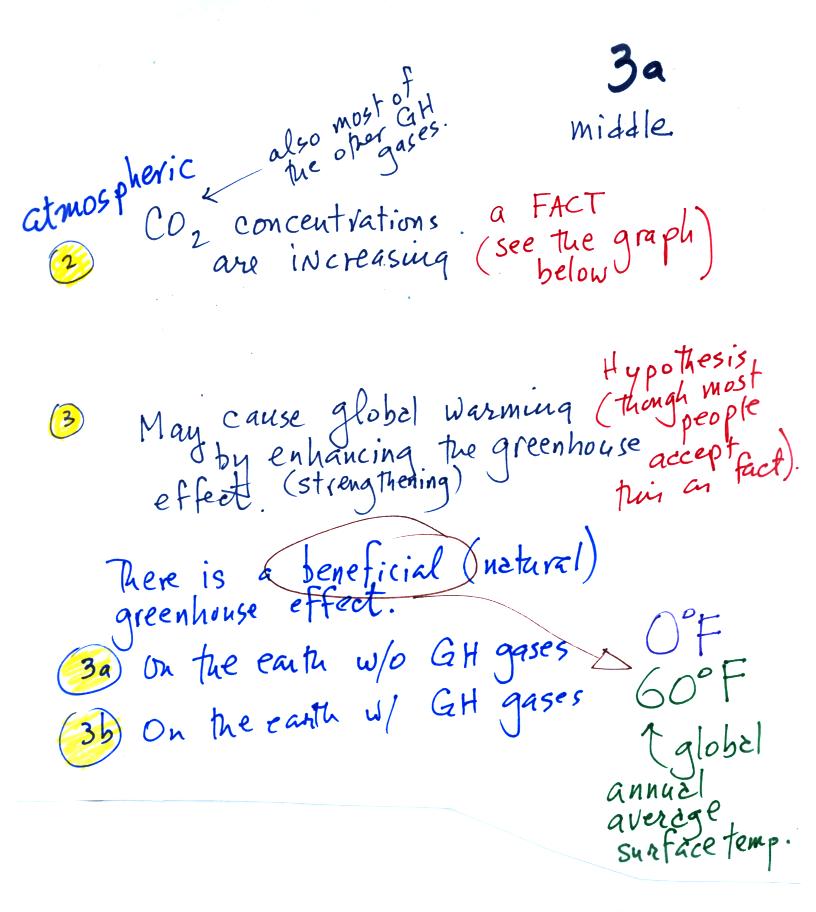
Point 2.
Atmospheric CO2 concentrations are
increasing.
This is generally accepted as fact. We'll look at some of
the evidence below.
Point 3. The basic
worry is that increasing greenhouse gas concentrations will cause
global warming. This is a hypothesis though many (perhaps the
vast majority of) scientists regard this as fact and believe that
enhanced greenhouse warming is already underway.
Before we look at enhancement of the
greenhouse effect,
it is important to first understand that the greenhouse effect has a
beneficial side. You might refer to this as the natural
greenhouse effect (i.e. one that has not been affected or influenced by
human activities)
Point 3a. If the earth's
atmosphere didn't contain any greenhouse gases, the global annual
average surface temperature would be about 0o F.
That's pretty
cold
Point 3b. The
presence of greenhouse gases raises this
average
temperature to about 60o F.
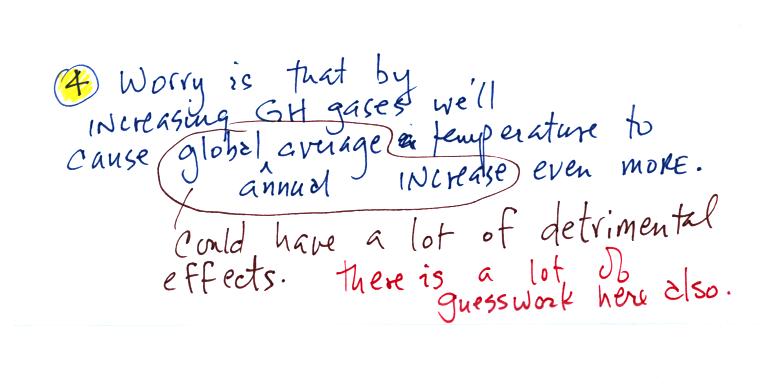
Point 4. The
concern is that increasing atmospheric greenhouse
gas concentrations might cause some additional warming. This
might not sound like a bad thing. However a small change in
average temperature might melt
polar ice and cause a rise in sea level and
flood coastal areas. Warming might change weather patterns and
bring more precipitation to some areas and prolonged drought to places
like
Arizona. Nasty tropical diseases (such as malaria) might spread
into more temperature areas.
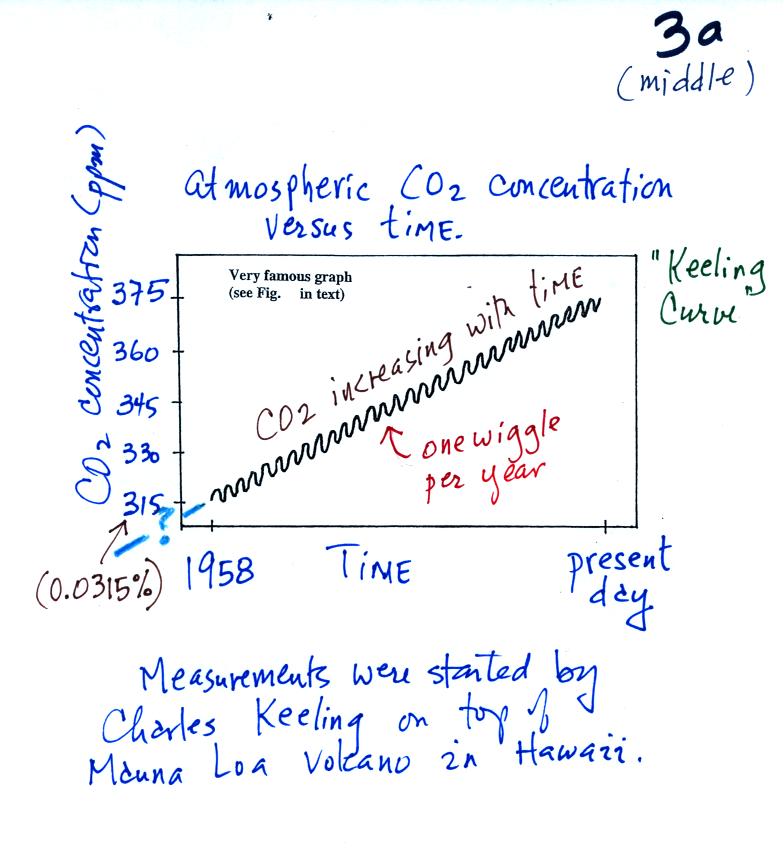
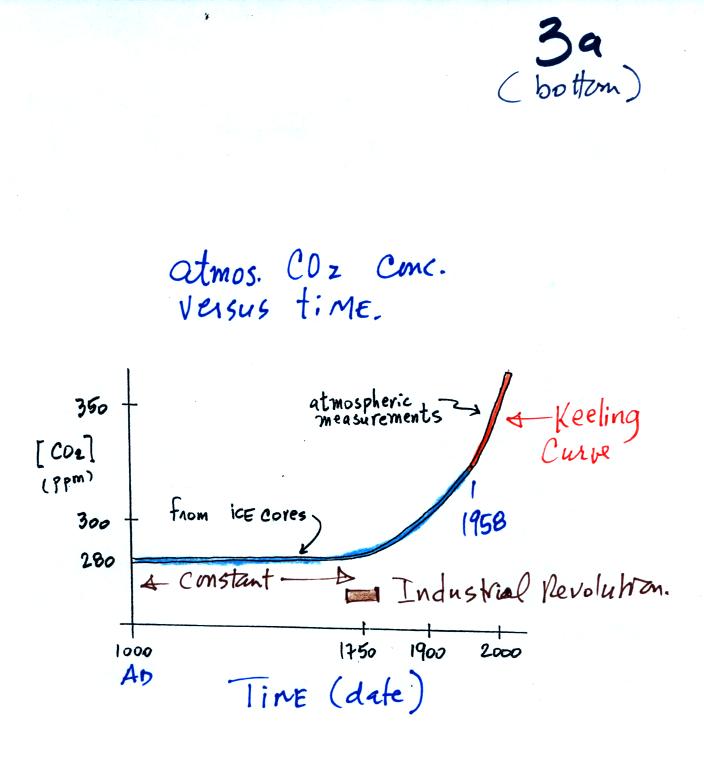
Now some of the data that show atmospheric carbon dioxide
concentrations are increasing.
The "Keeling" curve shows
measurements of CO2
that
were begun
(by a graduate student named Charles Keeling) in 1958 on top of the
Mauna Loa volcano in Hawaii. Carbon dioxide
concentrations have increased from 315 ppm to about 385 ppm between
1958 and the present day. The small wiggles (one wiggle per year)
show that CO2
concentration
changes slightly during the course of a year (it also probably changes
slightly during the course of a day).
You'll find an up to date record of atmospheric CO2
concentration from
the Mauna Loa observatory at the Scripps
Institution of Oceanography site.
Once scientists saw this data they began to wonder about
how
CO2
concentration might have been changing prior to 1958. But how
could you now, in 2009 say, go back and measure the amount of CO2
in the
atmosphere in the past? Scientists have found a very clever way
of
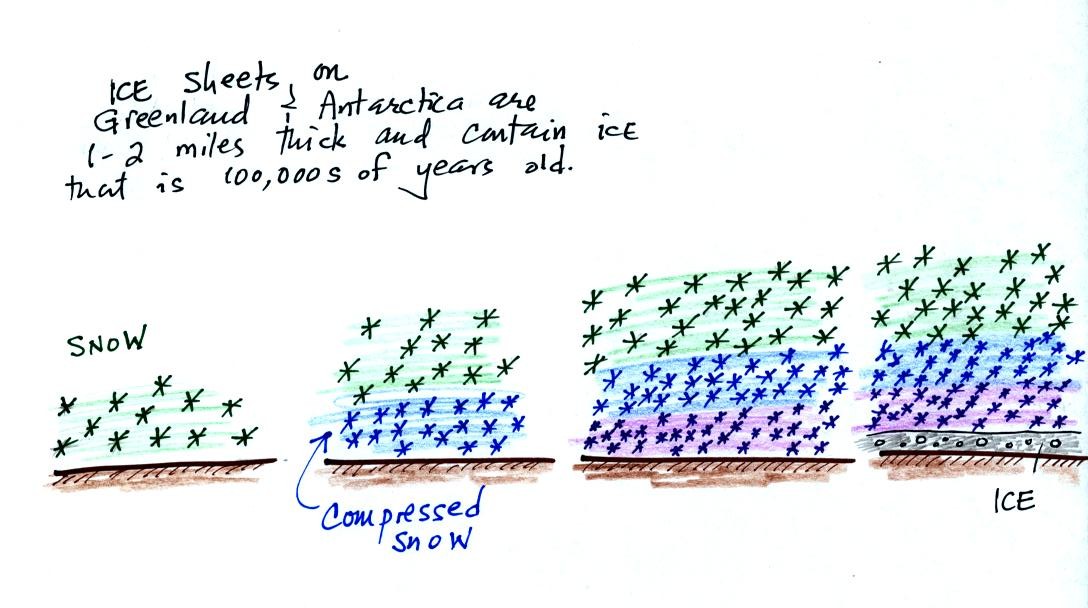
doing just that. It involves coring down into ice sheets that
have
been building up in Antarctica and Greenland for hundreds of thousands
of years.
As layers of snow are piled on top
of each other year
after
year, the
snow at the bottom is compressed and eventually turns into a thin layer
of
solid
ice. The ice contains small bubbles of air trapped in the snow,
samples of the atmosphere at
the time the snow originally fell. Scientists are able to date
the ice layers and then
take the air out of these bubbles and measure the carbon dioxide
concentration. This isn't easy, the layers are very thin, the
bubbles are small and it is hard to avoid contamination.
In order to understand why atmospheric carbon dioxide
concentration is increasing, and before we look at what the earth's
temperature has been doing during this period, we will try to
understand
better how man has been able to change atmospheric CO2
concentrations.
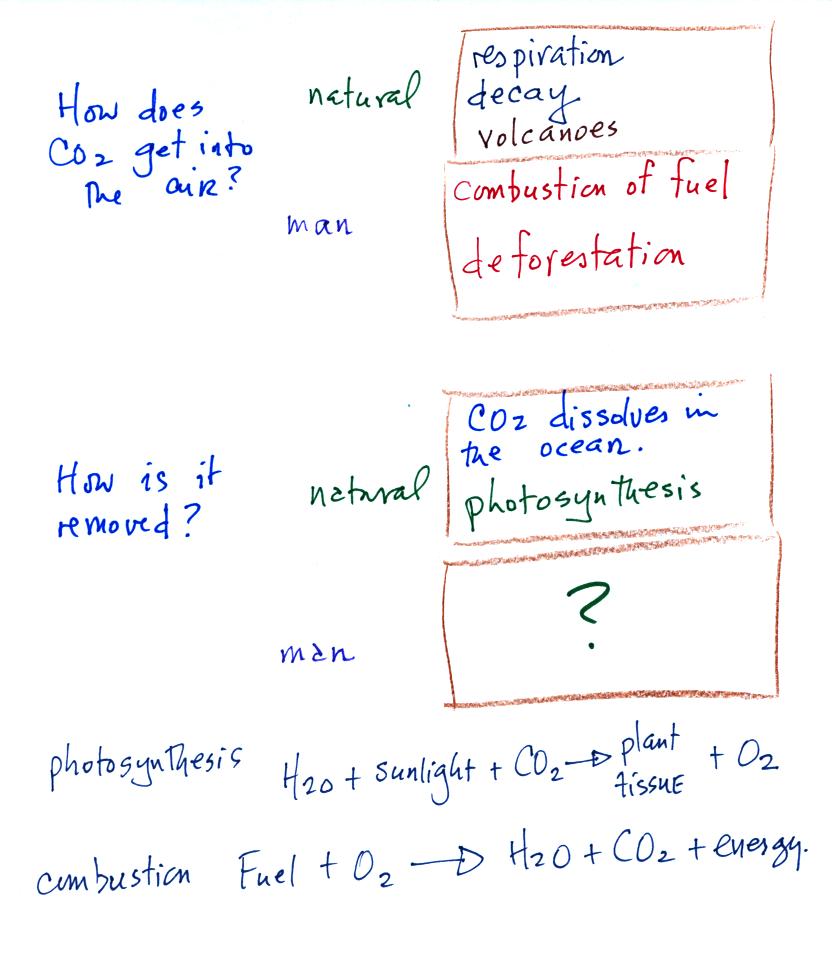
Carbon dioxide is added
to the
atmosphere naturally by respiration (people breathe in oxygen and
exhale carbon dioxide), decay, and volcanoes (volcanoes was added after class).
Combustion of
fossil fuels, a human activity also adds CO2 to the
atmosphere. Deforestation,
cutting down and killing a tree will keep
it from removing CO2 from the air by photosynthesis.
The dead
tree will also decay and release CO2 to the air.
CO2 is removed from the atmosphere by photosynthesis. CO2 also
dissolves in the oceans.
The ? means your instructor is
not aware of an anthropogenic process
that removes significant amounts of carbon dioxide from the air.
We
are now able to better understand the
yearly
variation in atmospheric CO2
concentration (the "wiggles" on the Keeling Curve).
In the bottom curve we assume that the release of CO2 to the air
remains constant throughout the year. Photosynthesis will
change. Photosynthesis is highest in the summer when plants are
growing actively. It is lowest in the winter when many plants are
dead or dormant.
Atmospheric CO2 concentration will decrease as
long as the rate of removal (photosynthesis) is greater than the rate
of release (blue shaded portion above). Your bank account balance
will drop as long as you spend more money than you deposit. The
minimum occurs at the right end of the blue shaded portion where
removal once again equals release.
The CO2 concentration
will increase when release exceeds removal (red shaded section).
The highest CO2 concentration occurs at the right end of the red shaded
portion.
To
really understand
why human activities are causing atmospheric CO2
concentration to
increase we need to look at the relative amounts of CO2
being added to
and being removed from the atmosphere (like amounts of money moving
into and out of a bank account and their effect on the account
balance). A simplified version of the carbon cycle is shown
below. We didn't have time in class to go through all of this, I added most of the information after
class.

Here are the main points to take from this figure:
1. The underlined numbers show
the amount of carbon stored in "reservoirs." For example 760
units* of carbon
are stored in the atmosphere (predominantly in the form of CO2,
but
also in small amounts of CH4 (methane),
CFCs
and other gases; anything that contains carbon). Notes
that the atmosphere is a fairly small reservoir.
The other numbers show
"fluxes," the amount of carbon moving into or out of the various
reservoirs ( actually just into and out of the atmosphere ). Over
land, respiration and decay add 120 units* of carbon
to the
atmosphere every year. Photosynthesis (primarily) removes 120
units every year.
2. Note the natural processes
are in balance (over land: 120 units added and 120 units removed, over
the oceans: 90 units added balanced by 90 units of carbon removed from
the atmosphere every year). If these were the only processes present,
the atmospheric concentration (760 units)
wouldn't change.
3. Anthropogenic (man caused) emissions
of
carbon into the air are small compared to natural processes. About
6.4 units are added during combustion of fossil fuels and 1.6
units are added every year because of deforestation (when trees are cut
down they decay or are burned and add CO2 to the air, also
because they
are dead they
aren't able to remove CO2 from the air by photosynthesis)
The rate at which carbon is added to the atmosphere by man is not
balanced by an equal rate of removal: 4.4 of the 8 units added every
year are removed (highlighted in yellow in the figure). This
small imbalance (8 - 4.4 = 3.6 units of carbon are left in the
atmosphere every year) explains why
atmospheric carbon dioxide concentrations are increasing with time.
4. In the next 100 years or so,
the 7500 units of carbon stored in the fossil fuels reservoir (lower
left
hand corner of the figure) will be dug up or pumped out of the ground
and burned. That will add 7500 units of carbon to the air.
The big
question is how will the atmospheric
concentration change and what effects will that have on climate?
*don't worry about the units. But here they are
just in case you are interested:
Reservoirs - Gtons
Fluxes - Gtons/year
A Gton = 1012 metric tons. (1 metric ton is 1000
kilograms or
about 2200
pounds)