Monday Sep. 14, 2009
click here to download today's notes in
a more printer friendly format
The sound and projection system worked great in AME 202 ((I had
troubles in ILC 140 on Thursday morning) and I was able to show three
songs from the Calexico Live at the Barbican London DVD (which made me
very happy). The three songs were Quattro (World
Drifts In), Ballad
of Cable Hogue (with Francoiz Breut), and Si Tu Disais
(with Francoiz Breut). A couple of songs from Mariachi Luz de
Luna (from Tucson) coming on Wednesday.
This semester's first real optional
assignment was announced/distributed in class today. You can
earn extra credit by making an honest attempt at answering the
questions. All I ask is that you complete the assignment before
coming to class.
The Experiment #1 reports are due next Monday. You should wrap up
the data collection and return your materials this week so that you can
pick up the supplementary information sheet.
Tutoring and reviews for the class are now available at the Student
Academic Learning Center's Think Tank.
Click here
to see the weekly course review schedule.

Point 2a - Moving upward from the ground we find that pressure
decreases
to 900 mb at the level of the dotted line in the picture at left.
This is what you expect, pressure decreases with increasing
altitude.
Point 2b - In the figure at right you need to go a little bit
higher for the same 100 mb decrease.
The most rapid rate of pressure decrease with increasing
altitude is occurring in the picture at left because the 100 mb change
occurs in a shorter distance.
Point 3 -
Since there is a 100 mb drop in both the layer at left and
in
the
layer at right, both layers must contain the same amount (mass) of air.
Point 4 - The air in the picture at left is squeezed into a
thinner
layer than in the picture at right. The air density in the left
layer is higher than in the layer at right.
By carefully analyzing this figure we have proved to ourselves
that the
rate of pressure decrease
with altitude is higher in high density air than in lower
density air.
This is a fairly subtle but important concept. This concept
will come up 2 or 3 more times later in the semester. For
example, this concept partly explains why hurricanes can intensify and
get as
strong as they do.
Mercury
barometers are used to measure atmospheric pressure. A mercury
barometer is really just a balance that can be used to weigh the
atmosphere. A basic understanding of how a mercury barometer
works is something that every college graduate should have.
You'll find most of what follows on p. 29 in the
photocopied Class Notes.
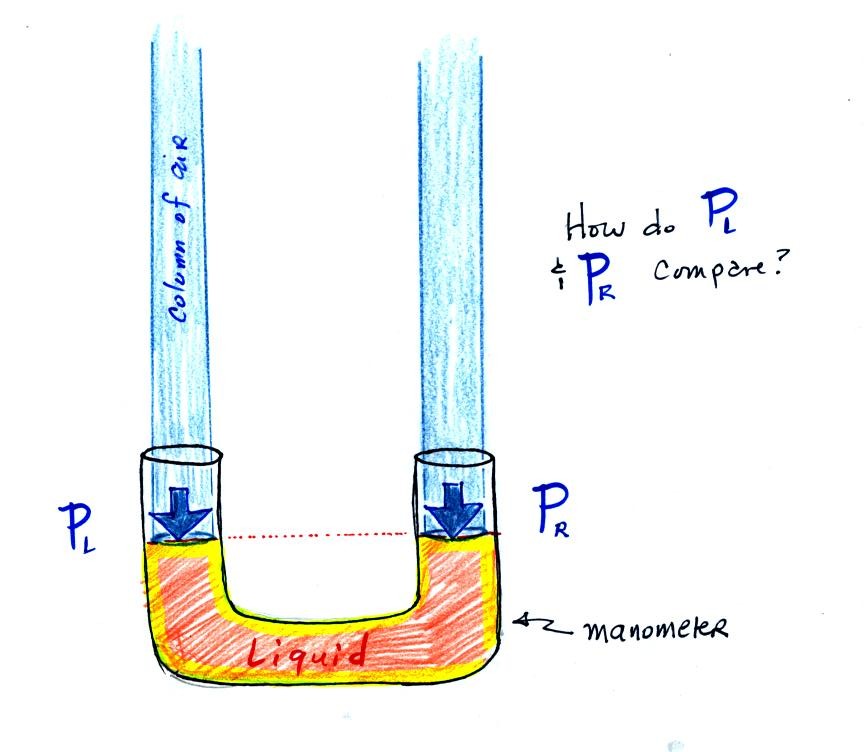
The instrument above ( a u-shaped
glass
tube filled with a
liquid of some kind) is a manometer and can be used to measure pressure
difference. The
two ends of the tube are open so that air can get inside and air
pressure can press on the liquid. Given that the liquid levels on
the two sides of the manometer
are equal, what could you about PL and PR?
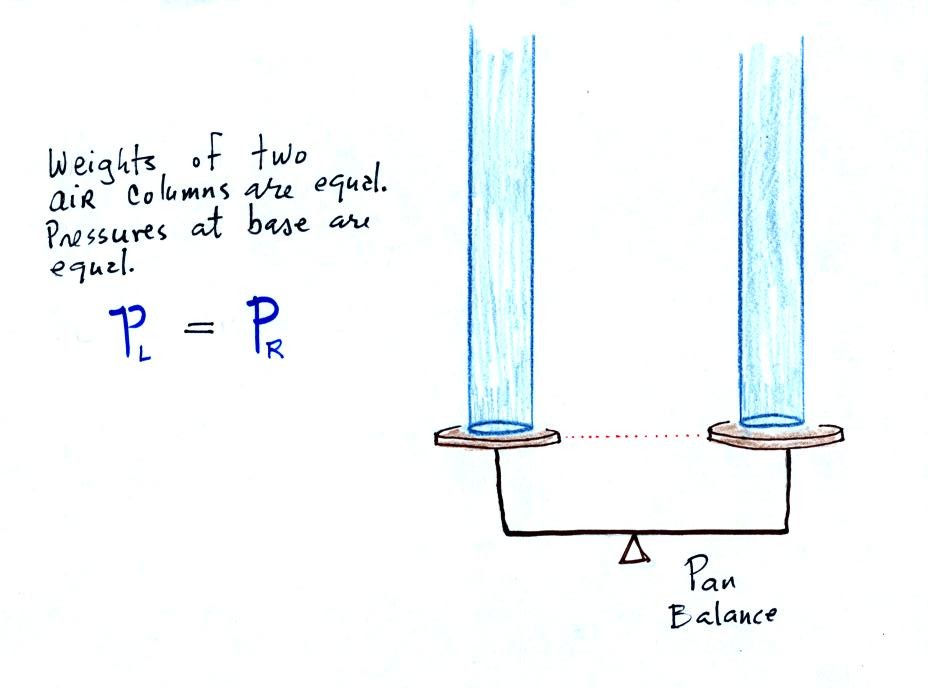
The liquid can slosh back and
forth just like the pans on a balance can move up and down. A
manometer really behaves just like a pan balance.
PL and PR
are equal (note
you don't really know what either pressure is just that they are equal).
Now the situation is a little
different,
the
liquid levels
are no
longer equal. You probably realize that the air pressure on the
left, PL, is a little higher than the air pressure on the
right,
PR. PL is now being balanced by PR
+ P acting together. P
is the pressure produced by the weight of the extra fluid on the right
hand side of
the manometer (the fluid that lies above the dotted line). The
height of the column of extra
liquid provides a measure of the difference between PL and PR.
Next we will just go and close off
the right hand side of the
manometer.
Air pressure can't get into the
right tube any
more. Now at the level of the dotted line the balance is between
Pair and P (pressure by the extra liquid on the
right). If
Pair
changes, the height of the right column, h, will
change. You now have a barometer, an instrument that can measure
and monitor the atmospheric pressure. (some of the letters were cut off
in the upper right portion of the figure, they should read "no air
pressure")
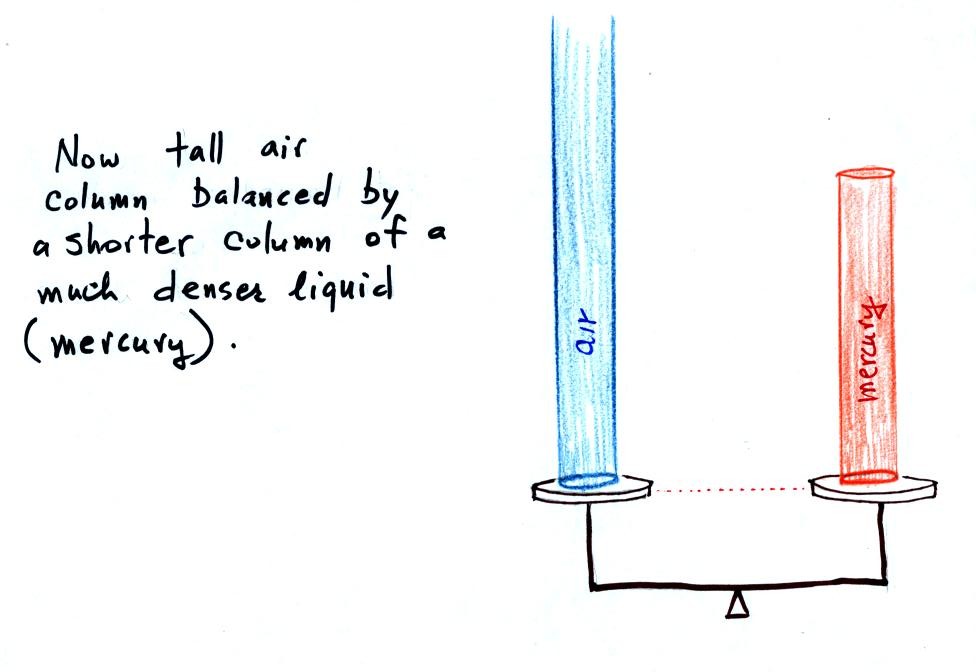
Barometers like this are usually
filled with mercury. Mercury is
a liquid. You need a liquid that can slosh back and forth in
response to changes in air pressure. Mercury is also very dense
which
means the barometer won't need to be as tall as if you used something
like water. A water barometer would need to be over 30 feet
tall. With mercury you will need only a 30 inch tall column to
balance the weight of the atmosphere at sea level under normal
conditions (remember the 30 inches of mercury pressure units mentioned
earlier). Mercury also has a low rate of
evaporation so you don't have much mercury gas at the top of the right
tube (it is the mercury vapor that would make a mercury spill in the
classroom dangerous).
Finally here is a more conventional
barometer design.
The bowl of
mercury is usually covered in such a way that it can sense changes in
pressure but not evaporate and fill the room with poisonous mercury
vapor.
The figure above (p. 30 in the
photocopied Class Notes)
first
shows average sea level pressure values. 1000 mb or 30 inches of
mercury are close enough in this class.
Sea level pressures
usually fall between 950 mb and 1050 mb.
Record high sea level
pressure values occur during cold weather. The TV weather
forecast will often associated hot weather with high pressure.
They are generally referring to upper level high pressure (high
pressure at some level above the ground) rather than surface pressure.
Record low pressure
values have all been set by intense hurricanes (the record setting low
pressure is the reason these storms were so intense). Hurricane
Wilma in 2005 set a new record low sea level pressure reading for the
Atlantic. Hurricane Katrina had a pressure of 902 mb.
The following table lists some of the information on hurricane strength
from p. 146a in the photocopied ClassNotes. 3 of the 10 strongest
N. Atlantic hurricanes occurred in 2005.
Most
Intense North Atlantic Hurricanes
|
Most
Intense Hurricanes to hit the US Mainland
|
Wilma
(2005) 882 mb
Gilbert (1988) 888 mb
1935 Labor Day 892 mb
Rita (2005) 895 mb
Allen (1980) 899
Katrina (2005) 902
|
1935
Labor Day 892 mb
Camille (1969) 909 mb
Katrina (2005) 920 mb
Andrew (1992) 922 mb
1886 Indianola (Texas) 925 mb
|
Air pressure is a force that pushes
downward, upward, and
sideways.
If you fill a balloon with air and then push downward on it, you can
feel the air in the balloon pushing back (pushing upward). You'd
see the air in the balloon pushing sideways as well.
The air
pressure in the four tires on your automobile pushes down on the road
(that's something you would feel if the car ran over your foot) and
pushes upward
with enough force to keep the 1000 or 2000 pound vehicle off the
road.

A "people pyramid" might help you
to understand what is going on in the atmosphere.
If the bottom person in the stack above were standing on a scale, the
scale would measure the total weight of all the people in the
pile. That's analogous to sea level pressure being determined by
the weight of the atmosphere above. The bottom person in the
picture above must be strong enough to support the weight of all the
people above. That equivalent to the bottom layer of the
atmosphere having enough pressure, pressure that points up down and
sideways, to support the weight of the air above.
In class on Friday we used a stack of bricks to try to understand
that
pressure at any level in the atmosphere is determined by the weight of
the air overhead. Now we will imagine a stack of matresses
to
understand why air density decreases with increasing altitude.

Mattresses are
compressible. The mattress at the
bottom of the
pile is compressed the most by the weight of all the mattresses
above. The mattresses higher up aren't squished as much because
their
is less weight remaining above.
In the case of the atmosphere layers of air behave in just the
same way
as matresses.
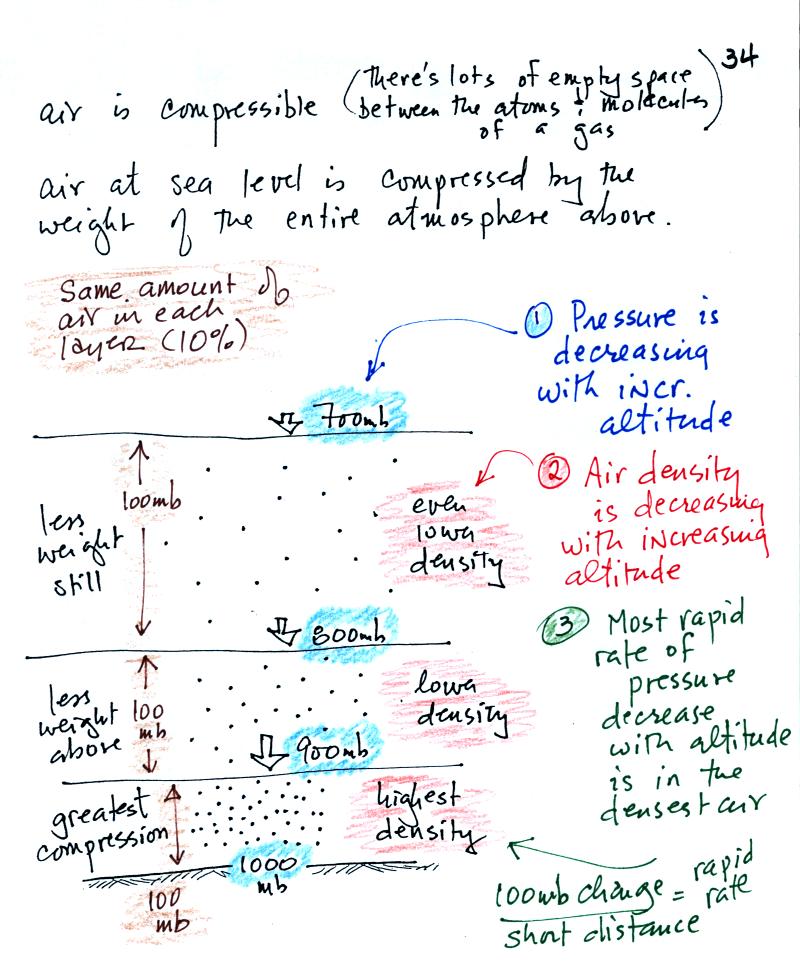
There's a lot of information in
this figure. It is worth
spending a minute or two looking at it and thinking about it.
1. You can first notice and remember that pressure
decreases
with increasing altitude. 1000 mb at the bottom decreases to 700
mb at the top of the picture.
Each layer of air contain the same amount (mass) of air. You
can
tell because the pressure decrease as you move upward through each
layer is the same (100 mb). Each layer contains 10% of the air in
the atmosphere.
2. The densest air is found in the bottom
layer. That is because each layer has the same amount of air
(same mass). The bottom layer is compressed the most and has the
smallest volume. Mass/( small volume)
gives a high density. The top layer has the same amount of air
but about twice the volume. It therefore has a lower density.
3. You again notice something that we covered earlier: the most
rapid
rate of pressure decrease with increasing altitude is in the densest
air in the bottom air layer. It takes almost twice the distance
for pressure to decrease from 800 mb to 700 mb in the top most layer
where the air density is low.
Class
concluded with a demonstration of the upward force
caused by air
pressure.
The demonstration is summarized on p. 35a in the photocopied Classnotes.
Here's a little bit more detailed and more complete explanation of
what is going on. First the case of a water balloon.
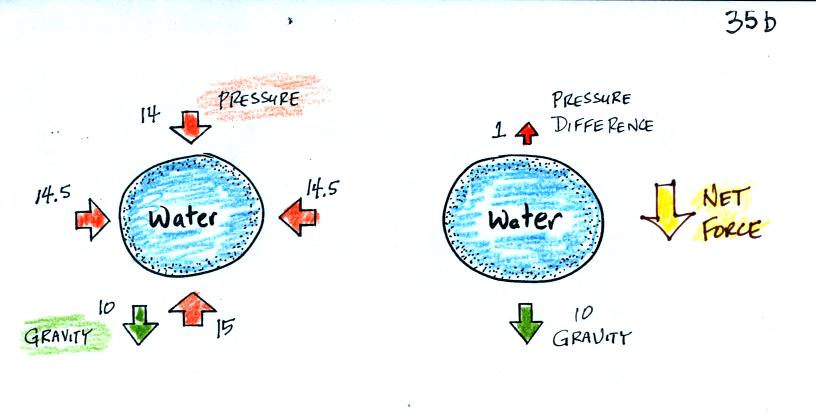
In the demonstration a wine glass is filled with water. A small
plastic lid is used to cover the wine glass. You can then turn
the glass upside down without the water falling out. (Thursday
was one of those nothing goes right days in the Sect. 3 class - I broke
the glass before even starting the demonstration).

The demonstration was repeated using a 4 Liter flash (more than a
gallon of water, more than 8 pounds of water). The upward
pressure force was still able to keep the water in the flask (much of
the weight of the water is pushing against the sides of the flask which
the instructor was supporting with his arms).


