Tuesday Dec. 1, 2009
the easy to print version might appear over the weekend.
Answers
to the most recent Optional Assignment
Sorry
about the delay in getting today's notes online. Hopefully
the material is in roughly the same order as we covered it in class.
We will
spend today's class on Hurricanes. This will be the final
topic
that we cover this semester. There won't be any questions about
hurricanes on this weeks quiz but there will be some questions on the
final exam.
A good place to begin is to compare hurricanes (tropical cyclones)
with
middle latitude storms (extratropical cyclones). To
speed things up, I'm borrowing some of the figures below from a
previous semester. The figures may differ slightly from those
drawn in class.
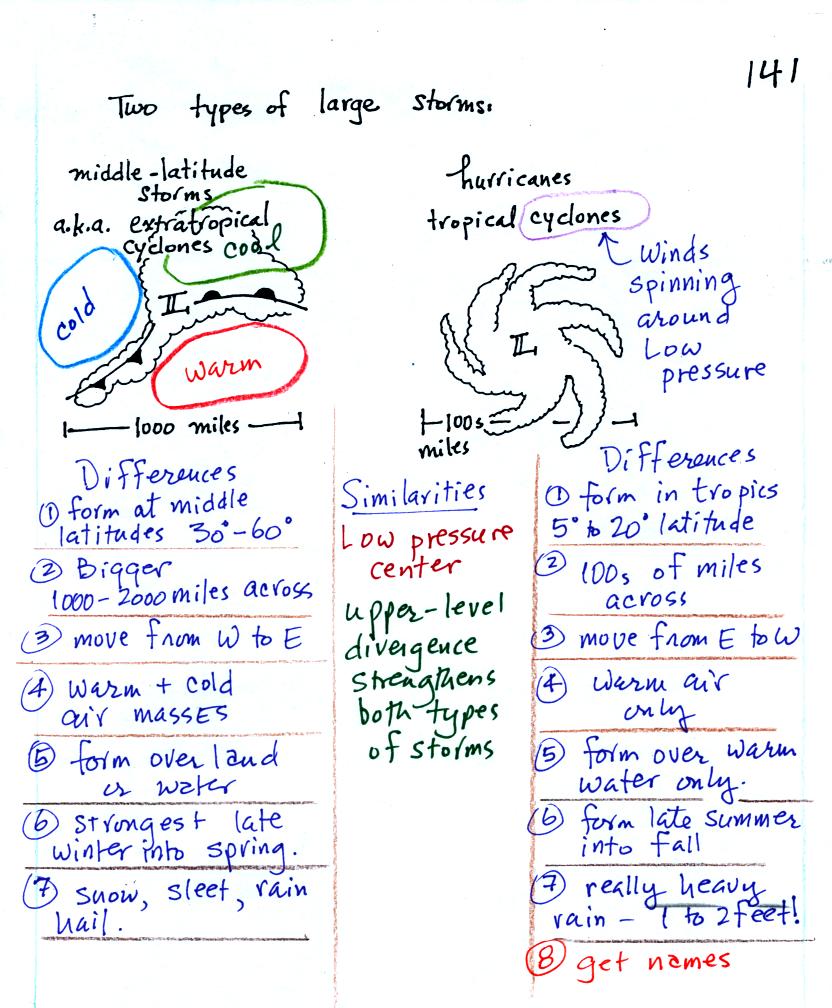
Hurricanes and middle latitude
storms have a couple of characteristics in common:
a. they both form around surface centers of
low pressure (that is why the term cyclone appears in the names of both
types of storms). Upper level divergence can
lower the surface pressure
which then can cause both types of storms to intensify.
1,2. Middle latitude storms (MLS) form at middle latitude (between
30 and 60 degrees latitude) and are generally bigger than
hurricanes. A large middle latitude storm might cover half of the
United States. Hurricanes form in the tropics, a big hurricane
might fill the Gulf of Mexico.
3. MLS form in the prevailing westerly wind belt and move from west to
east. Hurricanes form in the trade winds and move from east to
west.
4,5. MLS can form over land or water. Fronts separate warm, cold,
and cool air masses. Hurricanes only form over very warm ocean
water and are made entirely of warm moist air.
6. The strongest middle latitude storms form in the
winter and
early
spring. Peak hurricane activity occurs in the late summer into
the fall.
7. MLS can produce a variety of different types
of precipitation. Hurricanes mostly just produce very large
amounts of rain. Hurricanes do contain thunderstorms so hail and
graupel as also possible.
8. Hurricanes receive names (when they reach tropical storm
strength). The names now alternate male and female. The
names of particularly strong or deadly hurricanes (such as Katrina) are
retired, otherwise the names repeat every 6 years.
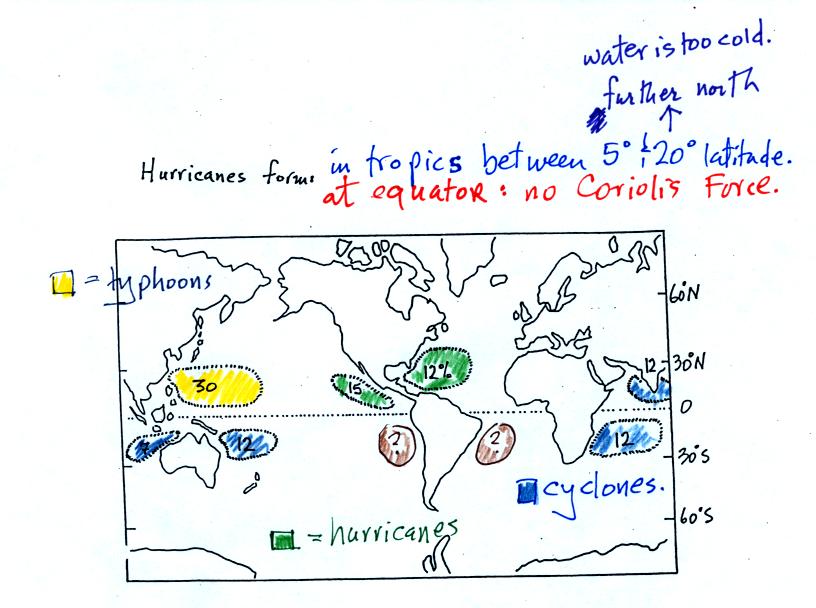
The figure above shows
the relative frequency of
tropical cyclone
development in different parts of the world.
The name hurricane, cyclone, and typhoon all refer to the same type of
storm (tropical cyclone is a general name that can be used
anywhere). In most years the ocean off the coast of SE Asia is
the
world's most active hurricane zone. Hurricanes are
very rare off
the east
and west coasts of South America.
Hurricanes form between 5 and 20 degrees latitude,
over warm ocean
water, north and south of the equator. The warm
layer of water
must be fairly deep to contain enough energy to fuel a hurricane and so
that turbulence and mixing don't bring cold water up to the ocean
surface. The atmosphere must be unstable so that thunderstorms
can develop. Hurricanes will only form when there is very little
or no vertical wind shear (changing wind direction or speed with
altitude). Hurricanes don't form at the equator because there is
no Coriolis force there (the Coriolis force is what gives hurricanes
their spin and it causes hurricanes to spin in opposite directions in
the northern and southern hemispheres.
Note that more tropical
cyclones form off the
west coast of the US than
off the east coast. The west coast hurricanes don't generally get
much attention, because they move away from the coast and usually
don't
present a threat to the US (except occasionally to the state of
Hawaii). The moisture from these storms will
sometimes be pulled up into the southwestern US where it can lead to
heavy rain and flooding.

Hurricane season in the Atlantic
officially runs from
June 1 through to November 30. The peak of hurricane season is in
September. In 2005, an unusually active hurricane season in the
Atlantic, hurricanes continued through December and even into January
2006. Hurricane season in the Pacific begins two weeks earlier on
May 15 and
runs through Nov. 30.
Some kind
of meteorological process that produces low
level
convergence
is needed to initiate a hurricane. One possibility, and the one
that fuels most of the strong N. Atlantic hurricanes, is an "easterly
wave." This is just a "wiggle" in the wind flow pattern.
Easterly waves often form over Africa or just off the African coast and
then travel toward the west across the N. Atlantic. Winds
converge as they approach the wave and then diverge once
they are
past it . The convergence will cause air to rise and
thunderstorms
to begin to develop.
In an average year, in the N.
Atlantic, there will be 10 named
storms
(tropical storms or hurricanes) that develop during hurricane
season. 2005 was, if you remember, a very unusual
year. There
were 28 named storms in the N. Atlantic in 2005. That beat the
previous record of 21 names storms that had been set in 1933. Of
the 28 named storms, 15 developed into hurricanes.
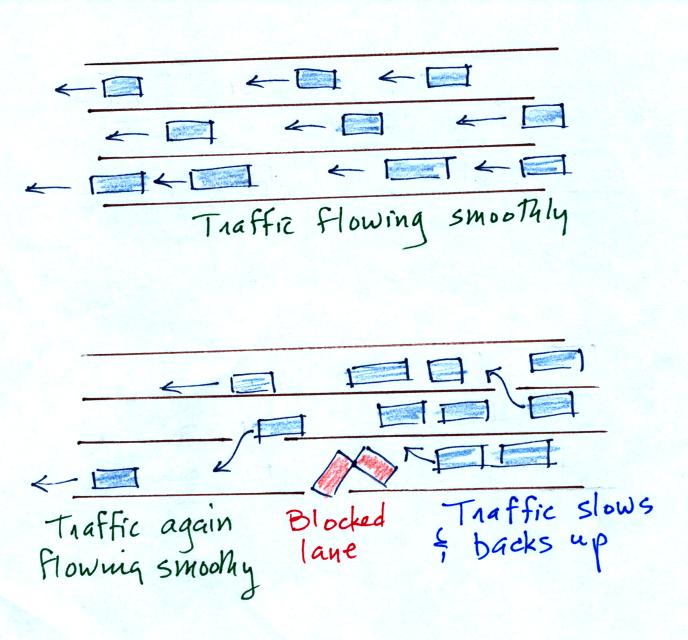
In some ways winds blowing through an easterly wave resembles
traffic
on a multi-lane highway. Traffic will back up as it approaches a
section of the highway with a closed lane. Once through the
"bottleneck" traffic will begin to flow more freely.
Another process that causes surface
winds to converge is a "lee side low."
This figure tries to explain how a
cluster of thunderstorms can organize and intensify into a hurricane.

1. Converging surface winds pick
up heat and moisture from the ocean. These are the two mains
sources of energy for the hurricane.
2. Rising air cools and thunderstorm clouds form. The
release of latent heat during condensation warms the atmosphere.
The core of a hurricane is warm.
3. Pressure decreases more slowly with increasing altitude
in the warm core of the hurricane. The result is that pressure at
the top center of the hurricane is higher than the pressure at the top
edges of the hurricane (pressure at the top center is still lower than
the
pressure at the bottom center of the hurricane). Upper levels
winds diverge and spiral outward
from the top center of the hurricane.
4. The upper level divergence will cause the surface
pressure at the center of the hurricane to decrease. The speed of
the converging surface winds increases
and the storm intensifies. The converging winds pick up
additional heat and moisture which warms the core of the hurricane even
more. The upper level high pressure and the upper level
divergence increase. The increased divergence lowers the surface
pressure even more.
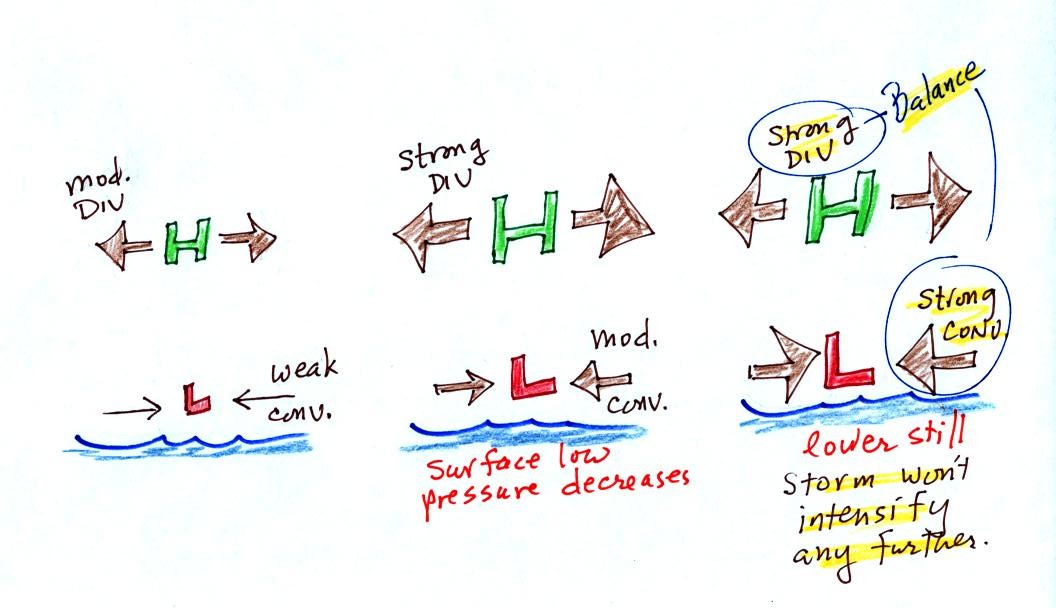
Here's another illustration of hurricane intensification
In the figure at left the upper level divergence is stronger than the
surface convergence. The surface low pressure will
decrease. The decrease in surface pressure will cause the
converging surface winds to blow faster.
In the middle picture, the surface low pressure is lower, the surface
convergence is stronger. The upper level divergence has also been
strengthened a little bit. The upper level divergence is still
stronger than the surface convergence so the surface low pressure will
decrease even more.
In the right figure the surface low pressure has decreased enough that
the surface convergence now balances the upper level divergence.
The storm won't strengthen any more.
Generally speaking the lower the surface pressure at the center of a
hurricane the stronger the storm and the faster the surface winds will
blow.
This figure tries to show the relationship between surface
pressure and surface wind speed. The world record low
sea level pressure reading, 870 mb, was set
by Typooon Tip off the SE Asia coast in 1979. Sustained winds in
that storm were 190
MPH. Three 2005 Atlantic hurricanes: Wilma, Rita, and Katrina had
pressures in the 880 mb to 900 mb range and winds ranging from 170 to
190 MPH.
At some point during today's class
we watched a
20
minute segment from a NOVA program (PBS network) on hurricanes was
shown. A film crew was on board a NOAA
reconnaissance plane as it flew into the narrow eye of hurricane
GILBERT. Gilbert set the record low sea level pressure reading
for the Atlantic ocean (888 mb). That record stood until the 2005
hurricane season when WILMA set a new record of 882 mb. The world
record low sea level pressure, 870 mb, was set in a SE Asian typhoon in
1979.
Here are some of the comments written down during the video (these
were
on the back of the handout distributed in class. We
will review the Saffir Simpson scale in class on Friday and look at
the 3-dimensional structure of hurricanes in more detail.

One of the most distinctive
features of a hurricane is the clear eye in the center. The eye
is produced by sinking air. Once in the eye, the people in the
NOAA plane where able to see blue sky when they looked and and saw the
ocean surface when they looked down. The eye of a hurricane is
something that very few people will ever see. The eye is
surrounded by the eye wall, a ring of strong thunderstorms.
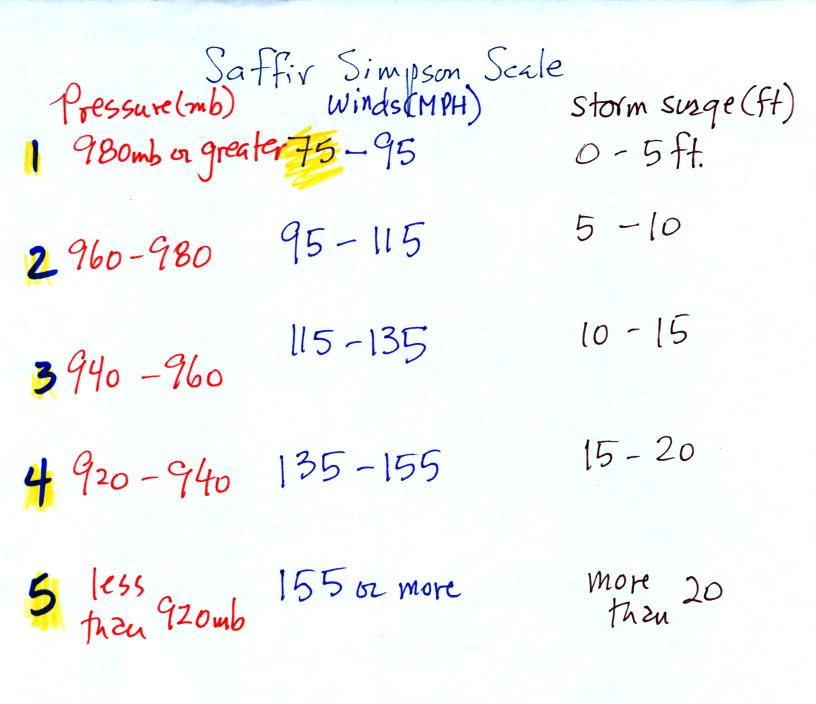
The Saffir simpson
scale is used to rate hurricane intensity or damage potential.
We'll talk more about hurricane damage in class on Friday.
The stages
of storm development that lead up to a hurricane are shown
at the bottom of p. 143a in the photocopied ClassNotes.
A tropical disturbance is just a localized cluster of thunderstorms
that a meterologist might see on a satellite photograph. But this
would merit observation because of the potential for further
development. Signs of rotation would be evidence of organization
and the developing storm would be called a tropical depression.
In order to be called a tropical storm the storm must
organize a little
more, and winds must
increase to 35 knots. The storm receives a name at this
point. Finally when winds exceed 75 MPH (easier to remember than
65 knots or 74 MPH) the storm becomes a hurricane.

A crossectional view of a mature
hurricane (top) and a
picture
like you might
see on a satellite photograph (below).
Sinking air in the very center of a hurricane produces the clear
skies
of the eye, a hurricane's most distinctive feature. The eye is
typically a few 10s of miles across, though it may only be a few miles
across in the strongest hurricanes. Generally speaking the
smaller the eye, the stronger the storm.
A ring of strong thunderstorms, the eye wall, surrounds the
eye.
This is where the hurricane's strongest winds are found.
Additional concentric rings of thunderstorms are found as you move
outward from the center of the hurricane. These are called rain
bands. These usually aren't visible until you get to the outer
edge of the hurricane because they are covered by high altitude layer
clouds.
The Saffir-Simpson scale is used to rate hurricane intensity (just
as the Fujita scale is used with tornadoes).
A simplified version of the Saffir-Simpson scale is shown
above.
Pressure decreases by 20 mb, wind speeds increase by 20 MPH, and the
height of the storm surge increases 5 feet for every increase in Saffir
Simpson Scale rating. You don't need to remember all the
numbers. Just remember that there are 5 categories on the scale,
category 1 is the weakest. Hurricane winds must be over 75 MPH
for the storm to be called a hurricane.
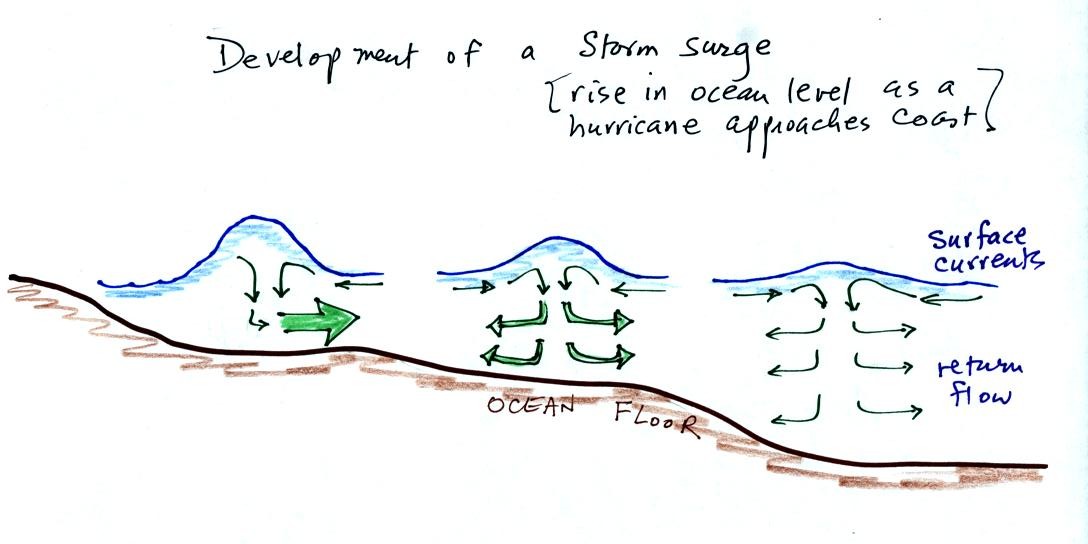
The
following figure shows how a storm surge develops as a hurricane comes
onshore.
Out at sea,
the converging surface
winds
create
surface
currents
in the
ocean that transport water toward the center of the hurricane.
The rise in ocean level is probably only a few feet, though the waves
are much larger. A return flow develops underwater that carries
the water back to where it came from.
As the hurricane approaches shore, the
ocean becomes
shallower.
The return flow must pass through a more restricted space. A rise
in ocean level will increase the underwater pressure and the return
flow will speed up. More pressure and an even faster return flow
is needed as the hurricane gets near the coast.
Here is a link to the storm surge website
(from the Hurricane Research Division of the Atlantic Oceanographic and
Meteorological Labororatory). It has an interesting animation
showing output from the SLOSH model used to predict hurricane storm
surges and the flooding they can cause.
We watched another short video at the end of class. It mostly
described the arrival of Hurricane Camille along the Mississippi coast
in 1969. Camille is the 2nd most intense hurricane to hit the US
(see p. 146a in the photocopied
ClassNotes)
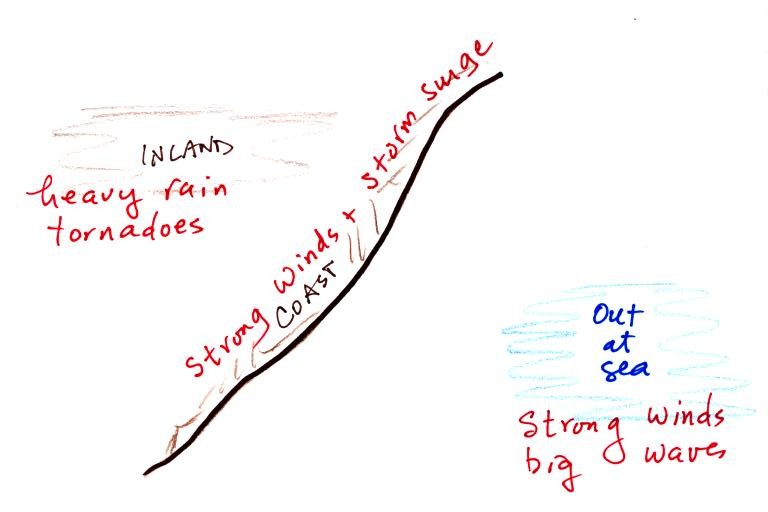
The storm
surge
probably causes the most hurricane damage along a coastline.
Further out at sea strong winds and high seas are the biggest
hazard. Once a hurricane moves onshore it weakens very rapidly
(friction slows the winds and the hurricane is cut off from its supply
of moisture). However very heavy rains, thunderstorms and
tornadoes can remain a threat over a large area for days to come.
The
following information is just for informational purposes, you
don't need to remember all these details.
The 2005 hurricane season (the year Hurricane Katrina hit New Orleans)
was unusual in many respects.
3 of the 10 most intense Atlantic hurricanes
ever
( Wilma, Rita, and
Katrina) occurred in 2005 (you'll find the top 10 listed on p. 146a in
the photocopied classnotes). Wilma became the
most intense hurricane of all time in the Atlantic, beating out
Hurricane
Gilbert (1988) which was featured in the video tape segment shown in
class last Friday.
On average there are about 10 named storms (tropical storms and
hurricanes) in the Atlantic per year. Before 2005 the record was
21 storms. There were 28 storms in 2005 which blew the old record
out of the water.
Katrina was the third most intense hurricane to hit the mainland US and
easily became the most costly natural disaster in US history.
Fortunately none of the 2005 storms came close to becoming the
deadliest
hurricane in US history. That distinction belongs to the 1900 Galveston
hurricane
.