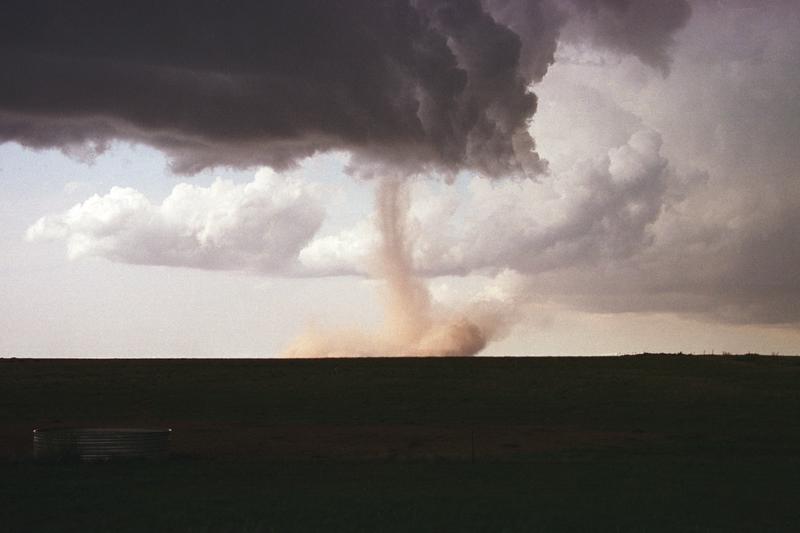
Here's a
pretty nice photograph of a wall cloud and a tornado (
from the University Corporation for Atmospheric
Research ).
Class
started (I believe) with a
simple demonstration that I wasn't able to do last Tuesday. The
demonstration will give you an idea of what a microburst might
look
like.
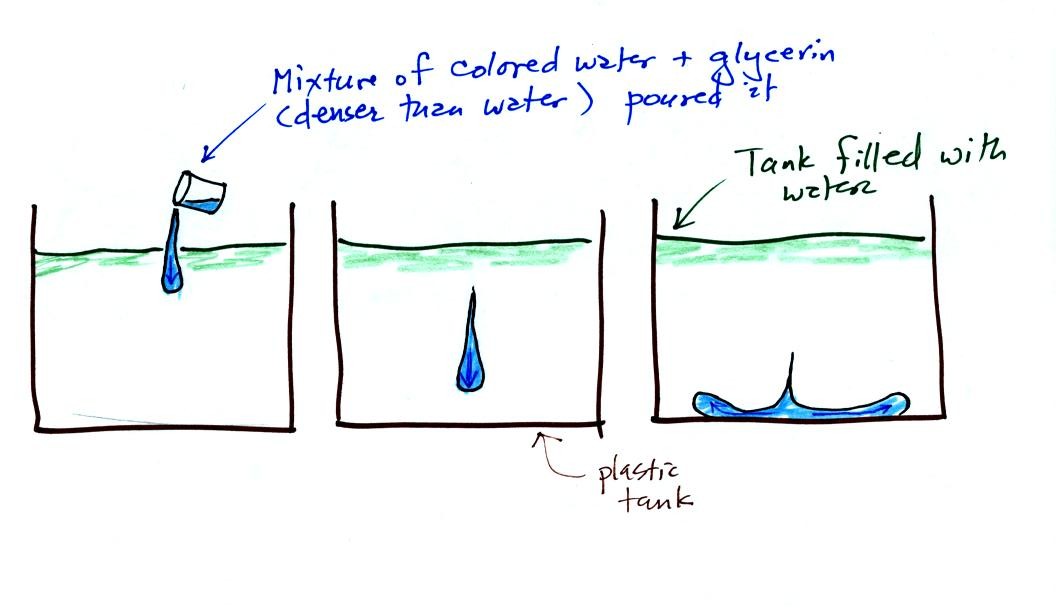
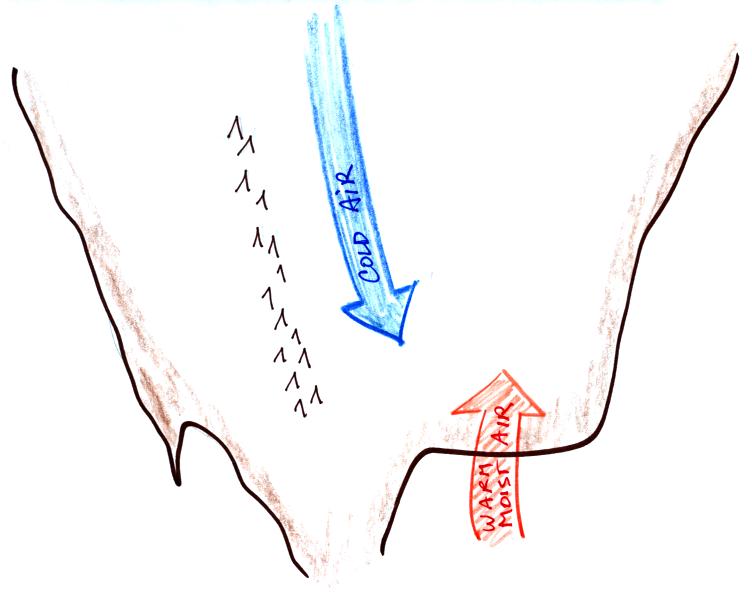
A large plastic
tank was filled
with water, the water represents air in the
atmosphere. Then a colored mixture of water and glycerin, which
is a
little denser than water, was poured into the tank. This
represents the
cold dense air in a thunderstorm downdraft. The colored liquid
sinks to
the bottom of the tank and then spreads out horizontally. In the
atmosphere the cold downdraft air hits the ground and spreads out
horizontally. These are the strong winds that can reach 100 MPH.
The demonstration
was followed by a time-lapse video of an actual microburst that
occurred in the Santa Catalina mountains.
We
discussed the structure of severe thunderstorms in class on
Tuesday. This
seemed like a good place to briefly discuss supercell thunderstorms.
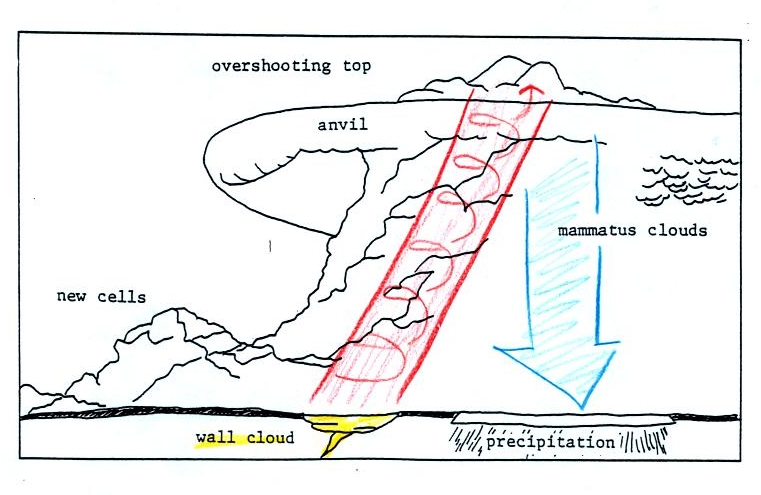
Here is
a
relatively simple
drawing showing some of the key features on a supercell
thunderstorm. In a supercell the
rotating
updraft (shown in red above) is strong enough to penetrate into the
stratosphere. This produces the overshooting top or dome feature
above. A wall cloud and a tornado are shown at the bottom of the mesocyclone. In an ordinary thunderstorm
the updraft
is unable to penetrate into the very stable air in the stratosphere and
the
upward moving air just flattens out and forms an anvil. The
flanking line
is a line of new cells trying to form alongside the supercell
thunderstorm.
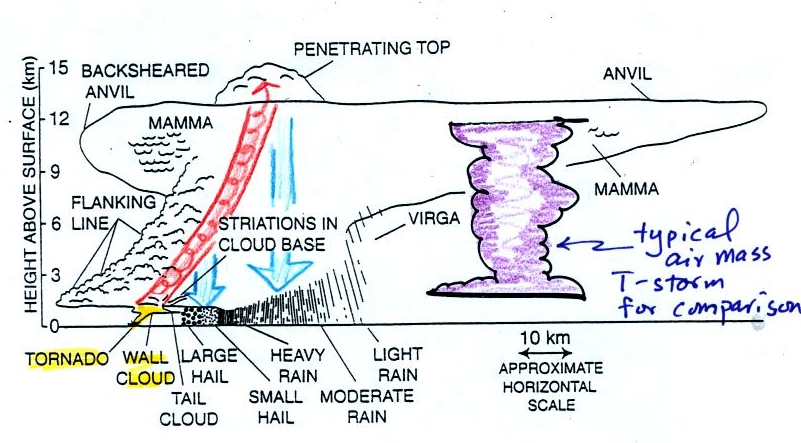
Here
is a second slightly more complicated drawing of a supercell
thunderstorm. A typical air mass thunderstorm (purple) has been
drawn in
for comparison.
A short segment
of video was shown at this point. The video first showed some
good quality video of a close tornado. We will be covering
tornadoes in class on Friday. This was followed by photographs of
a distant supercell thunderstorm and photographs of the bases of nearby
supercell thunderstorms. Here you could see the spectacular wall
cloud that often forms at the base of these storms. Finally a
computer simluation showed some of the complex motions that form inside
supercell thunderstorms, particularly the tilted rotating updraft. Researchers have a pretty good
understanding of how supercell
thunderstorms develop. The exact
process that
initiates tornado development is still unknown, however.
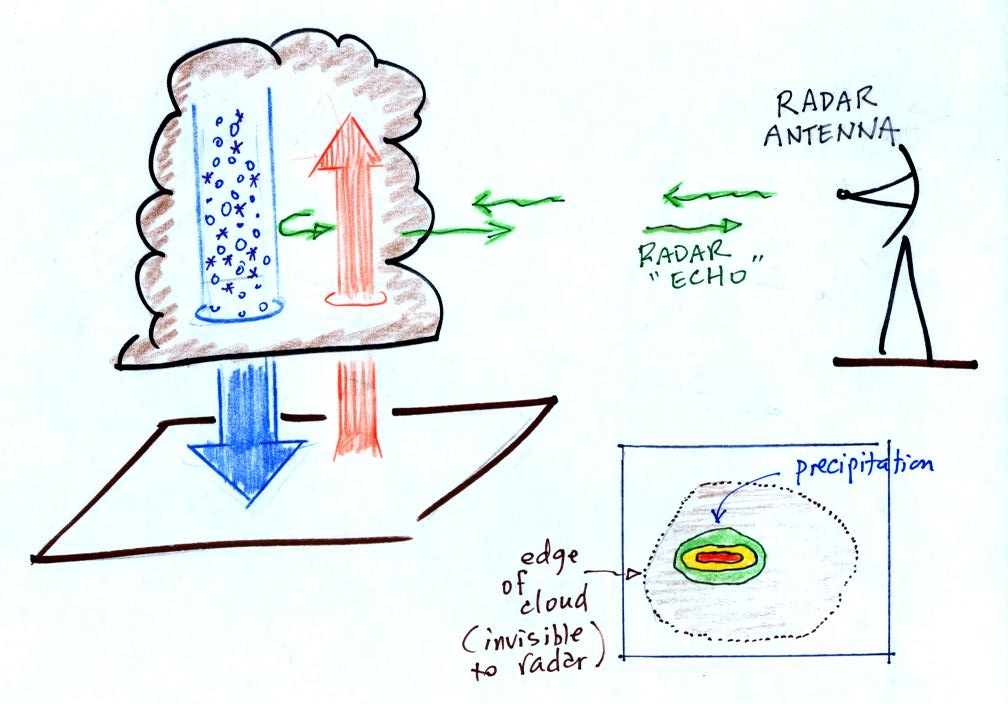
Thunderstorms
with rotating updrafts often have a distinctive radar signature.
We
haven't
discussed weather radar
in this class. In some ways a radar image of a thunderstorm is
like an
X-ray photograph of a human body. The Xrays
pass through the flesh but are partially absorbed by bone.
The radio signals
emitted by radar
pass through the cloud itself but are reflected by the much larger
precipitation particles. The intensity of the reflected signal
(the echo) is color coded. Red means an intense reflected signal
and lots of large precipitation particles. The edge of the cloud
isn't normally seen on the radar signal.
Thunderstorms
with rotating
updrafts produce a very characteristic hook shaped echo on radar.
Here
are a couple of examples:
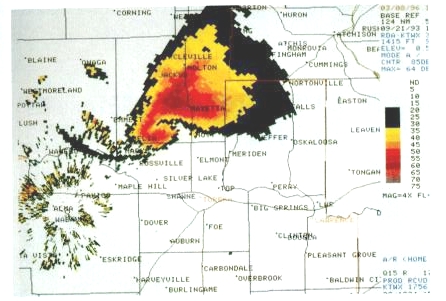
The
colors provide an idea of precipitation intensity (red is the
heaviest
precipitation).
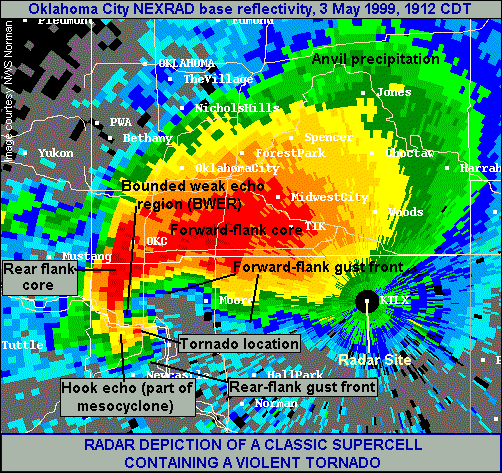
This is the radar image of a very strong tornado
that hit Oklahoma
City in May
1999
. The hook echo is visible near the lower left hand
corner of the picture. A very strong tornado. It is
possible that winds in the tornado may have exceeded 300 MPH.