Monday Dec. 6, 2010
A couple of songs from the Royal Crown Revue
("Hey Pachuco" and "The Walkin' Blues")
Everything in my possesion as of last Friday has been graded and
was returned in class today together with grade summaries.
The course evaluation was conducted at the beginning of class today.
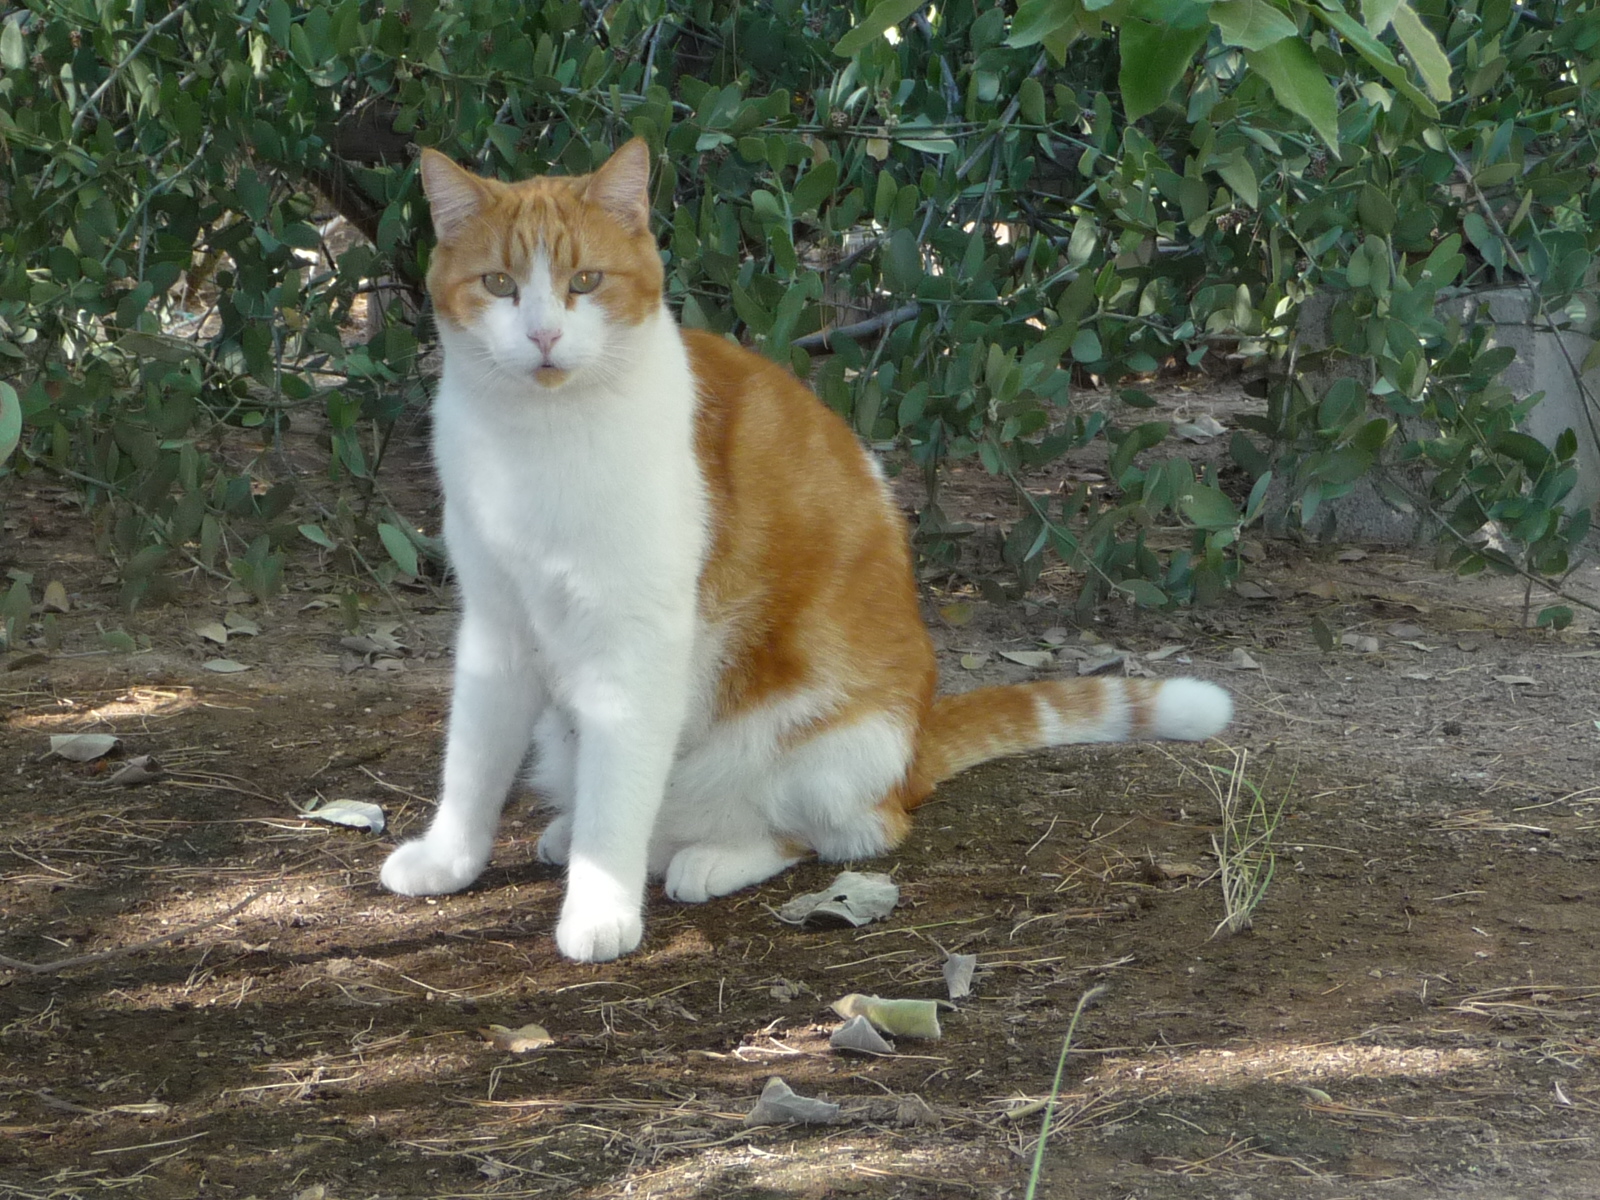
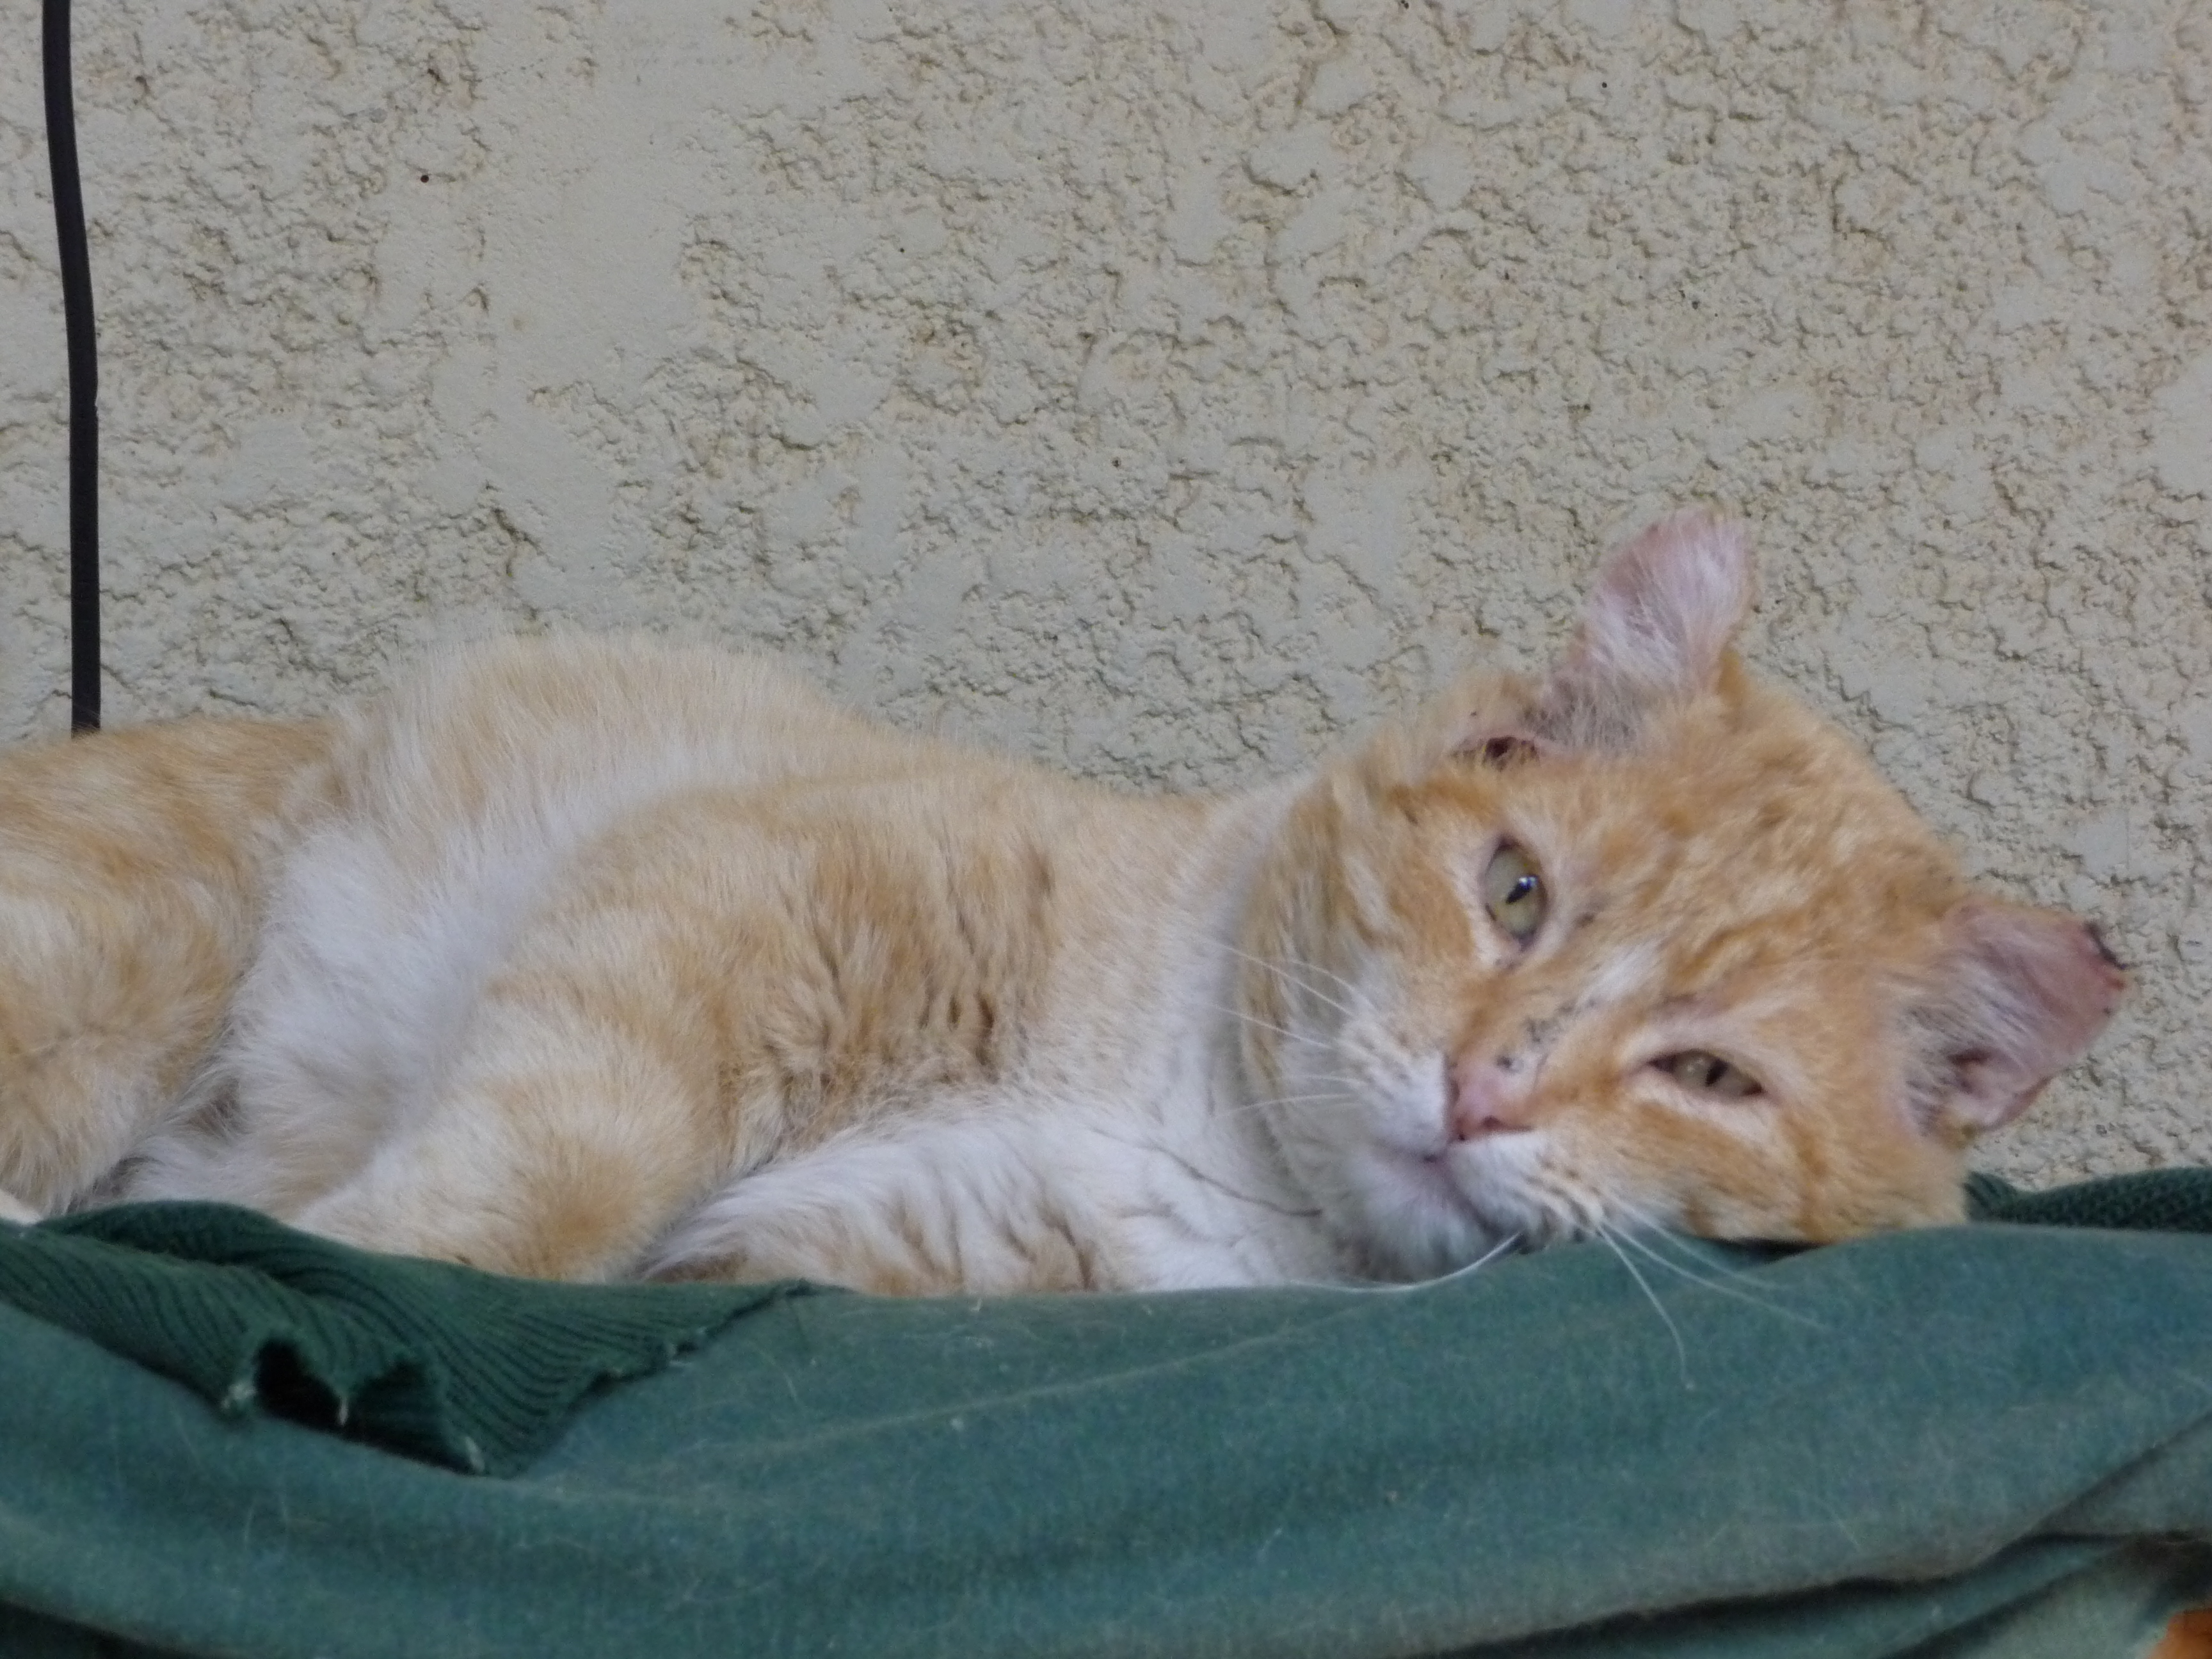
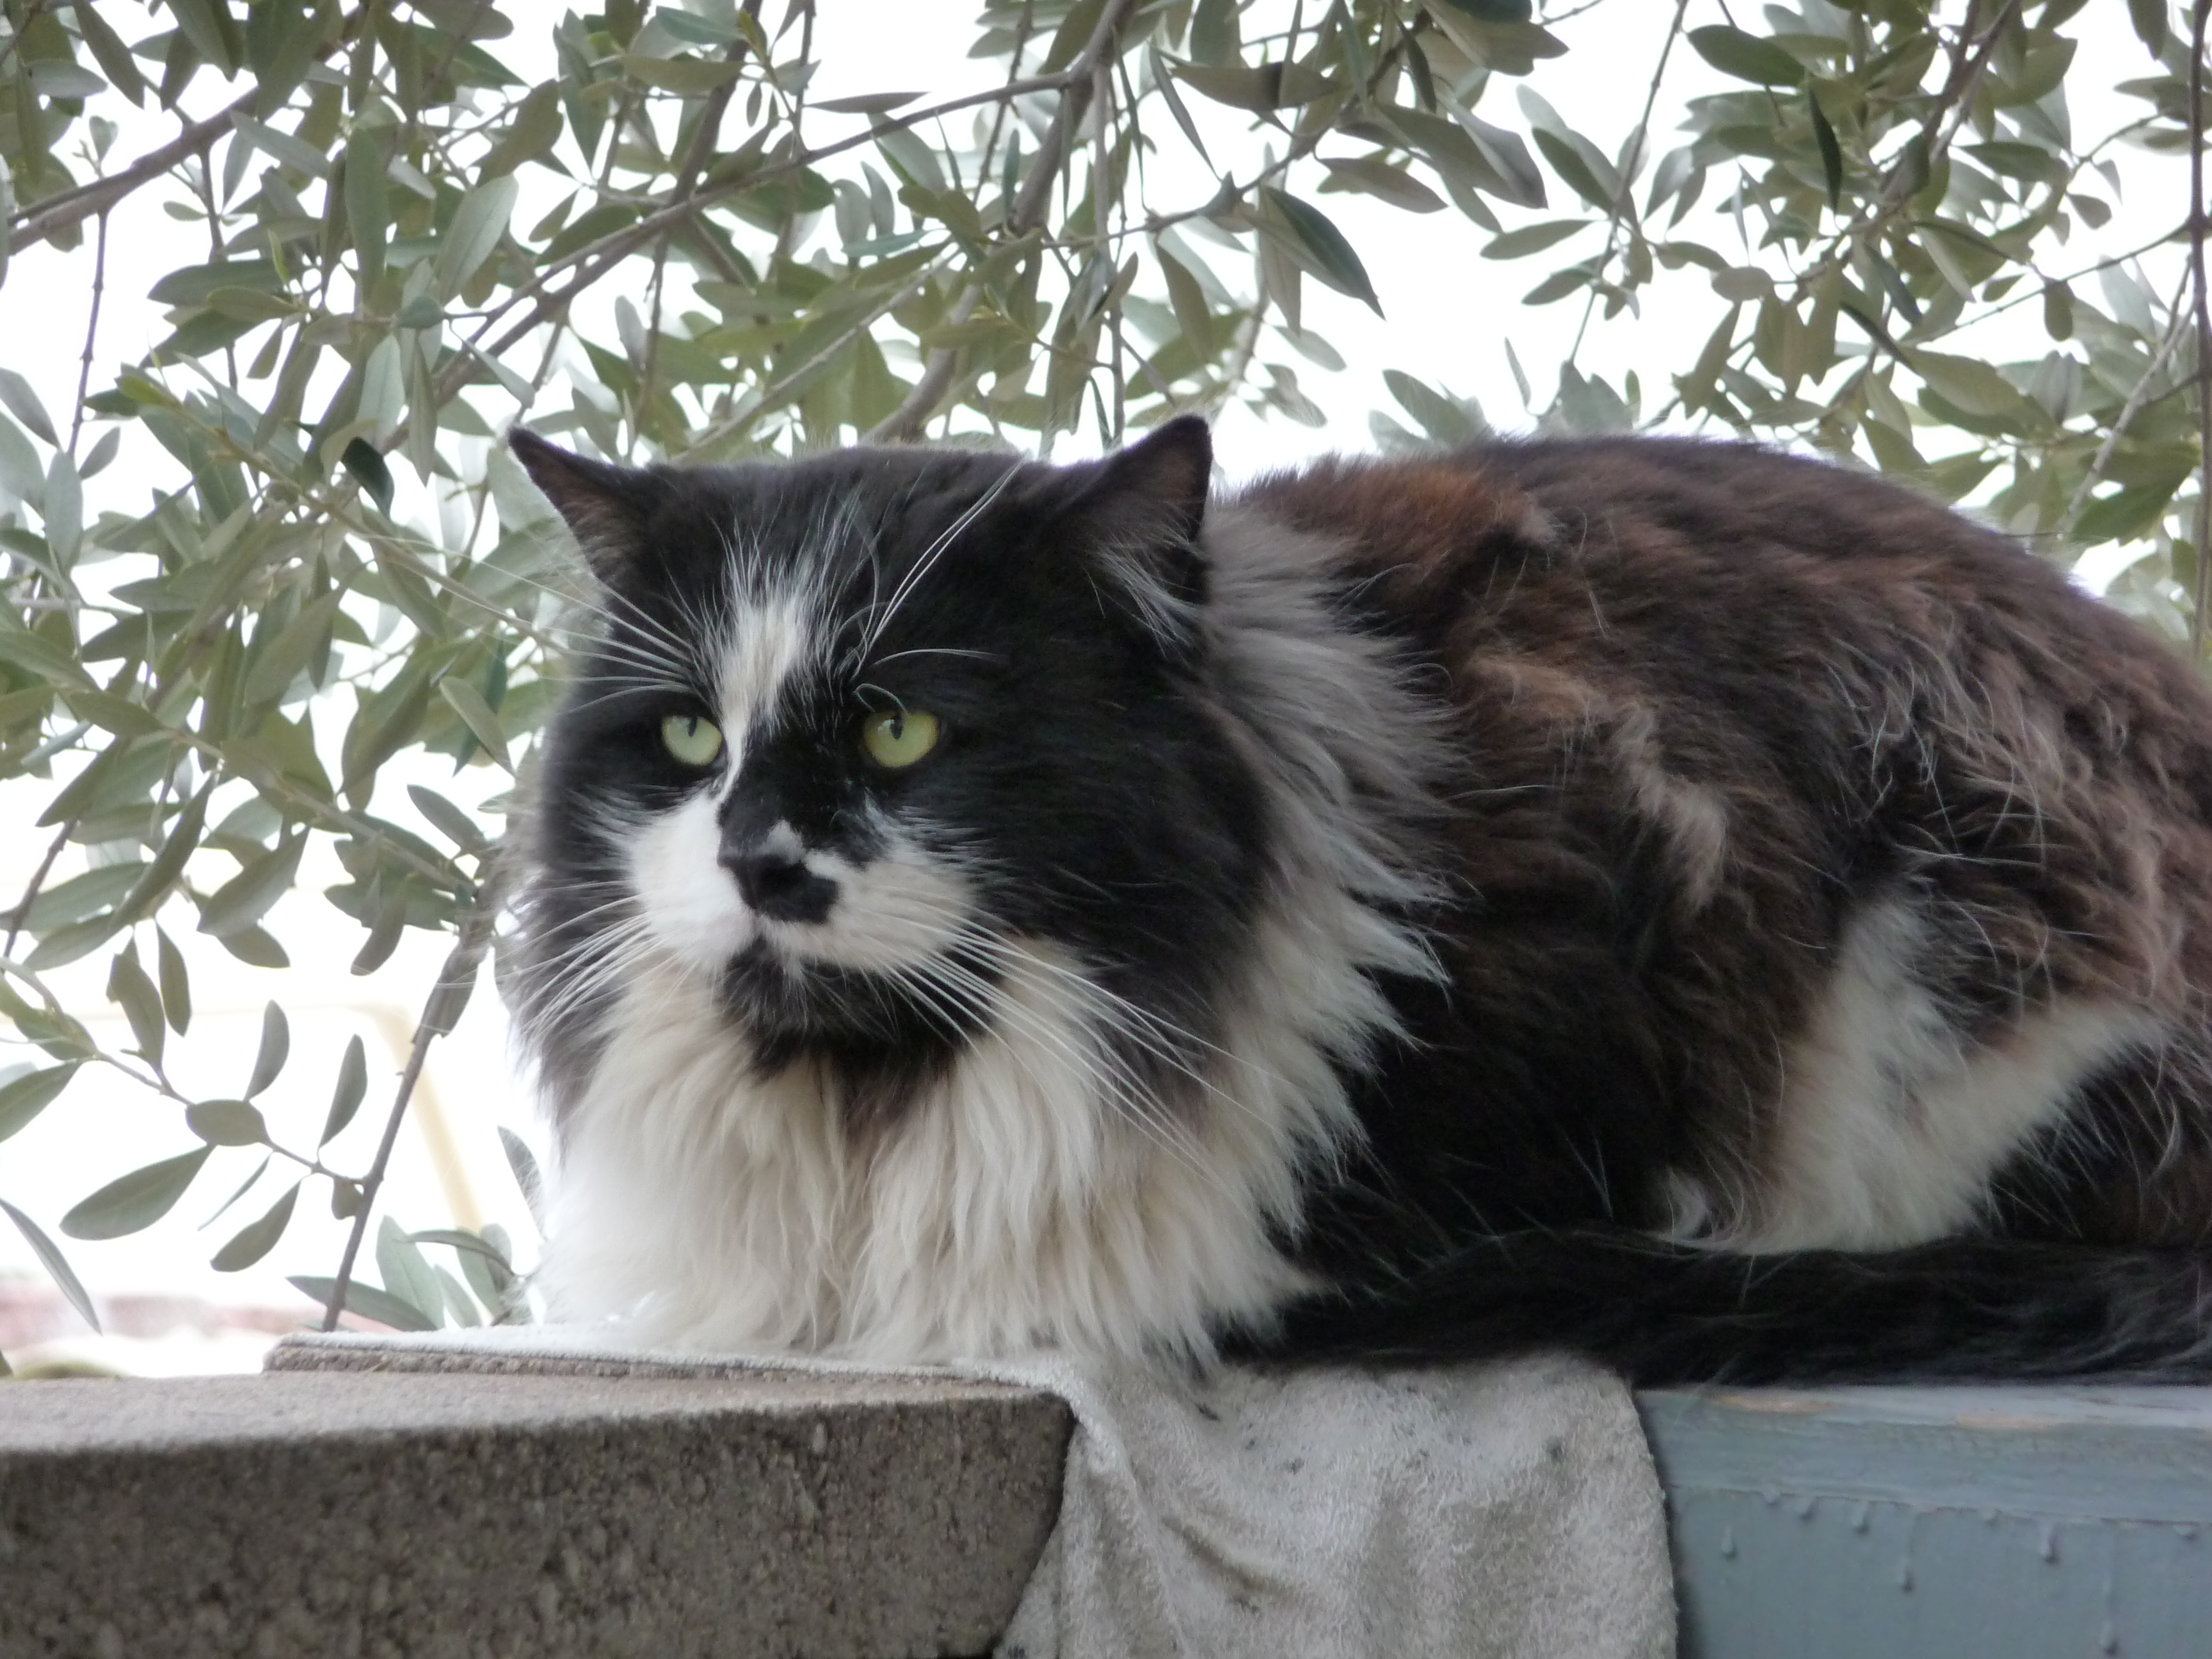
Today's pictures of the day. Clockwise from
upper left:
Fox, Rajah, stray cat #1, stray cat #2
And there was a very small amount of material on hurricanes that
we finished up in class today.
Hurricanes
are, of course, very destructive.
The Saffir-Simpson scale is used to rate hurricane intensity (just
as the Fujita scale is used with tornadoes).
A simplified version of the Saffir-Simpson scale is shown
above.
Pressure decreases by 20 mb, wind speeds increase by 20 MPH, and the
height of the storm surge increases 5 feet for every increase in Saffir
Simpson Scale rating. You don't need to remember all the
numbers. Just remember the name of the scale, and that there are
5 categories on the scale (category 1 is the weakest). Hurricane
winds must be over 75 MPH
for the storm to be called a hurricane.
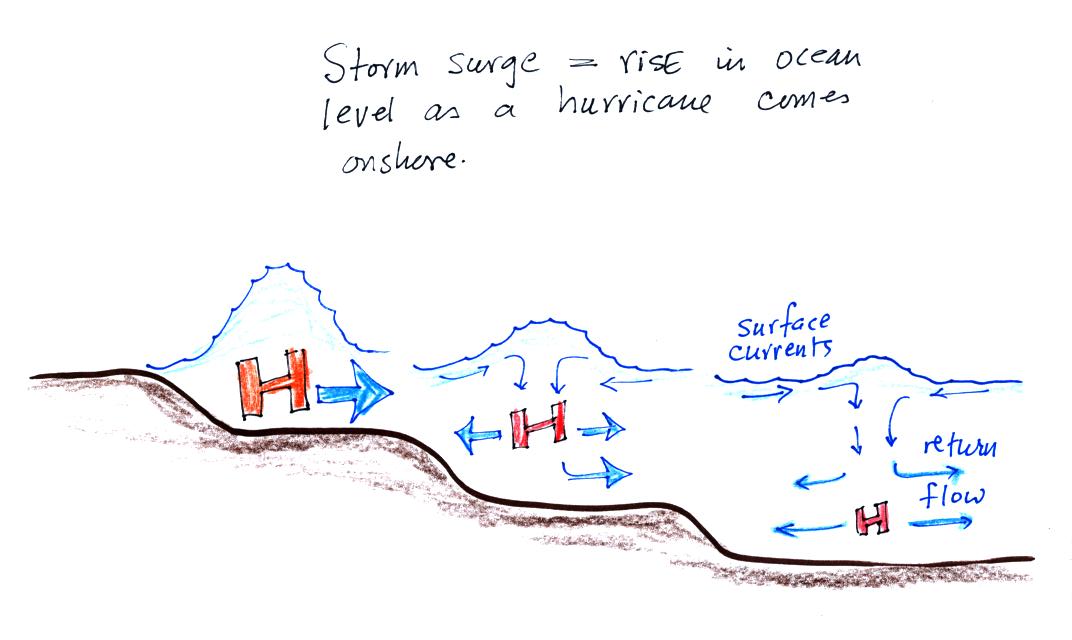
A hurricane storm surge is a rise in ocean level caused when
a hurricane moves onshore. It causes most of the destruction
along a coastline. The
following figure shows how a storm surge develops.
Out at sea,
the converging surface
winds
create
surface
currents
in the
ocean that transport water toward the center of the hurricane.
The rise in ocean level is probably only a few feet, though the waves
are much larger. A return flow develops underwater that carries
the water back to where it came from.
As the hurricane approaches shore, the
ocean becomes
shallower.
The return flow must pass through a more restricted space. A rise
in ocean level will increase the underwater pressure and the return
flow will speed up. More pressure and an even faster return flow
is needed as the hurricane gets near the coast. The rise in ocean
level can be more than 20 feet for a category 5 hurricane.
Here is a link to the storm surge website
(from the Hurricane Research Division of the Atlantic Oceanographic and
Meteorological Labororatory). It has an interesting animation
showing output from the SLOSH model used to predict hurricane storm
surges and the flooding they can cause.
And with that we came to
THE END
of what we will be able to cover in
NATS 101 this semester. In class on Wednesday we will begin
the review for Friday's Final Exam.