Week
#3 Assignment
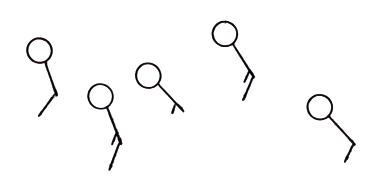
1. Which of the following is not plotted below?
a.
pressure b. dew point
temperature c.
temperature d. relative humidity
2.
Which one of the following does not belong in the same group as the
other three?
a. clockwise
spinning winds b. converging surface
winds c. sinking air d.
clear skies
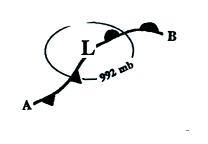
3. The L in the figure stands for
low PRESSURE TEMPERATURE. A is a COLD
WARM front.
4.
A(n) _______ correction is made before pressure measurements are
plotted on a surface weather map.
a.
temperature b.
latitude c. wind
speed d. altitude
5. Clouds can form above surface
centers of HIGH LOW pressure when air
RISES SINKS and COOLS
WARMS.
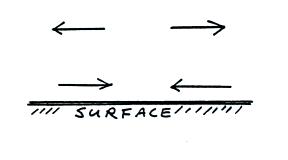
6. Diverging wind motions are shown
at the TOP BOTTOM of the figure below. If the
divergence is stronger than
the convergence, the surface
pressure in the center of the picture will INCREASE
DECREASE remain the SAME.
7.
The winds in the figure below are blowing from the SW
NW SE NE.
8. A strong pressure gradient
would most likely produce
a. rainy
weather b. cold
weather c. strong
winds d. warm weather
9. Generally speaking you
will find PRESSURE HEIGHT contours on a surface
weather map and PRESSURE
HEIGHT contours on an upper level chart.
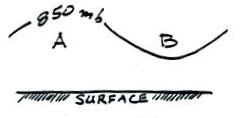
10. Points A and B in the figure below
are at the same altitude. The 850 mb pressure level is
indicated. Point A lies
below an
upper level RIDGE TROUGH. The air at Point A is
WARMER COLDER than at B. The pressure at
Point A
is HIGHER LOWER than at B.
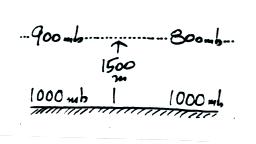
11. The surface pressure data in the
figure below would indicate EQUAL DIFFERENT amounts
of air on each side of
the
picture. The temperatures of the air in the left and right sides
of the figure are EQUAL DIFFERENT. You
would
expect to find an upper level ridge on the RIGHT LEFT
side of the figure.
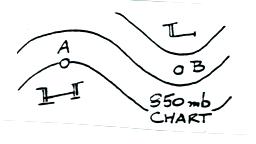
12. If you travel from Point A to
Point B on the upper level chart below, the air temperature will
____________, the
altitude will ____________,
and the pressure will ____________. (fill in each blank
with DECRease, remain the
SAME,
or INCRease)


