Thunderstorms come in different
sizes and levels of
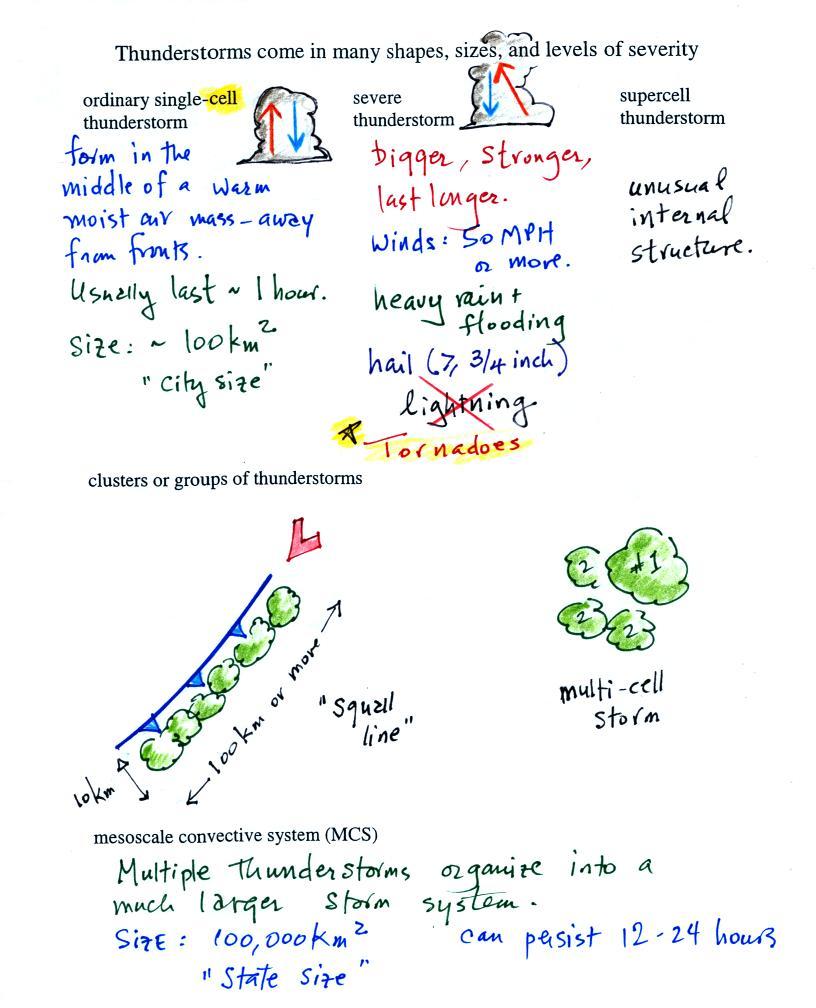
severity. We will mostly be concerned with ordinary
single-cell thunderstorms
(also referred to as air mass thunderstorms). They form in the
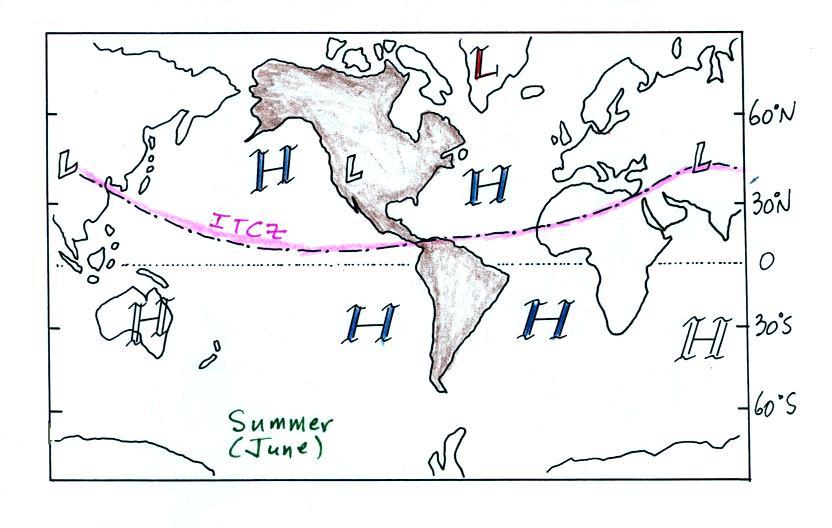
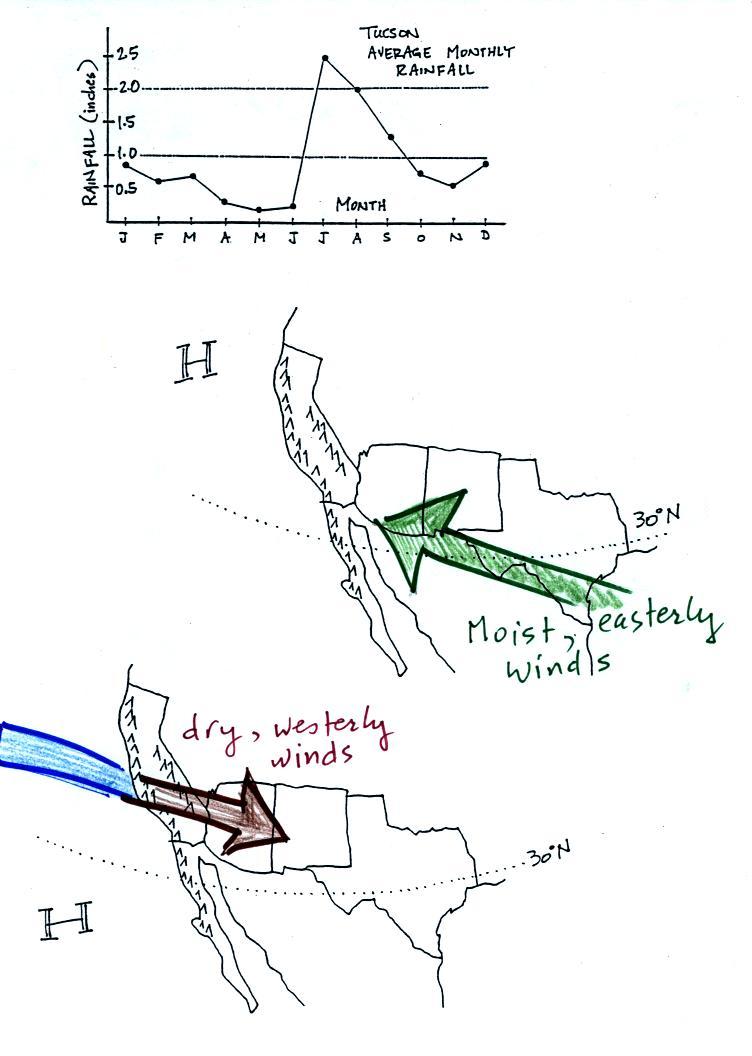
middle of warm moist air, away from front. Most summer
thunderstorms in Tucson are this type. An air mass
thunderstorm has a vertical updraft. A cell is just a
thunderstorm "unit."
Tilted updrafts are found in severe and supercell
thunderstorms. As we shall see this allows those storms to get
bigger, stronger, and
last longer. The tilted updraft will sometimes begin
to rotate. We'll see this
produces an interesting cloud feature called a wall cloud and tornadoes.
Supercell
thunderstorms
have
a complex internal
structure; we'll watch a short
video at some point that shows a computer simulation of the complex air
motions inside a supercell thunderstorm.
We won't spend anytime discussing mesoscale convective systems
except to say that they are a much larger storm system. They can
cover a large portion of a state. They move slowly and often
thunderstorm activity can persist for much of a day. Occasionally
in the summer in Tucson we'll have activity that lasts throughout the
night. This is often caused by an MCS.
The
following somewhat tedious material was intended to
prepare you to better appreciate a time lapse video movie
of a thunderstorm developing over the Catalina mountains. I don't
expect you to remember all of the details given below. The
figures below are more carefully drawn versions of what was done in
class.
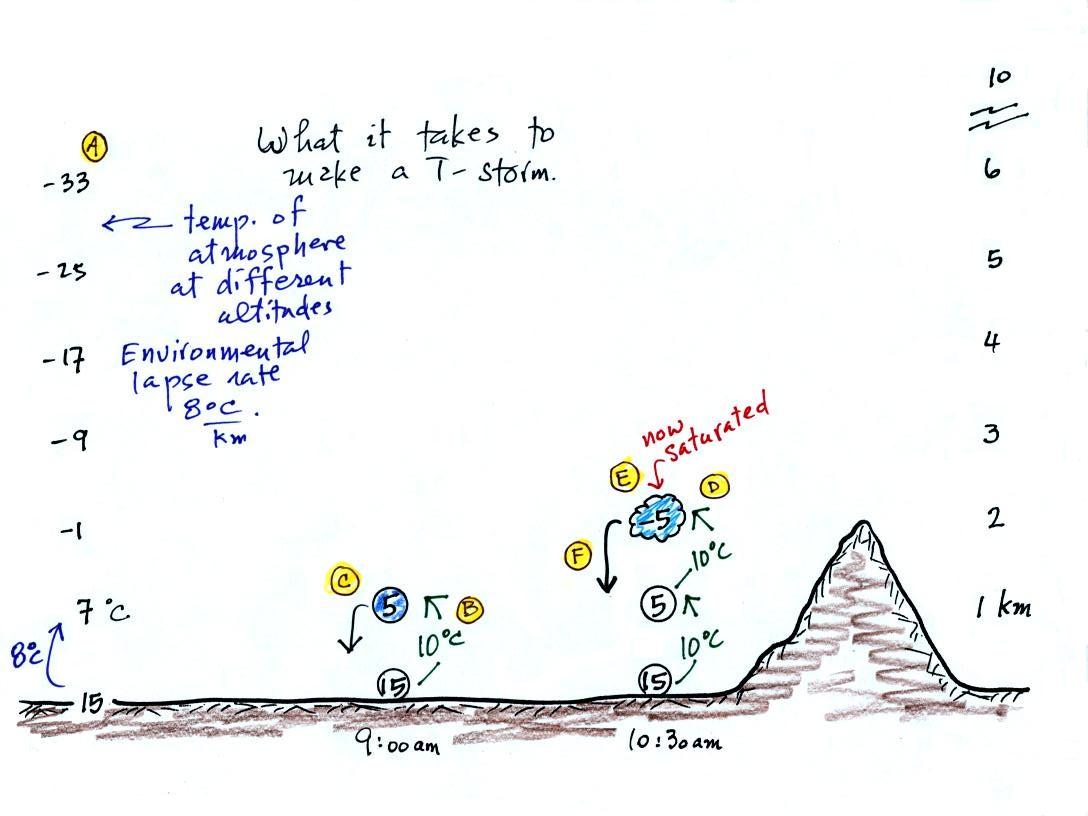
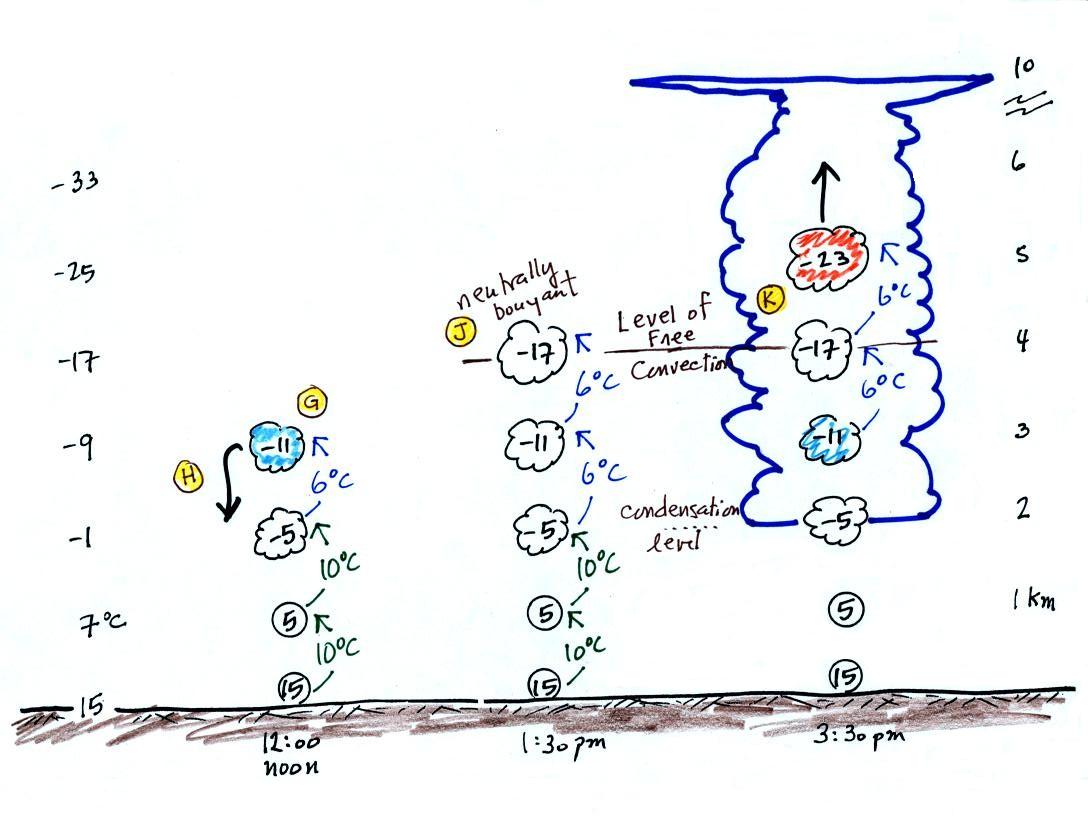
Refer back and forth between the lettered points in
the
figure
above and the commentary below.
The numbers in Column A
show the temperature of the air in the atmosphere at various altitudes
above the ground (note the altitude scale on the right edge of the
figure). On this particular day the air temperature was
decreasing at a rate of 8 C per kilometer. This rate of decrease
is referred to as the environmental lapse rate (lapse rate just means
rate of decrease with altitude). Temperature could
decrease more quickly than shown here or less rapidly.
Temperature in the atmosphere can even increase with increasing
altitude
(a temperature inversion).
At Point B, some of
the surface air is put into an imaginary container, a parcel.
Then a meterological process of some kind lifts the air to 1 km
altitude (in Arizona in the summer, sunlight heats the ground and air
in contact with the ground, the warm air becomes bouyant - that's
called free convection). The
rising air will expand and cool as it is
rising. Unsaturated (RH is less than 100%) air cools at a rate of
10 C per
kilometer. So the 15 C surface air will have a temperature of 5 C
once it arrives at 1 km altitude.
Early in the morning "Mother Nature" is only able to lift the parcel to
1 km and "then lets go." At Point C note that
the air inside the parcel is slightly colder than the air outside (5 C
inside versus 7 C outside). The air inside the parcel will be
denser than the air outside and the parcel will sink back
to the
ground.
By 10:30 am the parcel is being lifted to 2 km as shown at Point D. It is still
cooling 10 C for every kilometer of altitude gain. At 2 km, at Point E the
air
has
cooled
to
its
dew
point
temperature
and
a
cloud
has
formed. Notice at Point
F, the air in the parcel or in the cloud (-5 C) is still colder
and denser than the surrounding air (-1 C), so the air will sink back
to the ground and the cloud will disappear. Still no thunderstorm
at this point.
At noon, the air is lifted to 3
km. Because the
air
became saturated at 2 km, it will cool at a different rate
between 2 and
3 km altitude. It cools at a rate of 6 C/km instead of 10
C/km. The saturated air cools more slowly because release of
latent heat
during condensation offsets some of the cooling due to
expansion. The air that arrives at 3km, Point H, is again still
colder than the
surrounding air and will sink back down to the surface.
By 1:30 pm the air is getting high enough that it has become
neutrally
bouyant, it has the same temperature and density as the air around it
(-17 C inside and -17 C outside). This is called the level of
free convection, Point J in the figure.
If you can, somehow or another, lift air above the level of
free
convection it will find itself warmer and less dense than the
surrounding air as shown at Point K and will float upward to the top of
the troposphere on its own. This is really the
beginning of a thunderstorm. The thunderstorm will grow
upward
until it reaches very stable air at the bottom of the stratosphere.
This was
followed by a time lapse video tape of
actual thunderstorm formation and growth. I don't have a digital
version of that tape, so here is a
substitute time lapse of a day's worth of thunderstorm develop
The events leading up to the initiation of a summer air mass
thunderstorm is
summarized in
the figure below. It takes
some
effort and often a good
part of the
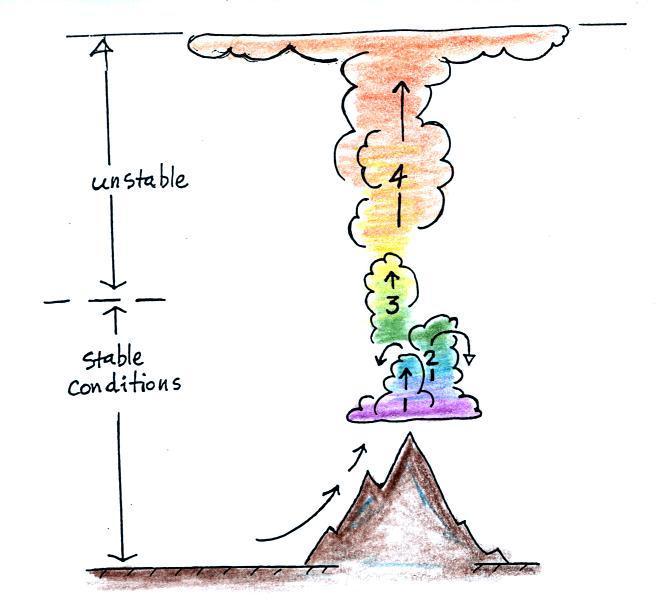
day before a thunderstorm forms. The air must be lifted to just
above the
level of free convection (the dotted line at middle left in the
picture). Once air is lifted above the level of
free
convection it finds itself warmer and less dense that the air around it
and
floats upward on its own. I've tried to show
this with colors below. Cool colors below the level of free
convection because the air in the lifted parcel is colder and denser
than its surroundings. Warm colors above the dotted line indicate
parcel air that is
warmer and less dense than the surroudings. Once the parcel is
lifted above the level of free
convection it becomes bouyant; this is the
moment at
which the air mass thunderstorm begins.
Once a
thunderstorm develops it then goes through 3 stages.

In the
first stage you would only find updrafts inside the cloud (that's all
you need to know about this stage, you don't even need to remember its
name).

Once precipitation has formed and grown to a certain size, it will
begin to
fall and drag air downward with it. This is the beginning of the
mature
stage where you find both an updraft and a downdraft inside the
cloud.
The falling precipitation will also pull in dry air from outside the
thunderstorm (this is called entrainment). Precipitation will mix
with
this drier air and evaporate. The evaporation will strengthen the
downdraft
(the evaporation cools the air and makes it more
dense).
The thunderstorm is strongest in the mature stage. This is when
the
heaviest rain, strongest winds, and most of the lightning occur.
Eventually the downdraft spreads
horizontally throughout the inside of
the
cloud and begins to interfere with the updraft. This marks the
beginning of the end for this thunderstorm.

The
downdraft eventually fills the interior of the cloud. In this
dissipating stage you would only find weak downdrafts
throughout the cloud.
Note how the winds from one
thunderstorm can cause a region of
convergence on
one side of the original storm and can lead to the development of new
storms. Preexisting winds refers to winds that were blowing
before the
thunderstorm formed. Convergence between the prexisting and the
thunderstorm downdraft winds creates rising air that can initiate a new
thunderstorm.