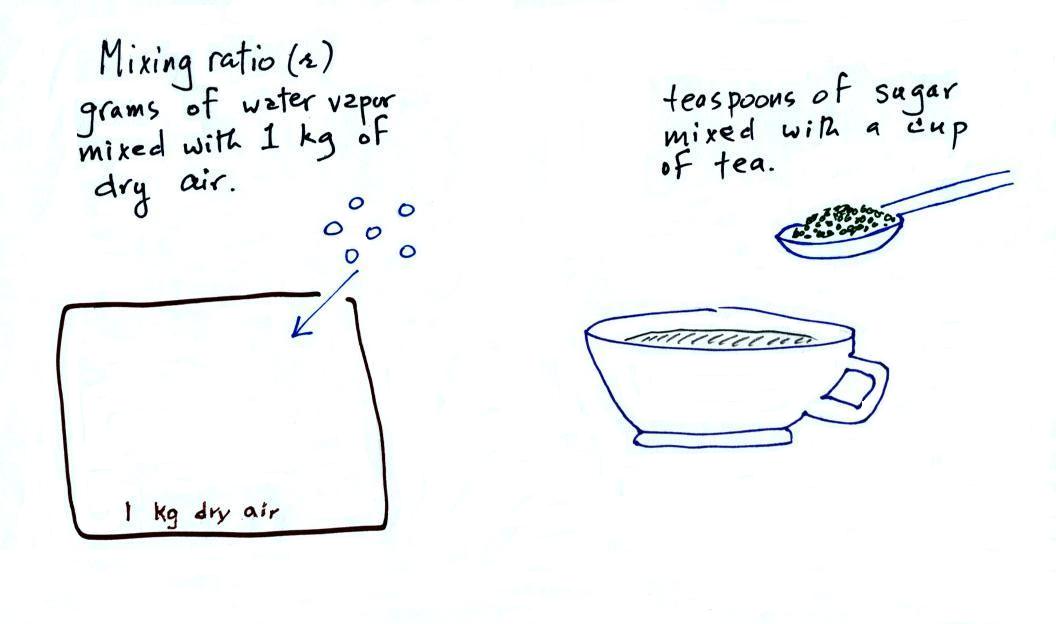
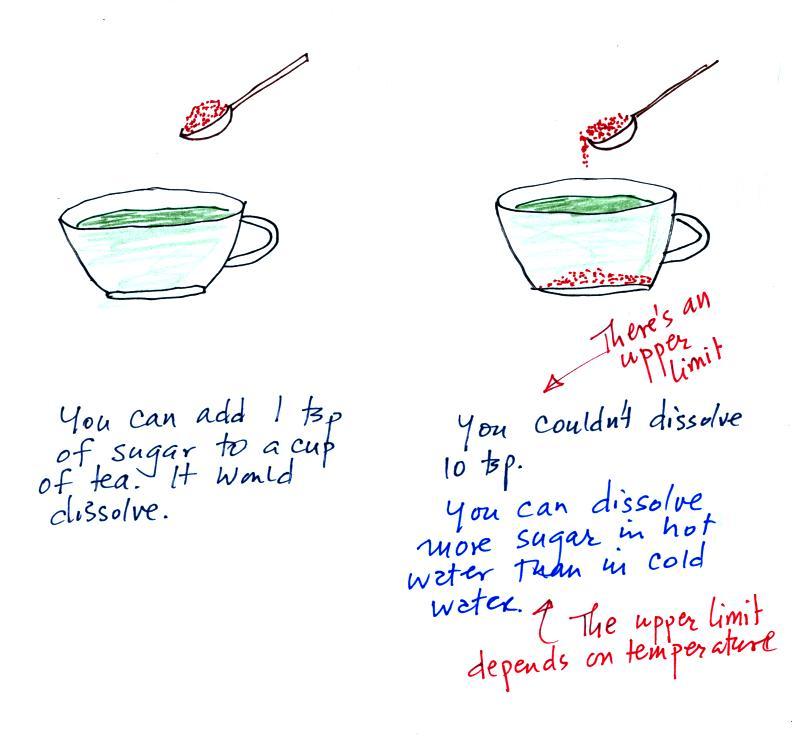
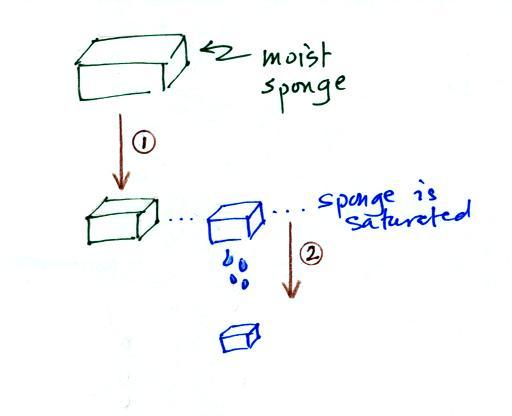
Thursday Oct. 18, 2012
click here to download today's notes in a more printer friendly format

A couple of songs before class today.  The first was "Nothing Else Matters" from Apocalytica, I like listening to it in ILC 150.  That was followed by something completely different "Somebody That I Used to Know" from Gotye.

The Experiment #2 reports have been graded and were returned in class today.  You can revise the reports if you want to (it isn't required).  Revised reports are due by Thu., Nov. 1. 

The Causes of the Seasons and the Ozone and Ozone Hole 1S1P reports were collected today.  The 3rd Assignment #2 topic is due next Thursday.

Midterm grade summaries were also distributed in class today.  You'll find more information in the middle of today's lecture notes.

An In-class Optional Assignment was also handed out today.  If you weren't in class and would like to do the assignment, you can download it and turn it in at the beginning of class next Tuesday.  Another take home Optional Assignment was also handed out, it isn't due until next Thursday (Oct. 25).


We spent the first half of the class period on an introduction to the next major topic we will be covering: humidity (moisture in the air).  This topic and the terms that we will be learning and using can be confusing.  That's the reason for this introduction.  We will be mainly be interested in 4 variables:


Our interest isn't so much in the variables themselves but rather be able to use them to understand other phenomena.  Today we will concentrate on what their "jobs" are and what can cause them to change value.  What follows is a pretty detailed explanation of what will initially be confusing.


Mixing ratio tells you how much water vapor is actually in the air.  You can think of it as just a number: when the value is large there's more water vapor in the air than when the value is small.  Mixing ratio has units of grams of water vapor per kilogram of dry air (the amount of water vapor in grams mixed with a kilogram of dry air).  It's basically the same idea as teaspoons of sugar mixed in a cup of tea.


The value of the mixing ratio won't change unless you add water vapor to or remove water vapor from the air.  Since the mixing ratio's job is to tell you how much water vapor is in the air, you don't want it to change unless water vapor is actually added to or removed from the air.

Warming the air won't change the mixing ratio.  Cooling the air won't change the mixing ratio (unless the air is cooled below its dew point temperature and water vapor starts to condense).  This is a subtle point that we will be using later in today's class. 

------------------------------------------------------------------------------------------------------------------------------------------------------------------------------


Saturation mixing ratio gives you the maximum amount of what vapor that can be found in air.  It's a property of air and depends on the air's temperature; warm air can potentially hold more water vapor than cold air.  It doesn't say anything about how much water vapor is actually in the air (that's the mixing ratio's job).    This variable has the same units: grams of water vapor per kilogram of dry air.  Saturation mixing ratio values for different air temperatures are listed and graphed on p. 86 in the photocopied class notes.


The sugar dissolved in tea analogy is still helpful.  Just as is the case with water vapor in air, there's a limit to how much sugar can be dissolved in a cup of hot water.  You could dissolve 1 tsp but I don't think you'd be able to dissolve 10 tsp.  You can dissolve more sugar in hot water than in cold water.

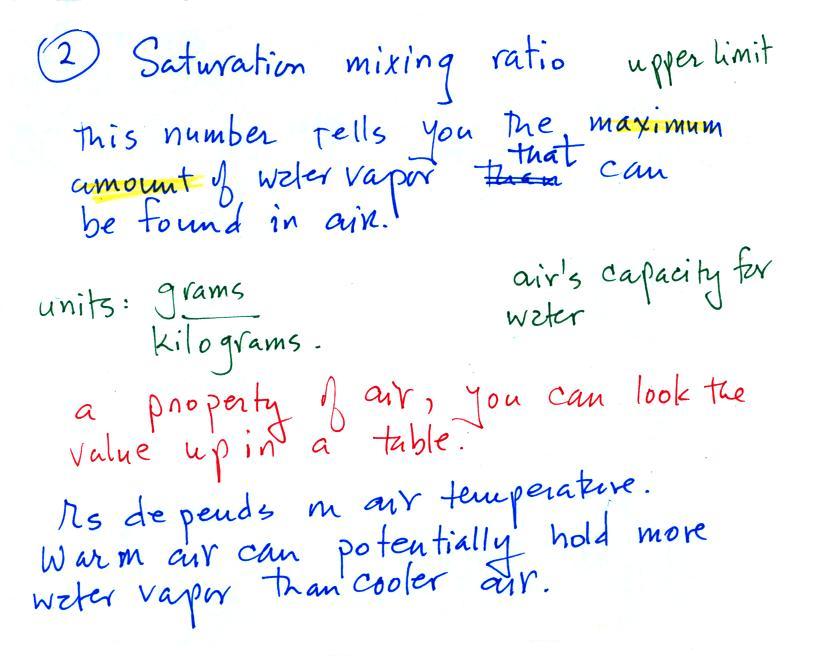
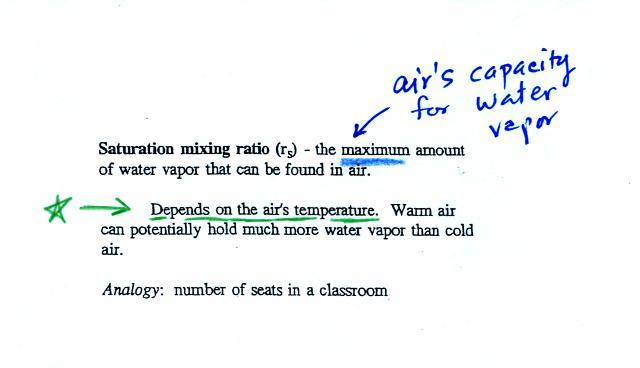
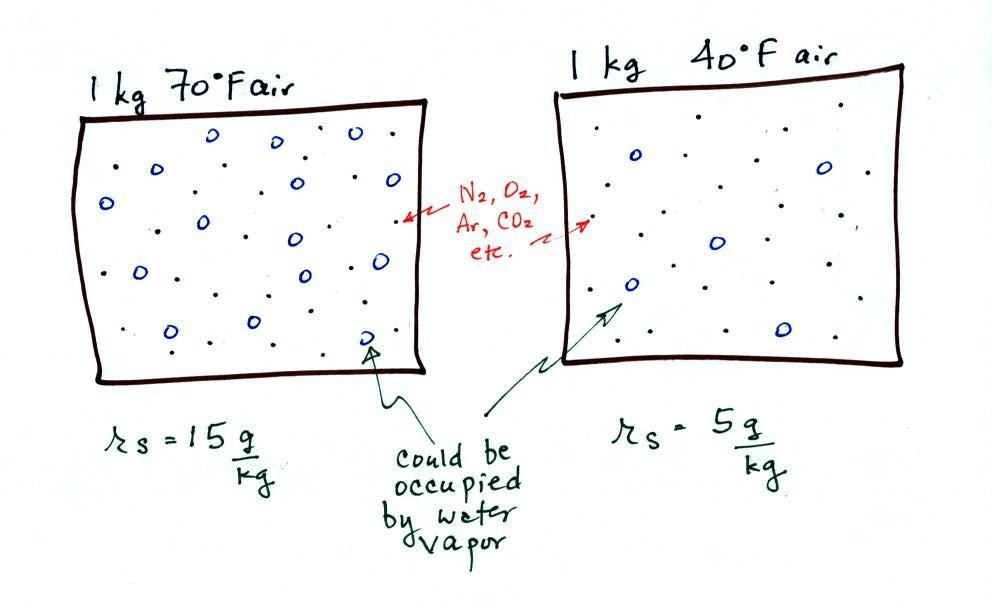
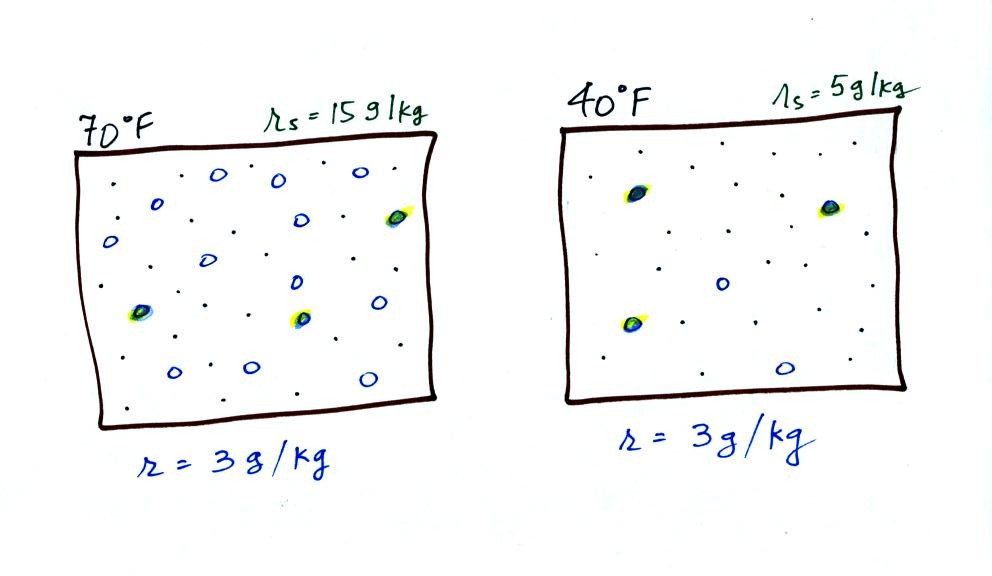
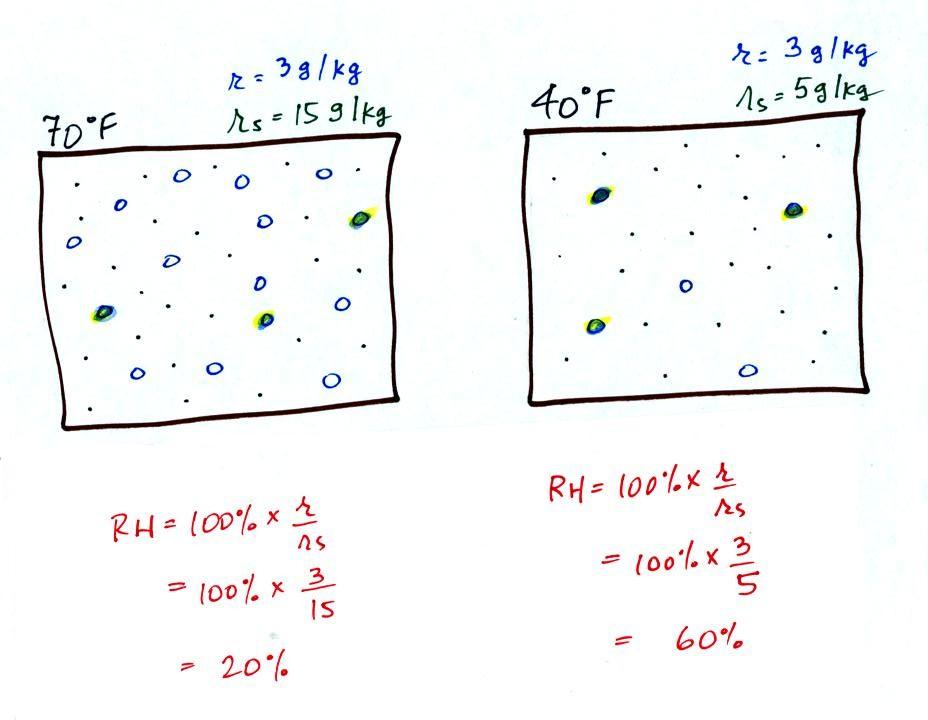
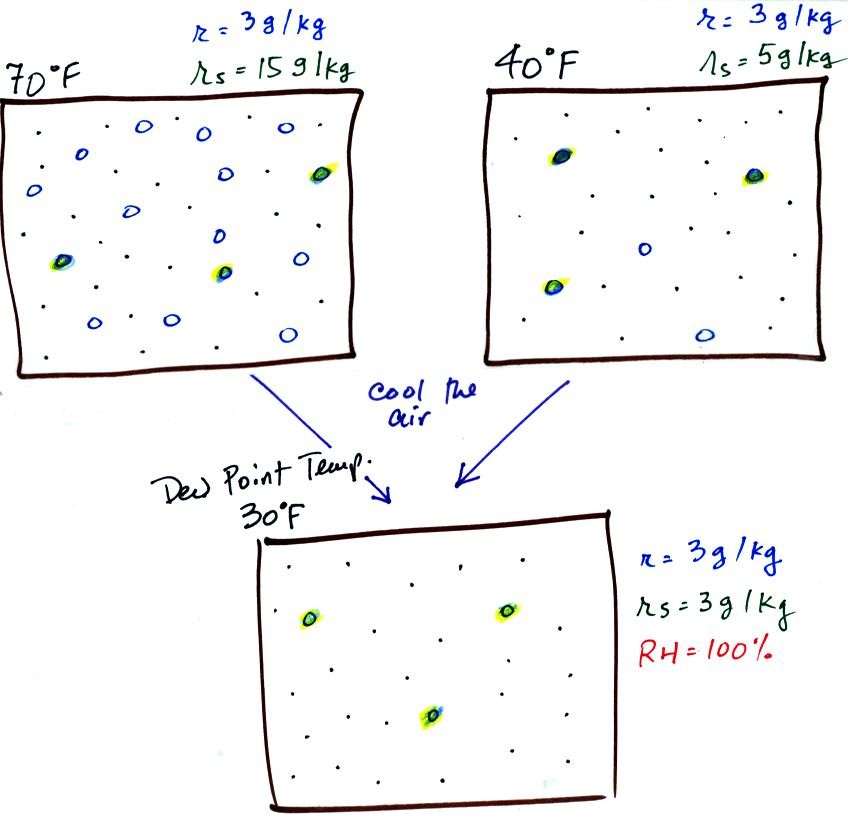
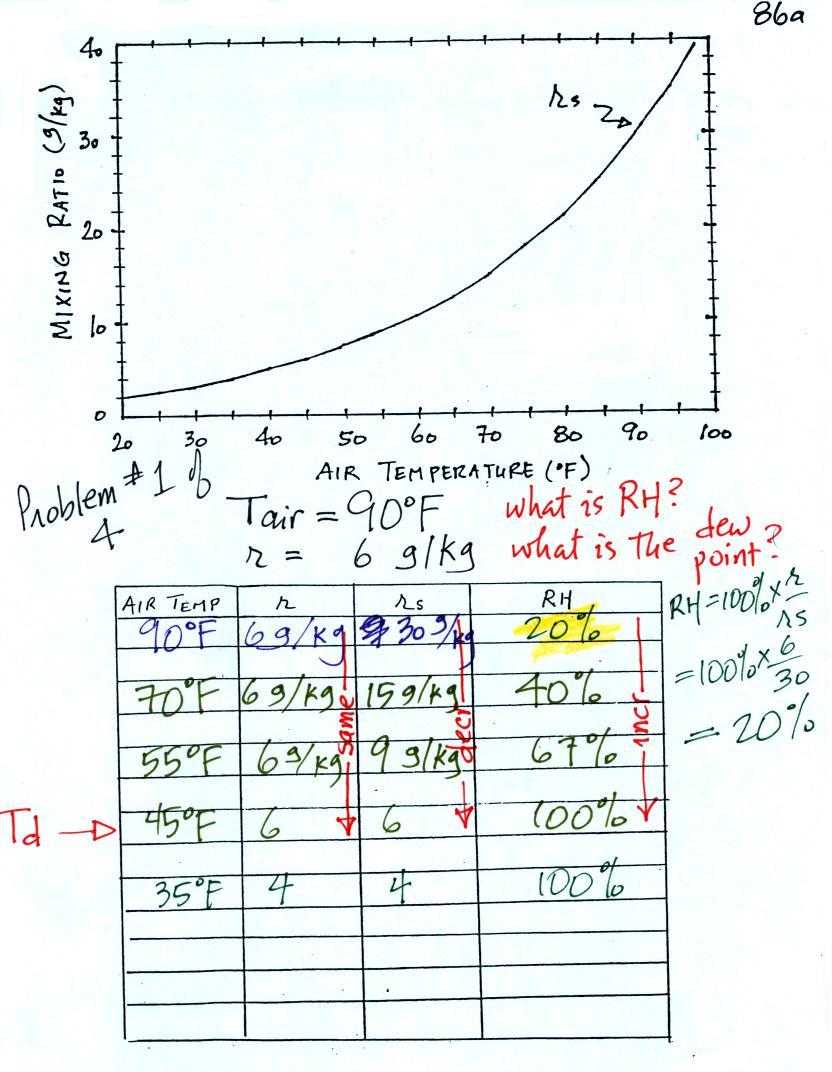
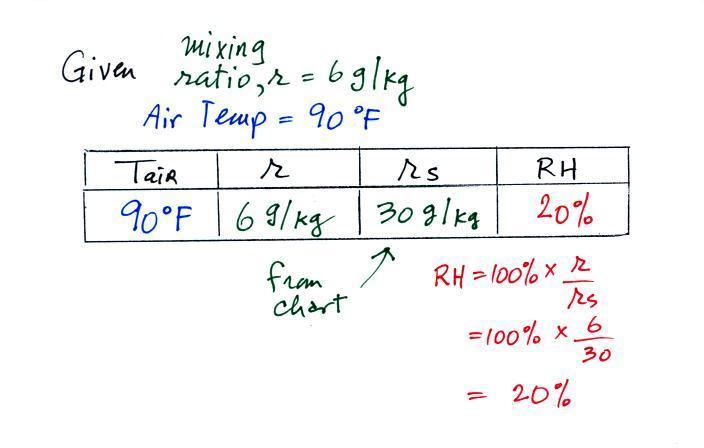
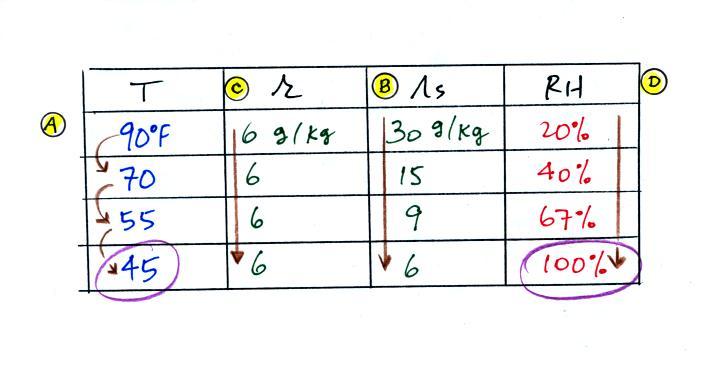
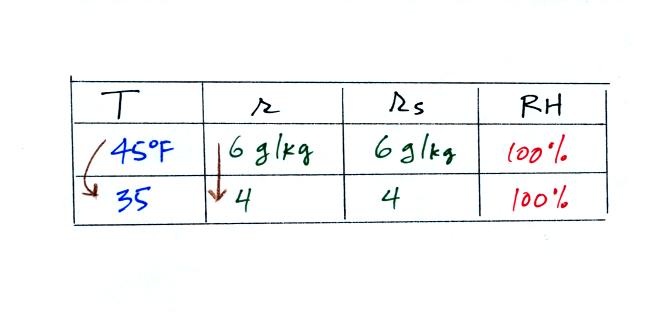
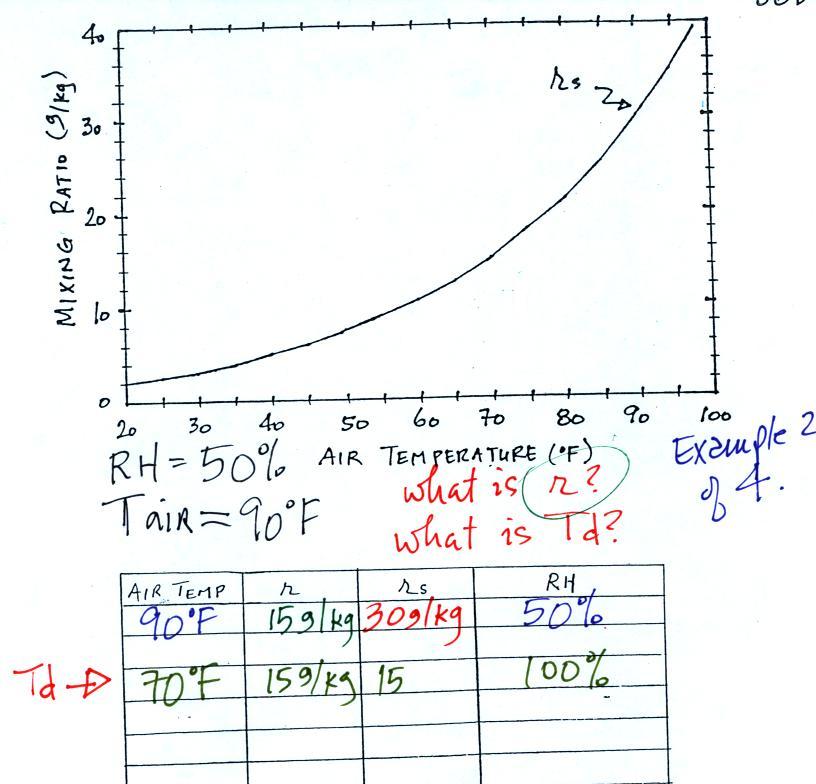
The dependence of saturation mixing ratio on air temperature is illustrated below:


The small specks represent all of the gases in air except for the water vapor.  Each of the open circles represents 1 gram of water vapor that the air could potentially hold.  There are 15 open circles drawn in the 1 kg of 70 F air; each 1 kg of 70 F air could hold up to 15 grams of water vapor.  The 40 F air only has 5 open circles; this cooler air can only hold up to 5 grams of water vapor per kilogram of dry air.  The numbers 15 and 5 came from the table on p. 86.


Now we have gone and actually put some water vapor into the volumes of 70 F and 40 F air (the open circles are colored in).  The same amount, 3 grams of water vapor, has been added to each volume of air.  The mixing ratio, r, is 3 g/kg in both cases.

After looking at the figure above I suspect you might be starting to guess at what relative humidity might mean.
---------------------------------------------------------------------------------------------------------------------------------------------------------------------


The relative humidity is the variable most people are familiar with.  It tells you how "full" the air is with water vapor, how close it is to being filled to capacity with water vapor.

In the analogy (sketched on the right hand side of p. 83 in the photocopied notes) 4 students wander into Classroom A which has 16 empty seats.  Classroom A is filled to 25% of its capacity.  You can think of 4, the actual number of students, as being analogous to the mixing ratio.  The classroom capacity is analogous to the saturation mixing ratio.  The percentage occupancy is analogous to the relative humidity.

The figure below goes back to the volumes (1 kg each) of 70 F and 40 F air that could potentially hold 15 grams or 5 grams of water vapor.

Both the 70 F and the 40 F air each contain 3 grams of water vapor.  The 70 F air is only filled to 20% of capacity (3 of the 15 open circles are colored in) because this warm air's capacity, the saturation mixing ratio, is large.  The RH in the 40 F is 60% even though it has the same actual amount of water vapor because the 40 F air can't hold as much water vapor and is closer to being saturated. 

Something important to note: RH doesn't really tell you how much water vapor is actually in the air.  The two volumes of air above contain the same amount of water vapor (3 grams per kilogram) but have very different relative humidities.  You could just as easily have two volumes of air with the same relative humidities but different actual amounts of water vapor.
-----------------------------------------------------------------------------------------------------------------------------------------------------------------------------


The dew point temperature has two jobs.  First it gives you an idea of the actual amount of water vapor in the air.  In this respect it is just like the mixing ratio.  If the dew point temperature is low the air doesn't contain much water vapor.  If it is high the air contains more water vapor.  One of the things we will learn is that if you know the dew point temperature you can very quickly figure out the mixing ratio and vice versa.

Second the dew point tells you how much you must cool the air in order to cause the RH to increase to 100% (at which point a cloud, or dew or frost, or fog would form).


Back to our volumes of 70 F and 40 F air


If we cool the 70 F air or the 40 F air to 30 F we would find that the saturation mixing ratio would decrease to 3 grams/kilogram.  Since the air actually contains 3 g/kg, the RH of the 30 F air would become 100%.  The 30 F air would be saturated, it would be filled to capacity with water vapor.  30 F is the dew point temperature for 70 F air that contains 3 grams of water vapor per kilogram of dry air.  It is also the dew point temperature for 40 F air that contains 3 grams of water vapor per kilogram of dry air.
  Because both volumes of air had the same amount of water vapor and the same mixing ratio values, they both also have the same dew point temperature.

Now back to the student/classroom analogy


The 4 students move into classrooms of smaller and smaller capacity.  The decreasing capacity of the  classrooms is analogous to the decrease in saturation mixing ratio that occurs when you cool air.  Eventually the students move into a classroom that they just fill to capacity. This is analogous to cooling the air to the dew point.


We took a break at this point to have a look at the midterm grade summaries.  An example is shown below (the values listed are pretty nearly averages for the class).


Your grades on the two quizzes are shown at Point 1.  There are two more quizzes this semester. 

Point 2 shows the number of extra credit points you have earned from turning in Optional Assignments.  It is possible to have earned 1.95 pts at this point, a handful of students have.  The class average was 1 point of extra credit.  By the end of the semester you will have had an opportunity to have earned at least 3 pts of extra credit.

Point 3a shows your score on either an Expt. #1, Expt. #2 or a book report.  Many students haven't yet turned in a report.  They'll find a 0 listed here and a short message at the bottom of their grade summary saying that an average score was used by the computer to provide a reasonable estimate of their writing grade.  Point 3b shows the number of 1S1P points you have earned (the class average is actually 13 not 17.5).  The report points and the 1S1P points are added and a writing percentage grade is computed.  This is shown at Point 3c.  The computer has taken into account the fact that you can't have earned 45 1S1P points at this point in the semester.

Finally the quiz scores and the writing percentage grade are themselves averaged, the extra credit is added on and your overall grade is shown at Points 4a and 4b.  No quiz scores have been dropped in the average at Point 4a.  This is the average that has to be 90.0% or above on the last day of classes in order to get out of the Final Exam.  If you do have to take the Final Exam, the average at Point 4b would be used together with your Final Exam score to determine your overall grade.

The grade estimate attempts to determine what you will end up with at the end of the semester if you keep doing like you have done up to this point.  With two quizzes left and lots of writing still to do there is time for significant improvement.  It is also possible for your grade to drop between now and the end of classes if you stop performing as you have been.


A lot of students are currently working on Experiment #3 so I showed a couple of videos that relate to the experiment.  The second video was made by a student.

The object of the experiment is to measure the energy in sunlight arriving at the ground here in Tucson.  The apparatus used is sketched below:

It consists of two pieces of wood connected together with a hinge.  A styrofoam insert fits into one of the pieces of wood and hold a small rectangular piece of metal painted black so that it will absorb sunlight.  There is a hole drilled into the side of the metal block so that a thermometer can be inserted to measure the temperature of the block.  The block can be elevated and turned so that it is pointing straight at the sun (rays of sunlight strike the metal block perpendicularly).  When the block is oriented corectly a small dowel sticking out the front of the apparatus won't cast a shadow.


A couple of photographs of the apparatus are shown above.  You can see the black metal block, the dowel, and the small piece of wire that keeps one of the pieces of wood elevated so that it points at the sun.

In the left photo the apparatus hasn't yet been properly oriented and the dowel is casting a shadow.  At right the apparatus has been turned until the dowel isn't casting a shadow.

After setting up the device you simply the measure the block's temperature and time while the block heats up.  This change of temperature with time data together with the mass, crossectional area of the block and the specific heat of aluminum are enough to estimate the amount of energy striking the block.  Click on this link if you would like to read more about how that is done.


We had time to work through a couple humidity problems (we'll do a couple more next Tuesday).  Hopefully this will increase your understanding of the roles the various humidity variables play and what can cause their values to change. 

Example #1
Here's the work we actually did in class


This would be hard to sort out even if you were in class.  So we'll work through this problem in a more detailed, step-by-step manner.


We're given an air temperature of 90 F and a mixing ratio (r) of 6 g/kg.  We're  supposed to find the relative humidity (RH) and the dew point temperature. 
We start by entering this data in the table.

Anytime you know the air's temperature you can look up the saturation mixing ratio value on a chart (such as the one on p. 86 in the ClassNotes); the saturation mixing ratio is 30 g/kg for 90 F air.  90 F air could potentially hold 30 grams of water vapor per kilogram of dry air (it actually contains 6 grams per kilogram in this example). 

Once you know mixing ratio and saturation mixing ratio you can calculate the relative humidity (you divide the mixing ratio by the saturation mixing ratio, 6/30, and multiply the result by 100%).  You ought to be able to work out the ratio 6/30 in your head (6/30 = 1/5 = 0.2).  The RH is 20%. 


The numbers we just figured out are shown on the top line above.

(A) We imagined cooling the air from 90F to 70F, then to 55F, and finally to 45F.
(B) At each step we looked up the saturation mixing ratio and entered it on the chart.  Note that the saturation mixing ratio values decrease as the air is cooling.

(C) The mixing ratio (r) doesn't change as we cool the air.  The only thing that changes r is adding or removing water vapor and we aren't doing either.  This is probably the most difficult concept to grasp.
(D) Note how the relative humidity is increasing as we cool the air.  The air still contains the same amount of water vapor it is just that the air's capacity is decreasing.

Finally at 45 F the RH becomes 100%.  This is kind of a special point.  You have cooled the air until it has become saturated. 
The dew point temperature in this problem is 45 F.

What would happen if we cooled the air further still, below the dew point temperature?


35 F air can't hold the 6 grams of water vapor that 45 F air can.  You can only "fit" 4 grams of water vapor into the 35 F air.  The remaining 2 grams would condense.  If this happened at ground level the ground would get wet with dew.  If it happens above the ground, the water vapor condenses onto small particles in the air and forms fog or a cloud.  Because water vapor is being taken out of the air (the water vapor is turning into water), the mixing ratio will decrease from 6 g/kg to 4 g/kg.  As you cool air below the dew point, the RH stays constant at 100% and the mixing ratio decreases.

In many ways cooling moist air is liking squeezing a moist sponge (this figure wasn't shown in class)


Squeezing the sponge and reducing its volume is like cooling moist air and reducing the saturation mixing ratio.  At first (Path 1 in the figure) when you sqeeze the sponge nothing happens, no water drips out.  Eventually you get to a point where the sponge is saturated.  This is like reaching the dew point.  If you squeeze the sponge any further (Path 2) water will begin to drip out of the sponge (water vapor will condense from the air).


Example 2

We're given an air temperature of 90 F and a relative humidity of 50%; we'll try to figure out the mixing ratio and the dew point temperature.  Here's something like what we ended up with in class.


 The problem is worked out in detail below:


First you fill in the air temperature and the RH data that you are given.

(A) since you know the air's temperature you can look up the saturation mixing ratio (30 g/kg). 

(B)  Then you might be able to figure out the mixing ratio in your head.  Air that is filled to 50% of its capacity could hold up to 30 g/kg.  Half of 30 is 15, that is the mixing ratio.  Or you can substitute into the relative humidity formula and solve for the mixing ratio.  The details of that calculation are shown above at B.


Finally you imagine cooling the air.  The saturation mixing ratio decreases, the mixing ratio stays constant, and the relative humidity increases.   In this example the RH reached 100% when the air had cooled to 70 F.  That is the dew point temperature.


We can use results from humidity problems #1 and #2 to learn and understand a useful rule.


In the first example the difference between the air and dew point temperatures was large (45 F) and the RH was low (20%).  In the 2nd problem the difference between the air and dew point temperatures was smaller (20 F) and the RH was higher (50%).  The easiest way to remember this rule is to remember the case where there is no difference between the air and dew point temperatures.  The RH then would be 100%.

That was enough for this class.  I may put the remaining two problems and the start of the Tuesday Oct. 23 notes.