Thu., Sept. 27, 2012
click here to
download these notes in a more printer friendly format
A couple of songs from Playing for Change. The first was Don't Worry
and was followed by the best version of Stand By Me
you'll ever hear (that's my opinion anyway).
The Experiment #1 reports have all been graded and were returned
in class today. You now have two weeks to revise your report if
you want to (you don't have to). You only need to change sections
were you want to earn additional credit. Please return the
original report with your revised report. The revised reports are
due on or before Thu. Oct. 11.
A second Optional
Assignment on Upper Level Charts is now available. If you
make an honest effort to answer all the questions and have the
assignment done before coming to class you can earn extra credit.
If you answer at least 85% of the questions correctly you'll earn extra
credit and a "Green Card." The
assignment is due next Thursday, Oct. 4.
Up to this point we've been learning about surface weather
maps. Maps
showing conditions at various altitudes above the ground are also
drawn.
Upper level conditions can affect the development and movement of
surface
features (and vice versa). We covered some of the basic concepts
at the start of the period today. Some additional
supplementary information is available online.
This
supplementary
reading
provides
all
the
background
information
you'll need to be able to
answers the questions on the new optional assignment mentioned above.l
Here we'll mostly
just learn 3 basic facts about upper level
charts.
First the overall appearance is somewhat different from a surface
weather
map. The pattern on a surface map can be complex and you
generally find circular (more or less)
centers
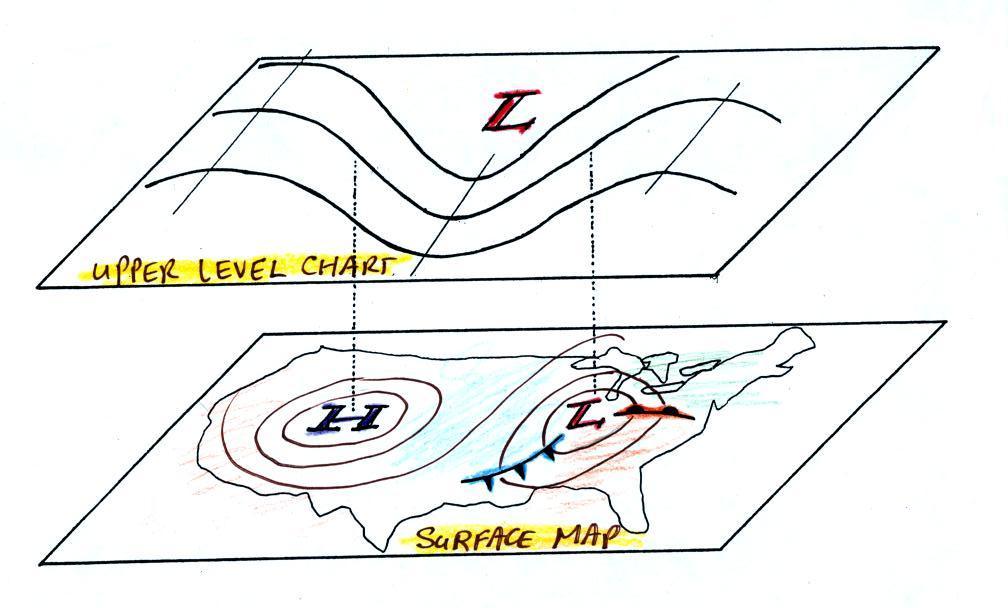
of high and low pressure (see the bottom portion of the figure
below). You can also find closed high and low
pressure
centers at upper levels, but mostly you find a relatively simple wavy
pattern like is shown on the upper portion of the figure below (sort of
a 3-dimensional view). You'll find this basic picture on p. 41 in
the ClassNotes.
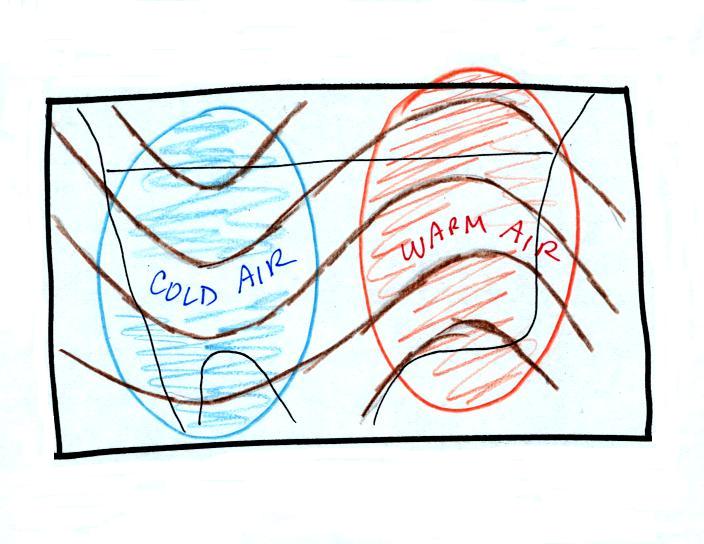
A simple upper level
chart pattern is sketched below (a map view). There are two basic
features:
wavy lines that dip southward and have a "u-shape" and lines that bend
northward and have an "n-shape".

The u-shaped
portion of the pattern is called a trough. The n-shaped portion
is called
a ridge.
Troughs
are
produced
by
large
volumes
of
cool
or
cold
air
(the
cold
air
is
found
between
the
ground
and
the
upper
level
that
the
map
depicts).
The
western
half
of the country in the map above would
probably
be experiencing colder than average temperatures. Large volumes
of warm
or hot air produce ridges. You can find out why this is true by
reading "Upper
level
charts
pt.
2".

The
winds on upper level charts blow parallel to the contour lines
generally from west to east. This is a little different from
surface winds which blow across the isobars toward low pressure.
An example of surface winds is shown below.

That's it for this first
section. Really all you need to be able to do is
1. identify troughs and ridges,
2. remember that troughs are associated with cold air & ridges with
warm air, and
3. remember that upper level winds blow parallel to the contour lines
from west to east.
Here's the earlier picture again overlaying surface and
upper-level maps.

On
the surface map above you see centers of HIGH and LOW pressure.
The
surface low
pressure center, together with the cold and warm fronts, is a middle
latitude
storm.
Note how the counterclockwise winds spinning around the LOW move warm
air
northward (behind the warm front on the eastern side of the LOW) and
cold air
southward (behind the cold front on the western side of the LOW).
Clockwise winds spinning around the HIGH also move warm and cold
air. The
surface winds are shown with thin brown arrows on the surface map.
Note the ridge and trough features on the upper level chart. We
learned
that warm air is found below an upper level ridge. Now you can
begin to
see where this warm air comes from. Warm air is found west of the
HIGH
and to the east of the LOW. This is where the two ridges on
the
upper level chart are also found. You expect to find cold air
below an
upper level trough. This cold air is being moved into the middle
of the
US by the northerly winds that are found between the HIGH and the
LOW.
Note the yellow X marked on the upper level chart directly above the
surface
LOW. This is a good location for a surface LOW to form, develop,
and
strengthen (strengthening means the pressure in the surface low will
get even
lower than it is now. This is also called "deepening"). The
reason for this is that the yellow X
is a
location where there is often upper level divergence. Similary
the pink X
is where you often find upper level convergence. This could cause
the
pressure in the center of the surface high pressure to get even
higher. You can read more about this in Upper
level
charts
pt.
3.
The upper level winds could also cause the surface storm to weaken
(the low pressure would get higher).
.
The following
picture wasn't shown in class on Thursday.

One of the things we have learned about surface LOW
pressure is that
the
converging surface winds create rising air motions. The figure
above
gives you an idea of what can happen to this rising air (it has to go
somewhere). Note the two
arrows of
air coming into the point "DIV" and three arrows of air leaving (more
air going out than coming in), this is upper level divergence).
The
rising
air can, in effect, supply the extra arrow's worth of air.
Three arrows of air come into the point marked "CONV" on the upper
level chart and two leave (more air coming in than going out = upper
level convergence).
What
happens to the extra arrow? It sinks, it is the source of the
sinking air
found above surface high pressure.
OK we're done with weather maps for the time being. Though
if interesting weather appears imminent I'll try to mention it in class
(earlier in the week it looked like the remnants of Hurricane
Miriam might bring some rainy weather to Tucson this weekend, but that
no longer seems to be the case).
The plot above at left shows the forecasted path of Hurricane
Miriam on Monday. At the time it looked like the storm was headed
toward southern Arizona. Miriam was a Category 3 hurricane (on a
scale that runs from 1 to 5) and had winds of 120 MPH. The figure
at right shows the forecasted path this morning. Miriam is now a
tropical storm with sustained winds of 40 MPH.
If we were using a textbook in this class we'd be moving into
Chapter 2! During the next couple of weeks we
will be concerned
with energy,
temperature, heat, energy transport, and
energy
balance between the earth, atmosphere, and space.
It is easy to
lose sight of the main concepts because there are so many
details. Most of the following figures are found on pps 43&44
in the photocopied
ClassNotes.
Types
of
energy
We will learn the names of several
different types or forms of
energy.
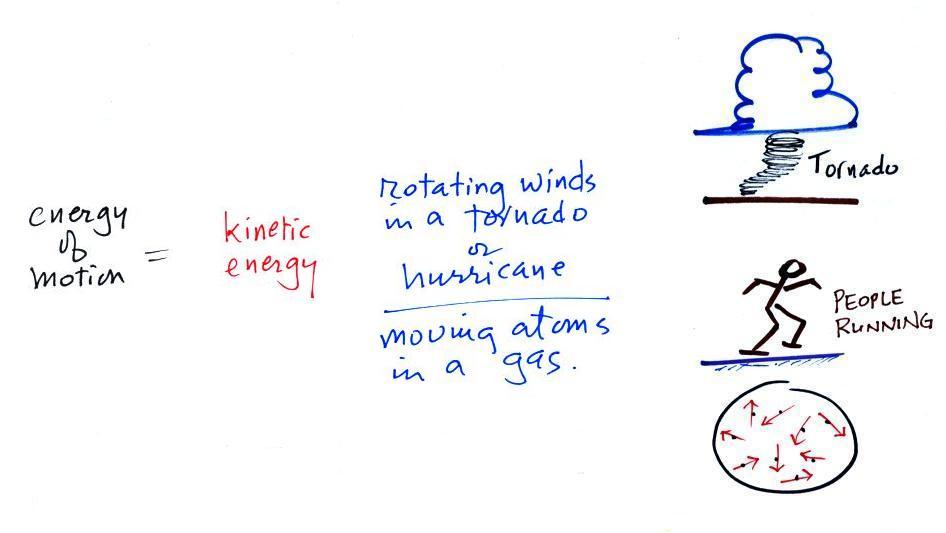
Kinetic energy is energy of motion. Some examples (both large
and microscopic scale) are mentioned
and sketched above. This is a relatively easy to visualize and
understand form of energy.
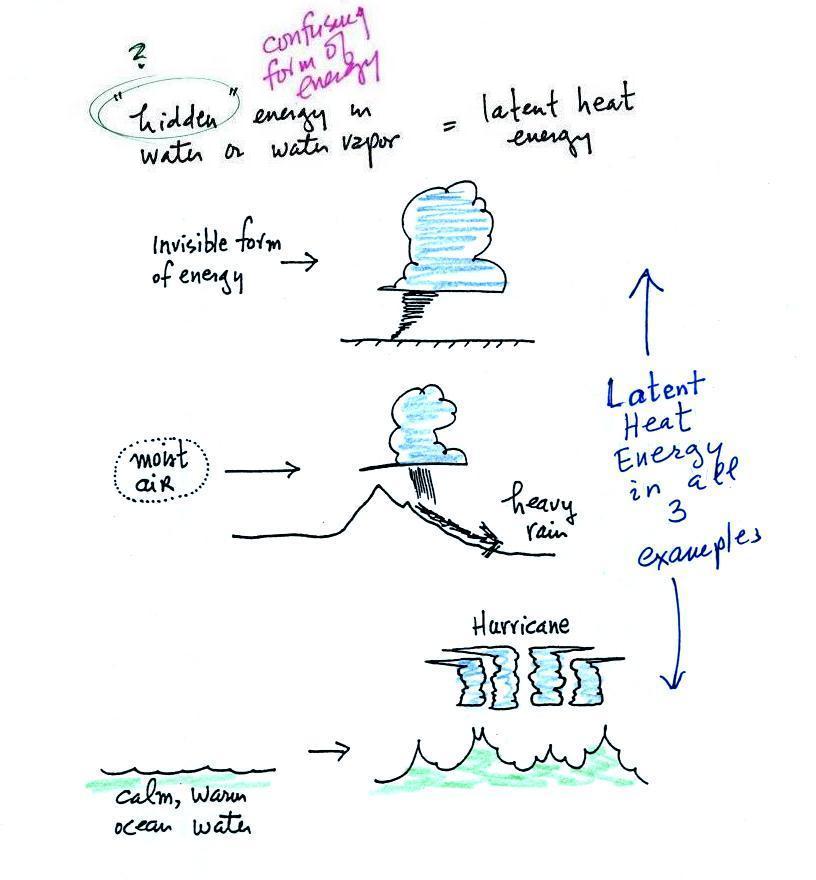
Latent heat energy is an underappreciated and
rather confusing type of energy. The word latent refers to energy that
is
hidden in water and water vapor. The hidden energy emerges when
water vapor condenses or water freezes (the energy had been added
earlier when ice was melted or water was evaporated). The fact
that the energy is hidden is part of what makes it confusing.
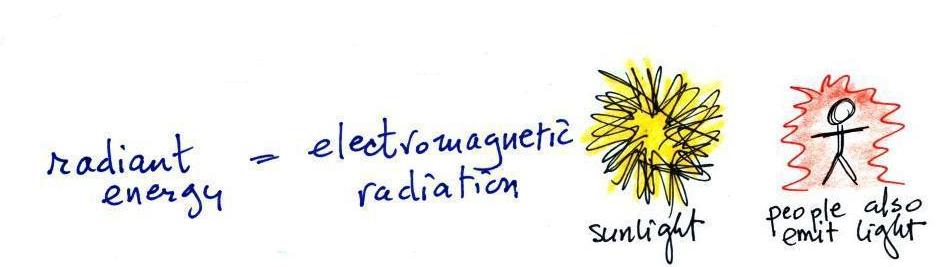
Radiant energy is a very important form of energy that was for
some
reason left off the original list in the ClassNotes. Sunlight is
an example of
radiant energy that we can see and feel (you feel warm when you stand
in sunlight). There are many types of radiant energy
that are invisible (such as the infrared light that people emit - something I didn't
mention in class).
Electromagnetic radiation is another name for
radiant energy.
Energy
transport
Four energy transport
processes are listed below.
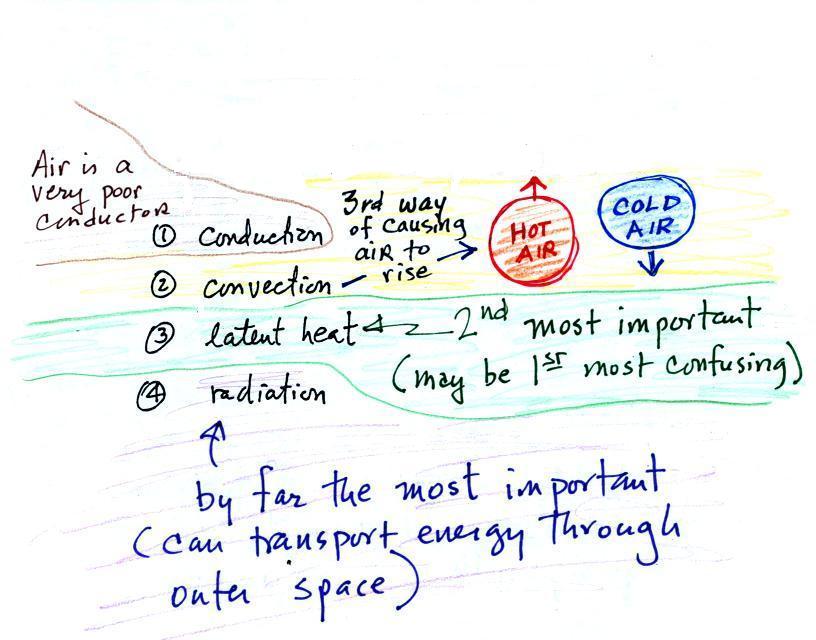
By far the
most important process is at the bottom of the list above. Energy
transport in the form of
electromagnetic radiation (sunlight is a common
form of electromagnetic radiation) is the
only process that can transport energy through empty space.
Electromagnetic radiation travels both to the earth (from the sun) and
away from the earth back into space. Electromagnetic radiation is
also
responsible for about 80% of the
energy transported between the ground and atmosphere.
You might be
surprised to learn that latent heat is the second most important
transport process.
Rising parcels of warm air and sinking parcels of cold air are
examples of free convection. Because of convection you feel
colder or
a cold windy day than on a cold calm day (the wind chill effect).
Ocean currents are also an example of convection.
Ocean currents
transport energy from the warm tropics to colder polar regions.
Convection is a 3rd way of causing rising air
motions in the atmosphere (convergence
into centers of low pressure and fronts are other 2 ways we've
encountered so far)
Conduction is the least important energy transport at least in the
atmosphere. Air is such a poor conductor of energy that it is
generally considered to be an insulator.
Energy
balance
and the
atmospheric greenhouse effect
The next picture
(the figure in the ClassNotes has been split into three
parts for improved clarity) shows energy being transported from the sun
to
the earth in the form of electromagnetic radiation.
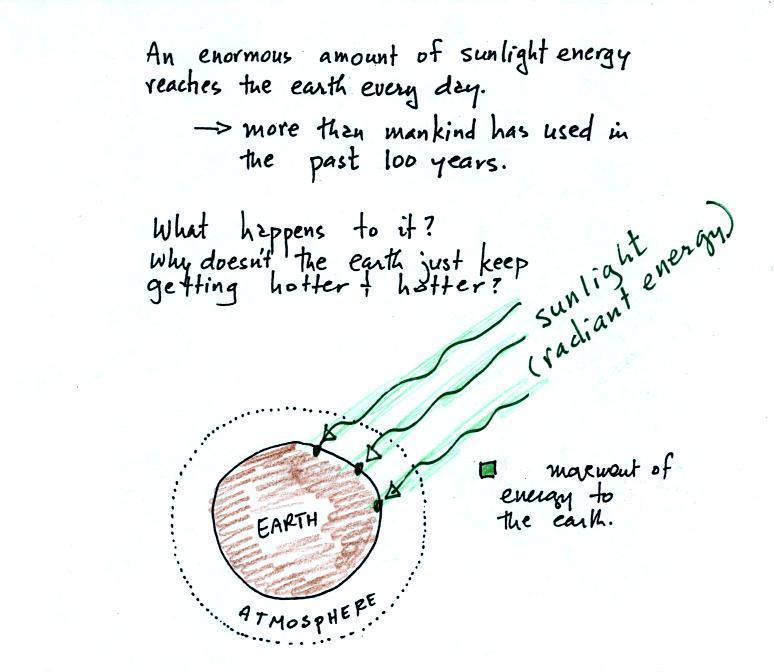
We are aware of this energy because
we can see it (sunlight
also contains invisible forms of light) and feel it. With all of
this energy arriving at and
being
absorbed by the earth, what keeps the earth from getting hotter and
hotter? If you park your car in the sun it will heat up.
But there is a limit to how hot it will get. Why is that?
It might be helpful when talking about energy balance to think of a
bank account. If you periodically deposit money into your account
why doesn't the balance just grow without limit. The answer is
that you also take money out of the account and spend it. The
same is true of energy and the earth. The earth absorbs incoming
sunlight energy but also emits energy back into
space (the orange and pink arrows in the figure below). Energy is
being emitted by both the surface of the earth and the atmosphere.
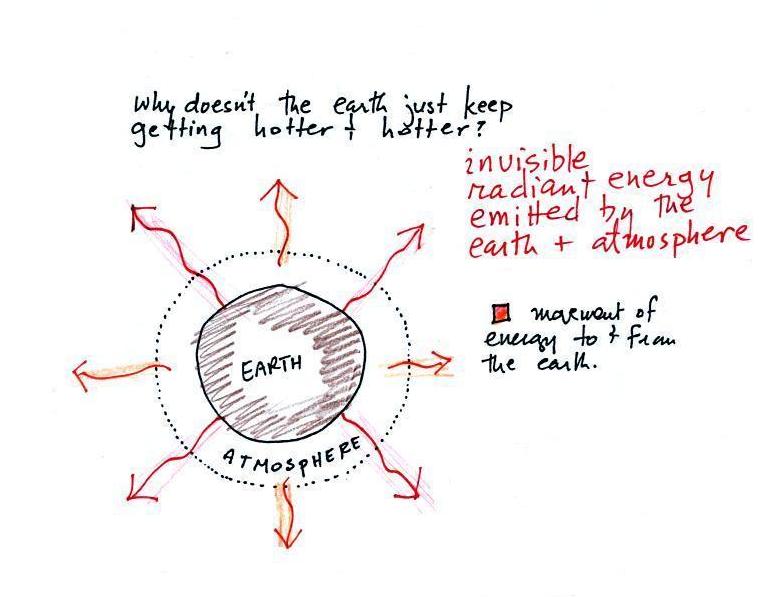
Energy is emitted in the form of
infrared light is an
invisible form of energy (it is weak enough that we
don't usually feel it either). A balance
between incoming and outgoing energy is achieved and the earth's annual
average temperature remains constant.
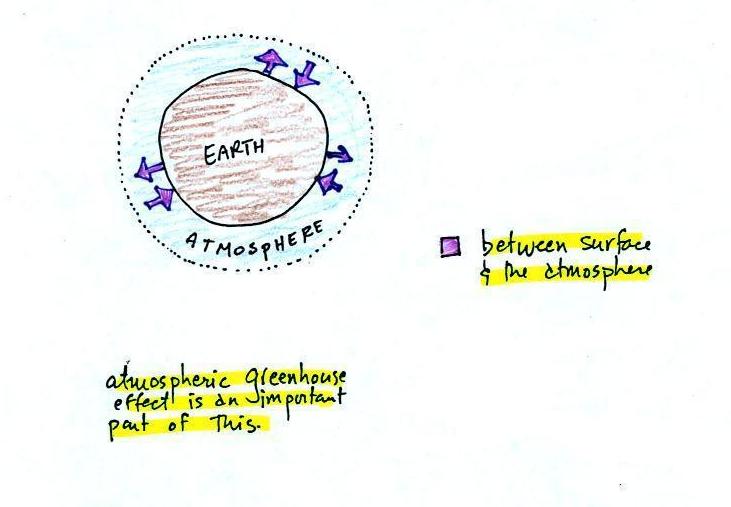
We will also look closely at energy transport between the earth's
surface and the atmosphere (see the figure below). This is where latent
heat energy transport,
convection and conduction operate (they can't transport energy beyond
the atmosphere and into outer space).
That
is
also
where
the
atmospheric
greenhouse
functions.
That
will
be
a important goal -
to
better understand how the atmospheric greenhouse effect works.
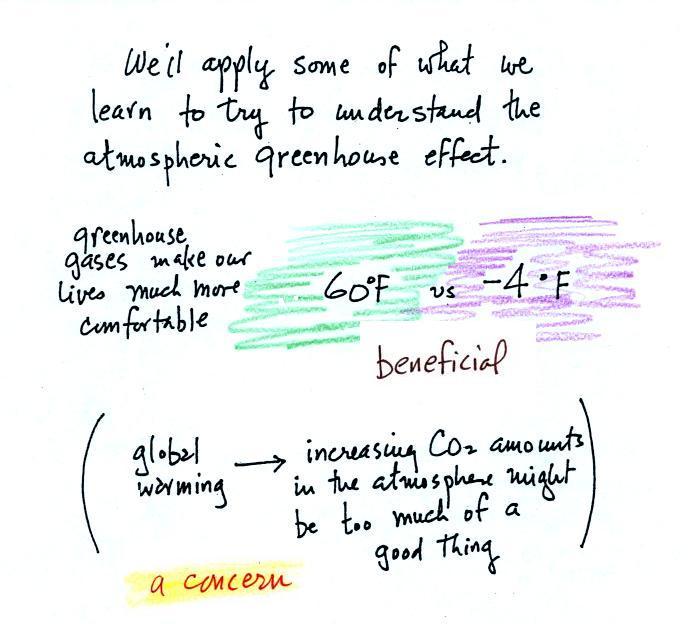
The detrimental side is that atmospheric greenhouse gas concentrations
are increasing (no real debate about that). This might enhance or
strengthen the greenhouse
effect and
cause the earth to warm (some debate here particularly about how
much warmer there might be). While that doesn't necessarily
sound bad
it could have many unpleasant side effects (lots of debate and
uncertainty about this also). That's a subject
we'll explore briefly later in the semester.
We kind of rushed through the remaining material - I apologize for
that. Here's a picture of me back in my office banging my head
against a wall which is what I do in cases like that.
I was in a hurry because I wanted to have time for an
experiment at the end of class. And then after I've hit my head a
few time I try to make amends and explain the material more clearly on
the online notes.
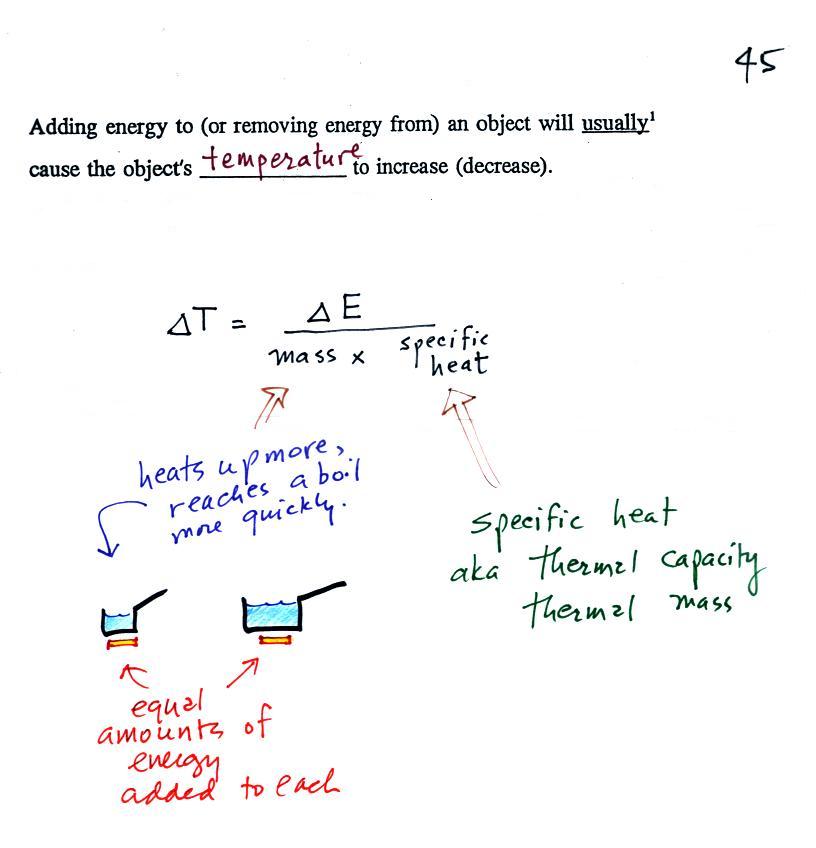
When you
add energy to an object, the object will usually
warm
up (or if you take energy from an object the object will
cool). It is relatively easy to come up with an equation that
allows
you to figure out what the temperature change will be (this is another
equation I'll write on the board before the next quiz if you
ask me to - try
to understand it, you don't have to memorize it).
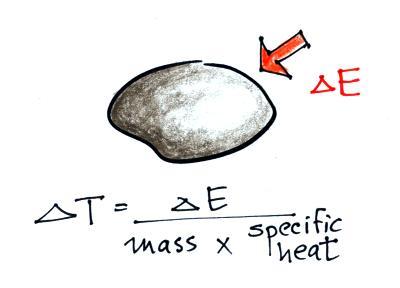
The temperature change, ΔT, will
first depend on
how much energy was added, ΔE. This is a
direct proportionality, so ΔE is in the
numerator of the
equation (ΔE and ΔT are
both positive when energy is added,
negative when energy is removed)
When you add equal amounts of energy to large and small pans
of water, the small pan will heat up more
quickly. The temperature change, ΔT, will
depend on the
amount of water, the mass. A small mass will mean a large ΔT,
so
mass
should
go
in
the
denominator
of
the
equation.
Specific heat is what we use to account for the fact that
different
materials
react differently when energy is added to them. A material with a
large specific heat will warm more slowly than a material with a small
specific heat. Specific heat has the same kind of effect on ΔT
as
mass. Specific heat is sometimes called "thermal mass" or
"thermal capacity." You can think of specific heat as
being thermal inertia - a substance with high specific heat, lots of
thermal inertia, will be reluctant to change temperature.
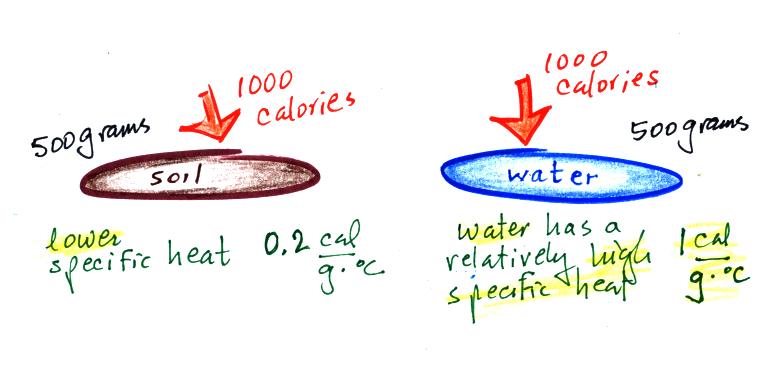
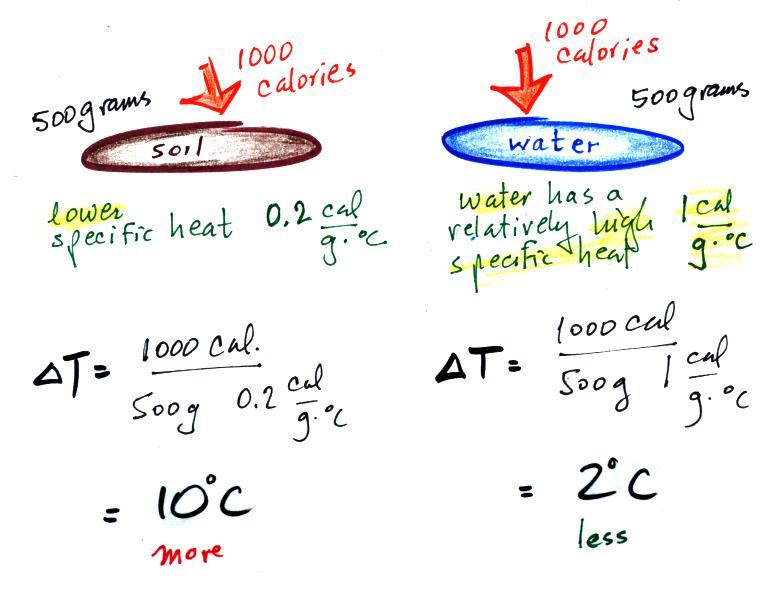
Here's an important example that will show the effect of specific
heat (middle of p. 45).
Equal
amounts of energy (1000 calories, note that calories are units of
energy) are added to
equal masses (500 grams) of water and soil. We use water and soil
in the
example because most of the earth's surface is either ocean or land.
Before we do the calculation, try to guess which material will warm up
the most. Everything is the same except for the specific
heats. Will water with its 5 times larger specific heat warm up
more or less than the soil?
Here are the details of the calculation.
With its higher specific heat, the water doesn't heat up nearly as
much as the soil. If we had been removing energy the wouldn't
cool off as much as the soil would.
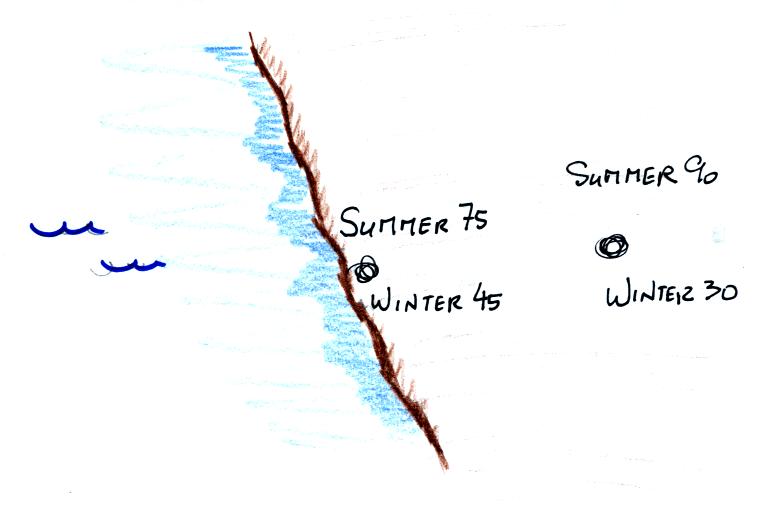
These different rates of warming of water and soil have
important effects on regional climate.
Oceans moderate the climate.
Cities near a large body
of water won't warm as much in the summer and won't cool as much during
the winter compared to a city that is surrounded by land. Water's
ΔT is smaller than land's because water has higher specific
heat.
The yearly high and low monthly average temperatures are shown at
two locations above. The city on the
coast has a 30o F annual range of temperature (range is the
difference between the summer and winter temperatures). The
city further
inland (assumed to be at the same latitude and altitude) has an annual
range of 60o F. Note that both cities have the same 60o
F annual
average temperature. We'll see a much more dramatic example of
the moderating effect of water on climate in a couple of weeks.
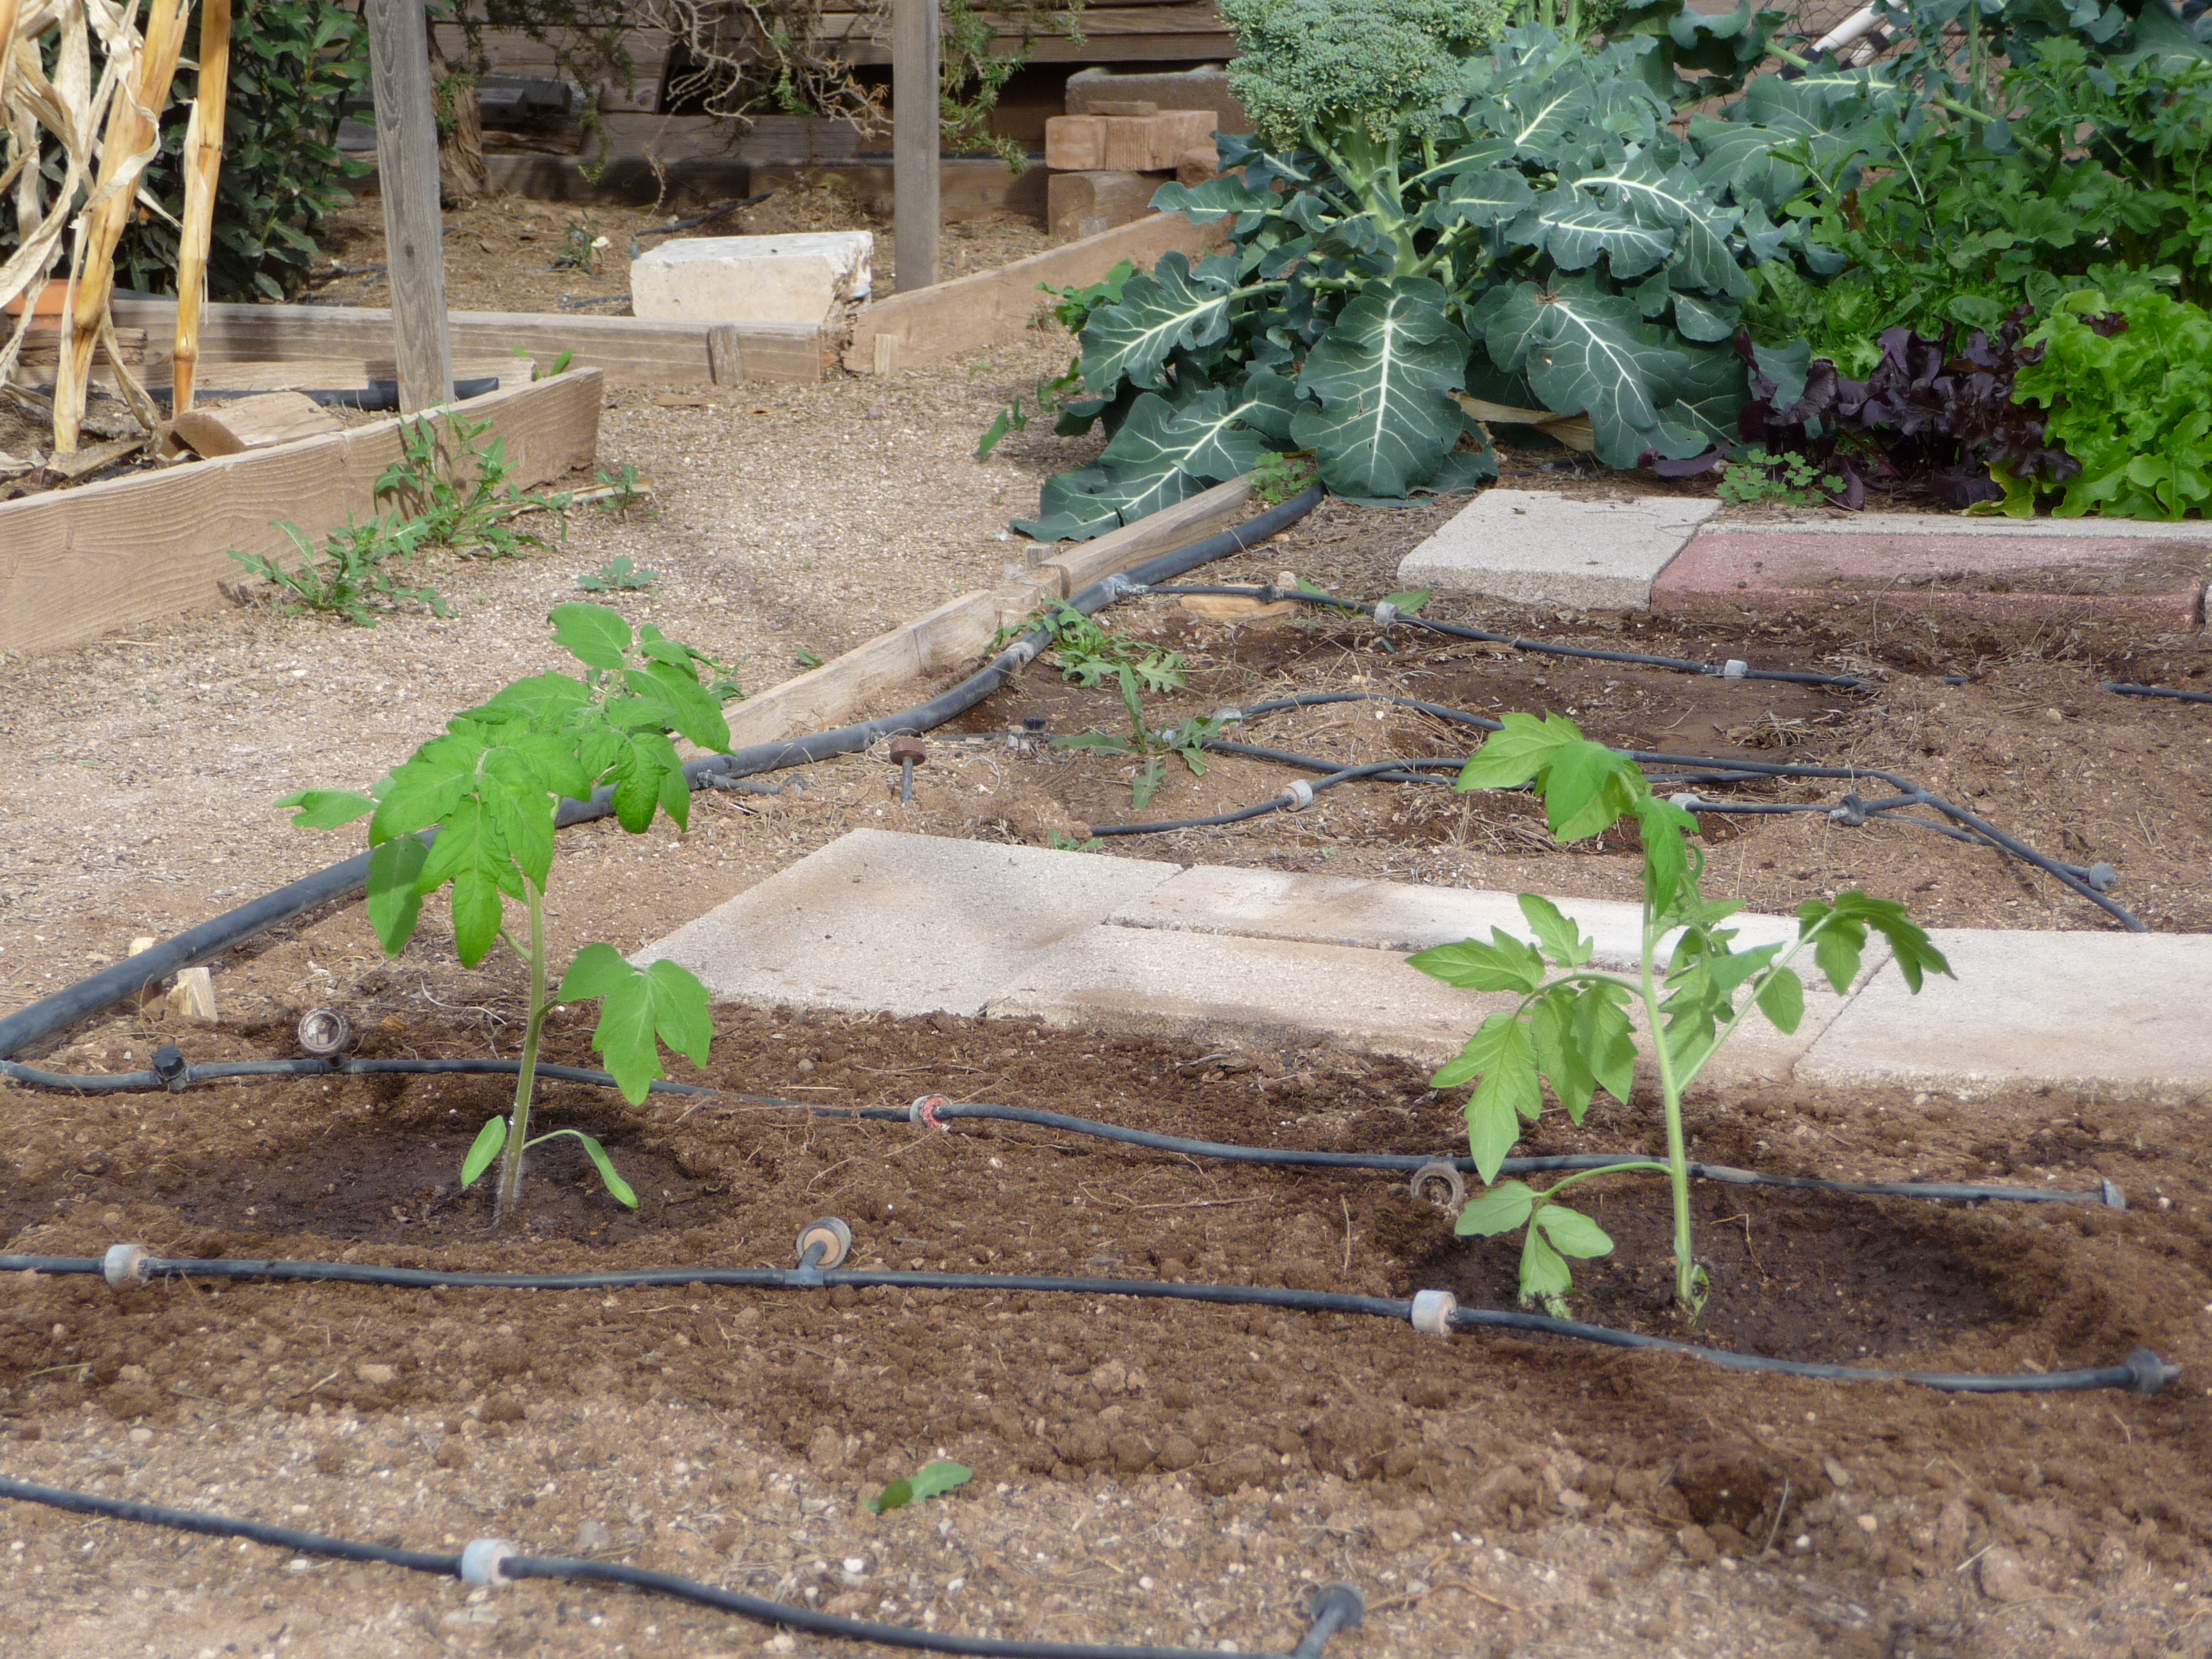
Here's another situation where you
can take advantage of water's
high specific heat to moderate "micro climate." We didn't have time
to discuss this in class.
I usually plant tomatoes in my
vegetable garden in February so that they can start to make tomatoes
before it starts to get too hot in May. In February it
can still get cold enough to kill tomatoes (the brocolli
and lettuce in the background can handle a
light frost) so you have to protect them.
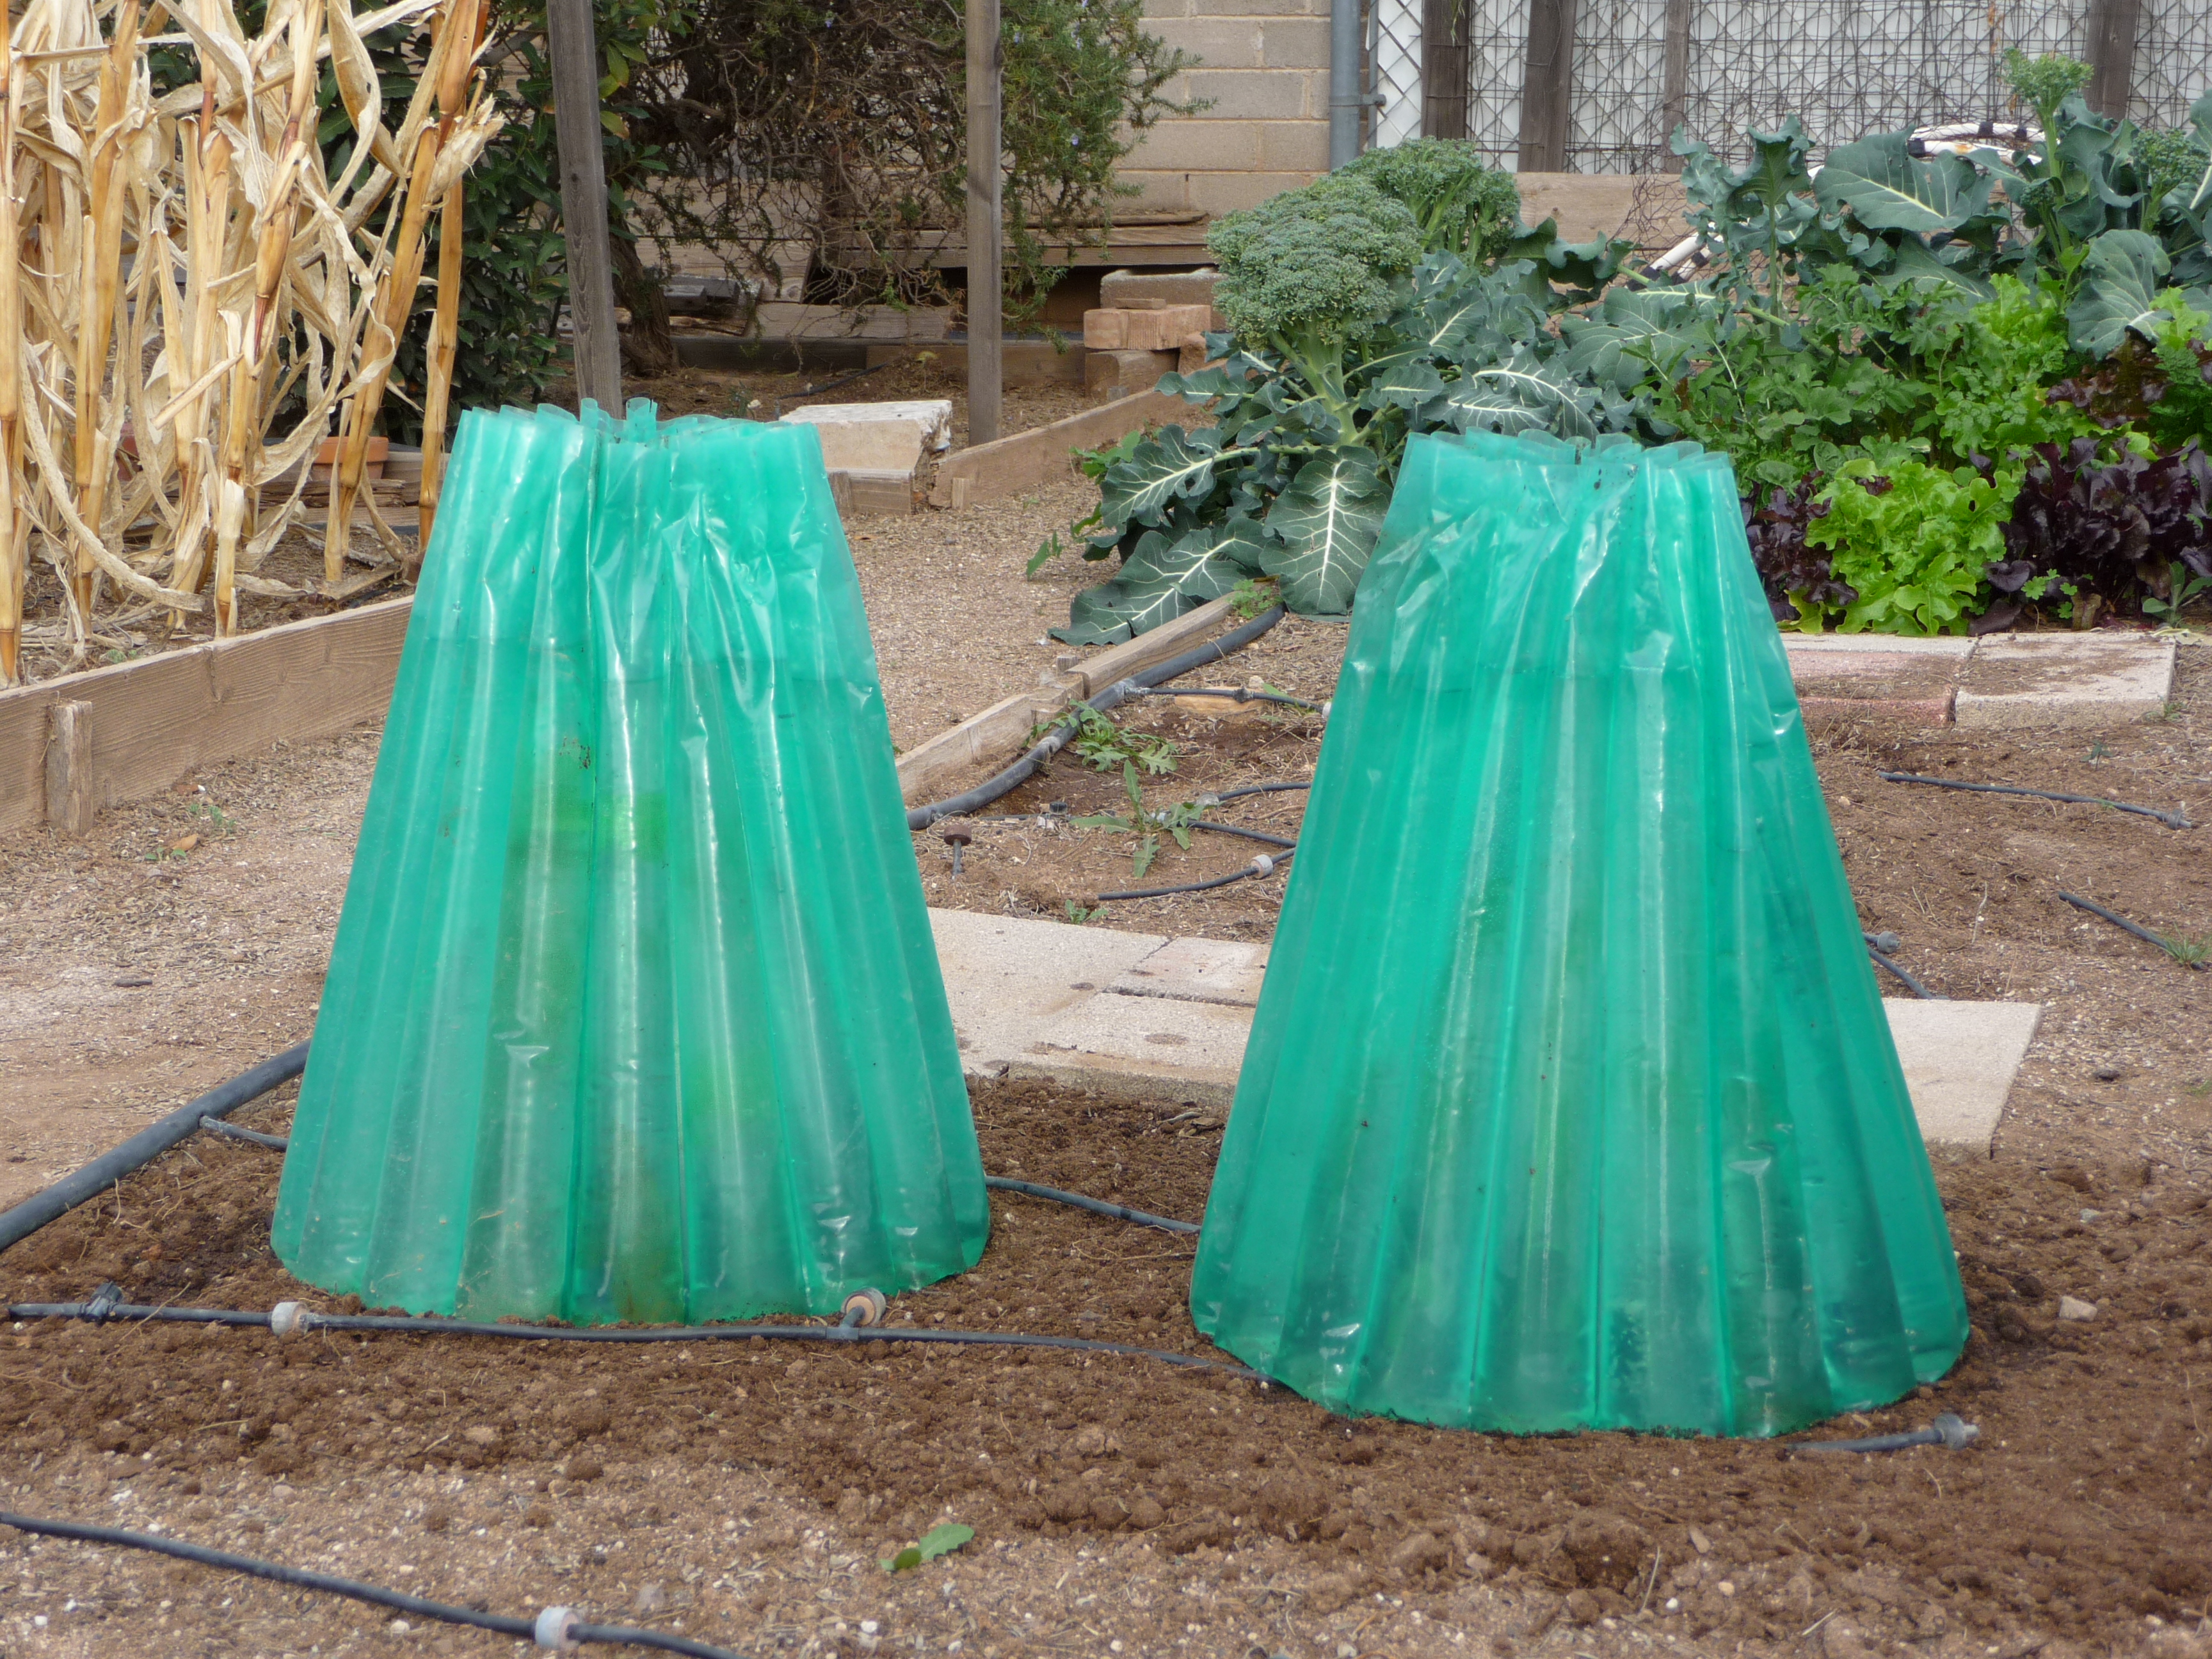
Here's one way of doing that.
You
can
surround
each
plant
with
a
"wall
o
water"
-
a
teepee
like
arrangement
that
surrounds
each plant. The cylinders are
filled with water and they take advantage of
the high specific
heat of water and won't cool as much as the air or soil would during a
cold
night. The walls of water produce a warm moist microclimate that
the tomato seedlings love. The plastic is transparent so plenty
of sunlight can get through.
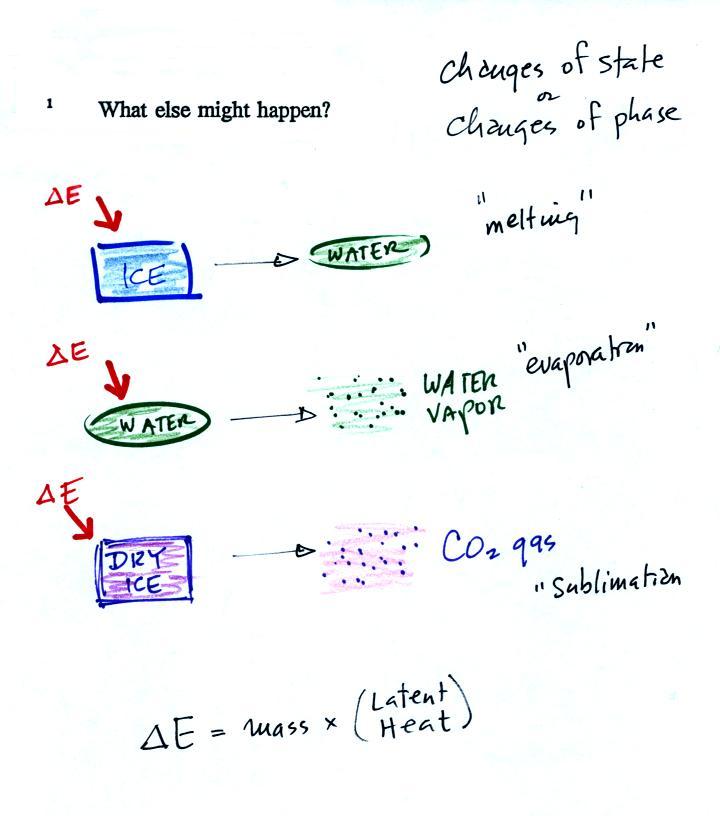
Adding
energy to an object will usually cause it to warm. But there
is another possibility (bottom p. 45), the object could change
phase (change
from solid to liquid or
gas). Adding energy to ice might cause
the
ice to melt. Adding energy to water could cause it to
evaporate. We hurried through
this a little bit in class.
The equation at the bottom of the
figure above allows you to
calculate how much energy is required to melt ice or evaporate water or
sublimate dry ice. You multiply the mass by the latent heat, a
variable that depends on the particular material that is changing
phase. The latent heat of vaporization (evaporation) is the
energy required to evaporate 1 gram of a material.
If you add energy to or remove
energy from an object, the
object
will usually change temperature. You can calculate the
temperature change if you know the object's mass and its specific
heat. That's the equation we used in the example calculation
above. It's shown again below.
We conducted an experiment in the
last part of the class and we needed to be able to measure ΔE.
We'll stick a thermometer into the object and measure any
changes in
temperature that occur.
And on to the in-class experiment. A couple of
groups of students from
the class were nice enough to volunteer
to
perform the experiment. They'll be able to
write a report about the experiment
and use the data you collected to satisfy the Experiment Report part of
the Writing Requirements. I.e. they won't have to worry about
checking out materials and doing Expt. #1, #2, or #3. A couple of
the students had done Expt. #1. I got to thinking after class
that they deserved something for their effort and I think I'll give
them each a Green Card.
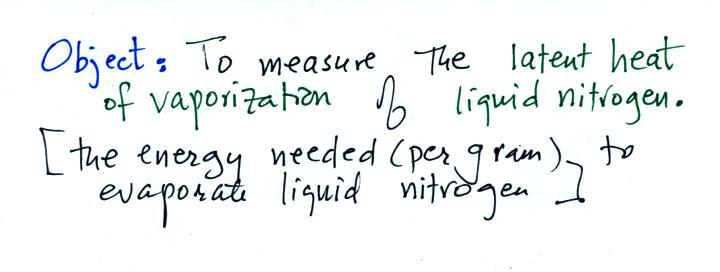
Here's the object of the experiment:
The students that are doing Experiment #2 are doing something
similar, they are measuring the latent heat
of fusion of ice, the energy needed to melt one gram of ice.
Here's the data that one of the groups collected in class.
This will be hard to figure out even after having cleaned things up a
bit after class.
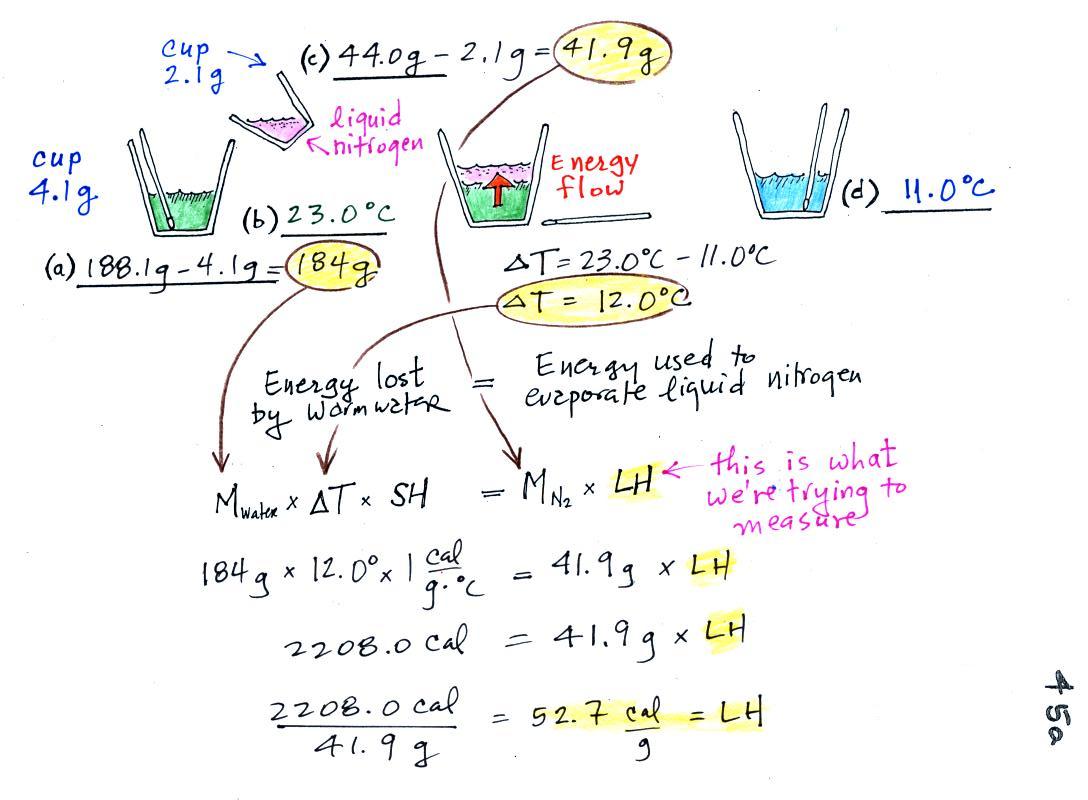
So here's a step by step
explanation of what the students did:
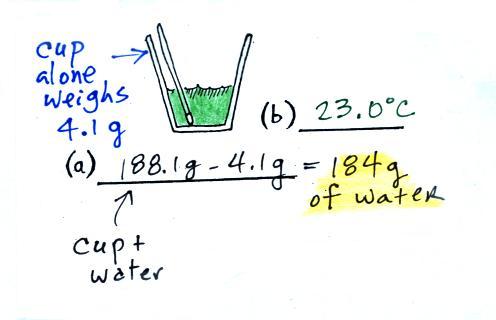
(a)
Some room temperature water poured into a styrofoam cup weighed
188.1 g. The cup itself weighed 4.1 g, so they had 184.0 g of
water. The water's temperature was measured with the
thermometer and was
23.0 C (room temperature).
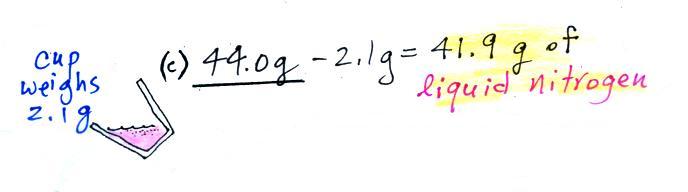
(b)
Some liquid nitrogen was poured into a second smaller styrofoam
cup. That weighed 44.0 g. Subtracting the 2.1 g weight of
the cup means we had 49.1 g of liquid nitrogen.
We don't need to measure the temperature of the liquid nitrogen
(doing so would probably destroy the thermometer). It had already
warmed up as much as it ccould ( to -320 F or something like
that). Any
additional energy added to the liquid nitrogen will cause it to
evaporate.
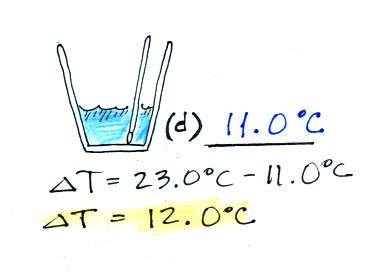
(c)
After the liquid nitrogen had evaporated the water's
temperature was remeasured. It had dropped to 11.0 C.
We started out with water that was 23.0 C, so that is a temperature
drop of 12.0 C.
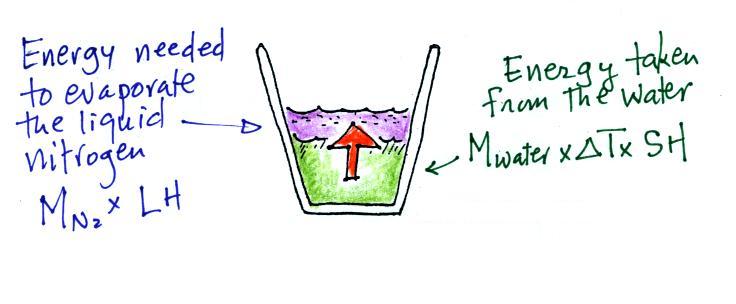
It takes energy to turn liquid nitrogen into nitrogen gas.
The energy needed will be taken from the water (the red arrow below,
energy naturally flows from hot to cold).
Because the experiment was performed in an insulated sytrofoam cup we
will assume all of the energy taken from the water is used to evaporate
nitrogen. Minimal energy flows into the room air or anything like
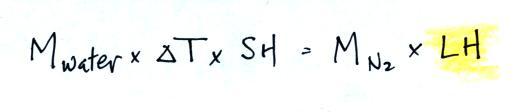
that. We will set the two equations above equal to each
other. This is an energy balance equation.
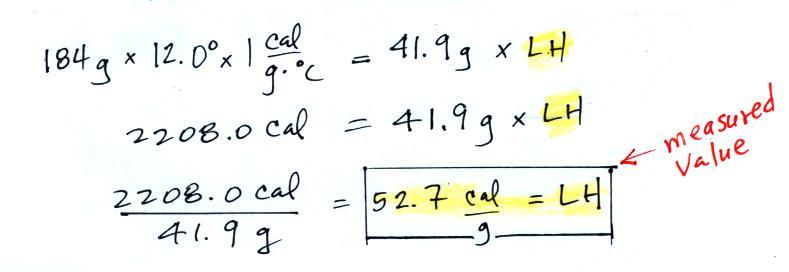
We know the mass of the nitrogen that we started with and that was
eventually evaporated (41.9 g) and the mass of the water (184.0
g). We measured the ΔT (12.0 C) and we
know the specific heat of water (1 cal/g C). We substitute them
into the equation above and solve for LH, the latent heat of
vaporization of liquid nitrogen. Here are the details of the
calculation:
A
responsible & trustworthy student in
the class (though not a Buddhist monk it turns out) informed us that
the known value is 48 cal/g, so this measured value is pretty close to
the known value.