Tue., Nov. 18, 2014
3 maybe 4 selections from the following before class today:
Calexico "Mi
Vida y El Circo", "Inspiracion",
"Two Silver
Trees"; Leila Lopez "Sea and The
Mountainside", "Pick Your
Prize"; Norah Jones "Out on the
Road"
All of the Scientific Paper, Book, and Experiment reports turned
in last week have been graded and were returned today.
Revised reports (if you decide to do one, they aren't required)
are due by Tuesday Dec. 2, though if you could get them in before
Thanksgiving that would be appreciated. Keep an eye out for
a list of students that don't seem to have done a report
yet. It's getting late in the semester but there is still
time to get that work done. It's about half of your overall
writing grade.
The 1S1P reports on Fog in Tucson have been graded (nearly
everyone received full credit) and were returned today. The
1S1P Atmospheric Stability worksheet and the Optional Assignment
handed out last Thursday were collected today. There are a
couple of additional 1S1P topics that are due on Thursday this
week.
Note there is now a list of people
that have earned 45 1S1P pts (the maximum number
allowed). The list will be updated as reports are graded.
You'll also find mention of a short easy Optional Assignment
embedded in the notes.
Here's a quick review of what we covered in class last
Thursday followed by a common misconception involving the Coriolis
force
Upper level winds review
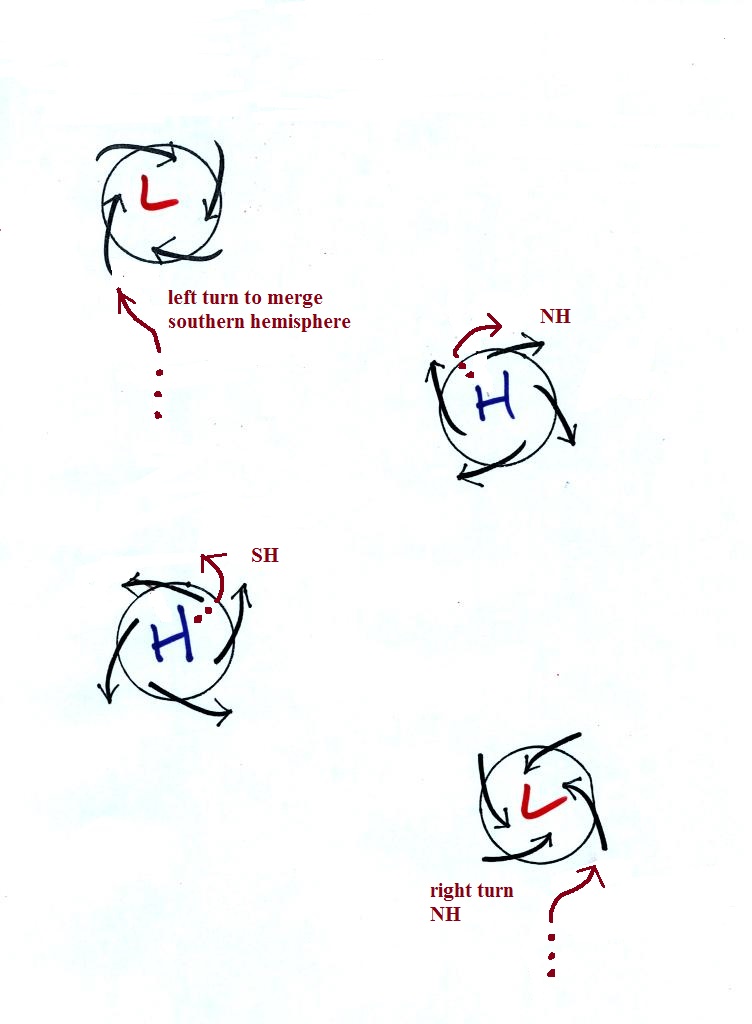
Winds spin counterclockwise around L pressure in the northern
hemisphere then switch direction and spin clockwise around L
pressure in the southern hemisphere. I think by
just remembering a couple of things you can figure this out
rather than just trying to memorize it.
Remember 1st that stationary air will start moving
toward low pressure. The dots in the figure above show
this initial movtion. Then the wind will turn to the
right or left depending on the hemisphere. This is the
effect of the Coriolis force, it turns wind to the right in
the northern hemisphere and to the left in the southern
hemisphere. The northern hemisphere winds are
shown at left in the figure above, the southern hemisphere
winds are shown at right. The inward pointing force is
always stronger than the outward force so that there is a
net inward pointing force.
The same approach can be used with H pressure. The
initial motion is again toward L pressure which is on the
outside of the picture. The winds move away from the
center then turn to the right or left depending on the
hemisphere.

The left figure above shows winds blowing around H pressure in
the northern hemisphere.
You might have heard that water spins in a
different direction when it drains from a sink or a toilet
bowl in the southern hemisphere than it does in the northern
hemisphere. You might also have heard that this is due
to the Coriolis force or the Coriolis effect.
The Coriolis force does, as we have seen, cause winds to
spin in opposite directions around large scale high and low
pressure centers in the northern and southern
hemisphere.
Situations where the PGF is stronger than
the Coriolis force
There are situations, though, where the PGF is much stronger
than the CF and
the CF can be ignored. A tornado is an
example. Spinning water draining from a sink or toilet
is another. The PGF is much much stronger than the CF
and the CF can be ignored.
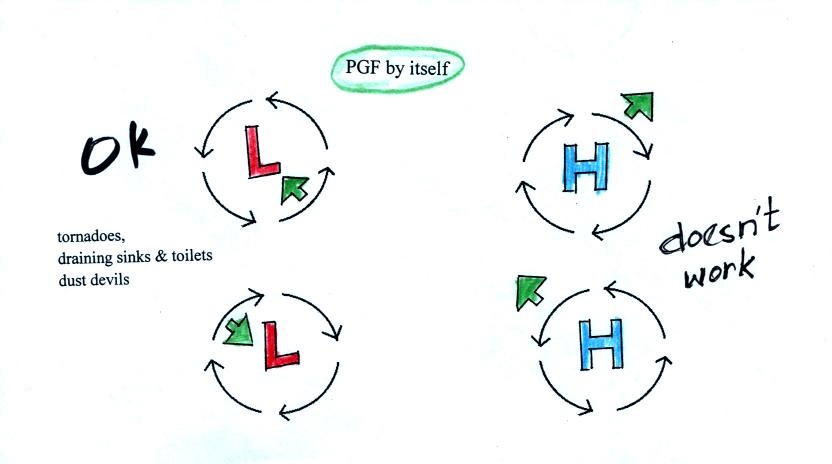
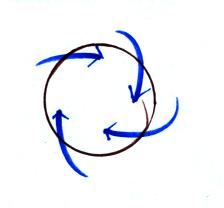
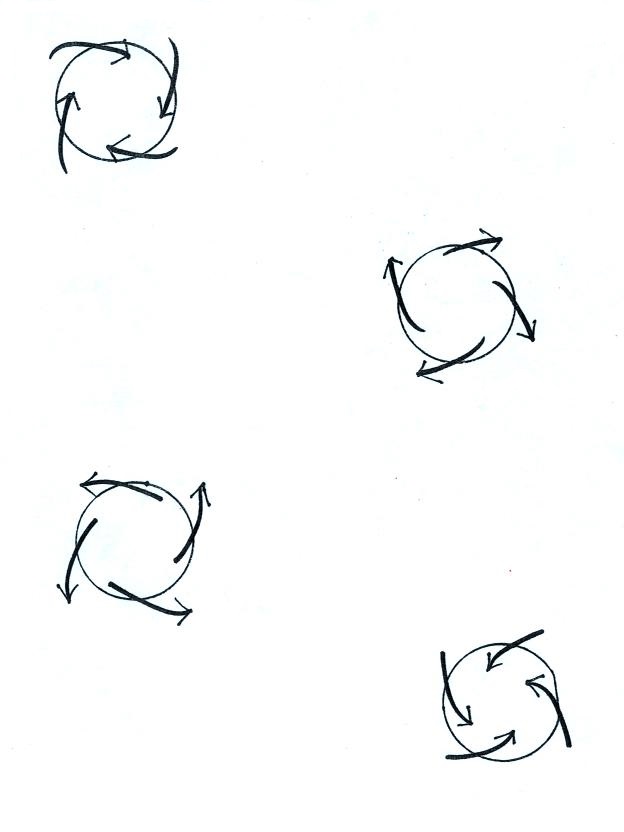
He we have clockwise and
counterclockwise spinning motions around both H and L
pressure. The direction of the PGF is shown in all
four cases (the PGF always point toward L pressure).
Remember you need an inward pointing force in order to
keep something moving in a circular path. The PGF
can provide this needed force so either clockwise or
counterclockwise motion is possible around L
pressure.
Spinning motion around H pressure isn't possible when just
the PGF is present because there isn't any inward pointing
force.
Water
draining from a sink or toilet - direction of
spin
This is what happens when water drains from a sink
or toilet. The water can spin in either
direction in either hemisphere. It might not
be obvious though what causes the inward pointing
PGF in the case of spinning water.
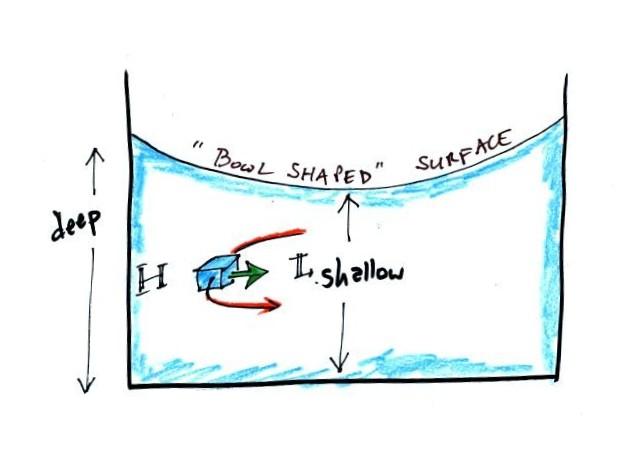
If you look carefully
at some spinning water you'll notice the surface has a
"bowl" or "funnel" shape as sketched above. The
water at the edges is a little deeper. That
additional water has more weight and produces more
pressure. The water in the middle is shallower,
doesn't weigh as much and the pressure is lower.
Thus there is a PGF pointing from the edges into the
center of the vortex.
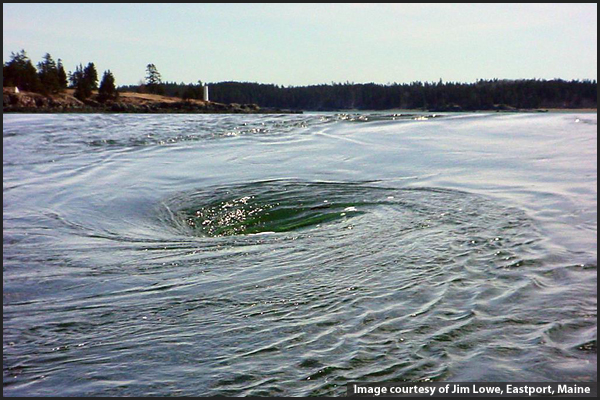
Here's a picture of the "Old Sow" whirlpool in the Bay of
Fundy it is apparently the largest whirlpool in the Western
Hemisphere (source).
We can check out this idea that water can spin in either direction
when draining from a sink or toilet with an Optional
Experiment/Assignment.
Basically you'll need to find and flush a toilet and watch what
direction the water spins. Then report your observation back
to me by midnight this 5 pm Friday, Nov. 21 (you'll need to send
me an email). Please let me know which class section you are
in (8 am = Sect. 2, 9:30 am = Sect. 3). I'll tabulate the
results and let you know how things turn out next week.
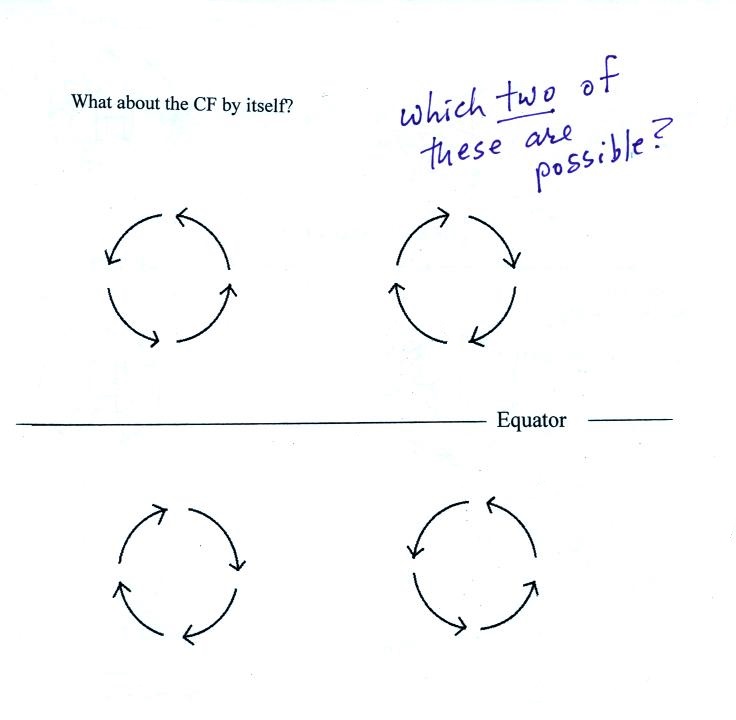
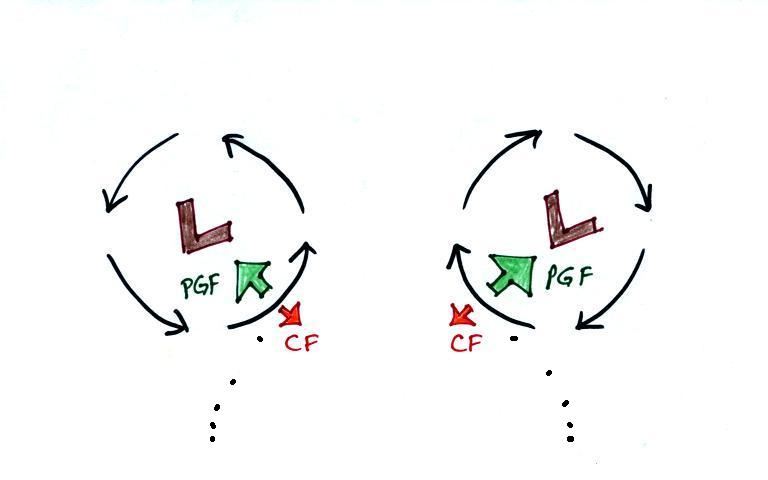
What if just the Coriolis force were present?
The following figure was on the back of the class handout.
You'll find the answer at the end of today's notes.
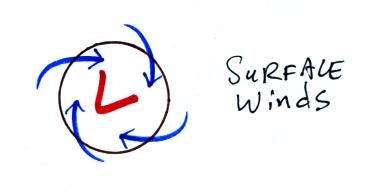
Surface winds - H and L pressure, N and S hemispheres
Before we leave this topic and move onto thunderstorms, here's a
little more information about surface winds.
What information could you add to the figure above. Does
it show surface or upper level winds? Are these winds
blowing around H or L pressure. These are pretty easy
questions to answer.
You need to remember that surface winds blow across the contours
always in the direction of low pressure
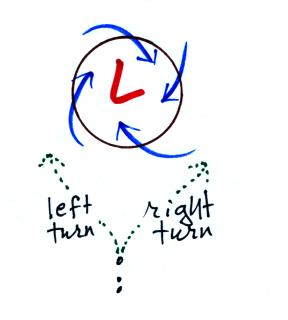
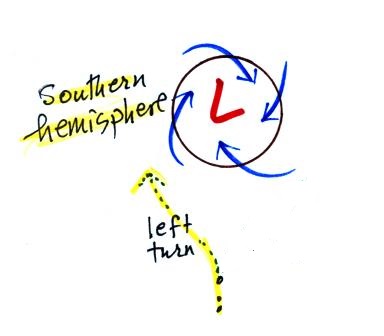
Is this a northern or southern hemisphere situation? This is
also pretty easy to figure out also.
Imagine you're approaching the low pressure center and want to
merge with the existing winds (kind of like approaching a traffic
circle in your car and wanting to merge with the traffic that is
already there). Would you need to turn to the left or the
right as you approach? I think it's pretty clear you'd need
to turn left. So in addition to remembering that surface
winds blow across the contours always toward low pressure if you
remember that the Coriolis force acts to the left of the wind in
the southern hemisphere and to the north of the wind in the
northern hemisphere you can quickly figure out this is a southern
hemisphere map.
Here are all the surface wind examples.
See if you can figure which of these are L
pressure and which are H pressure? Then determine
whether each is a northern or southern hemisphere picture.
Thunderstorms
Here's a little bit of an introduction (found on p. 150 in the
ClassNotes)
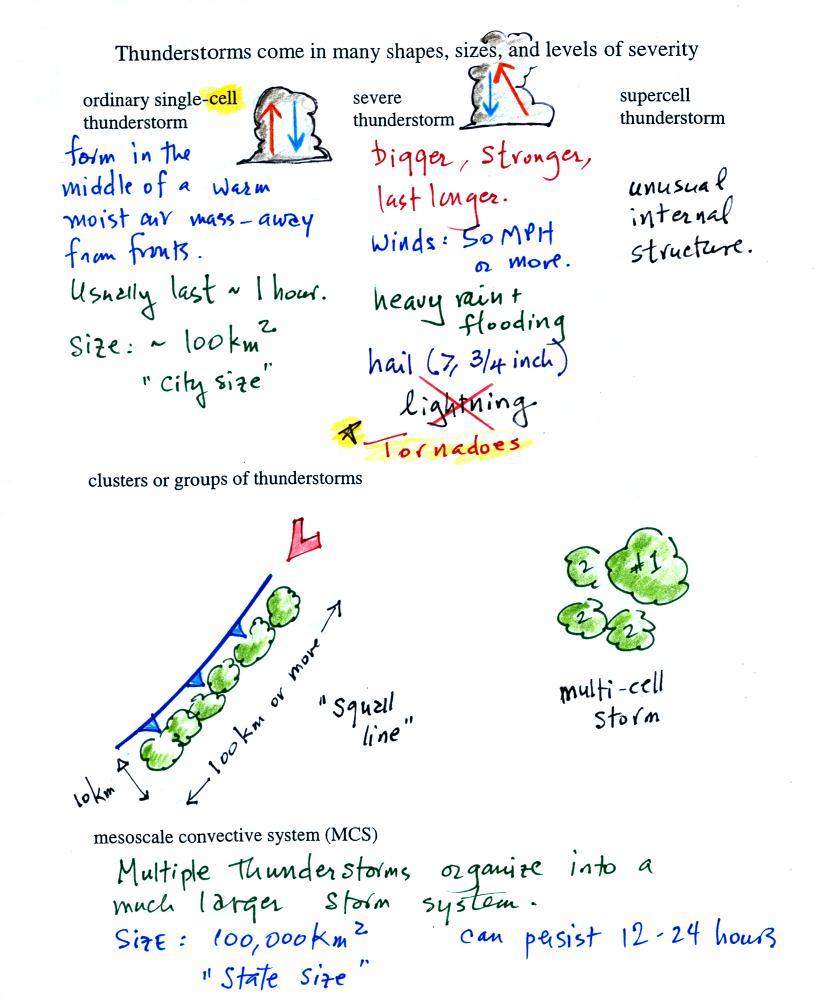
Thunderstorms come in different sizes and levels of
severity. We will mostly be concerned with ordinary
single-cell thunderstorms (also referred to as air mass
thunderstorms). They form in the middle of warm moist air,
away from fronts. Most summer thunderstorms in Tucson are
this type. An air mass thunderstorm has a vertical
updraft. A cell is just a term that means a single
thunderstorm "unit" (a storm with an updraft and a downdraft).
See image #9 in the gallery mentioned below.
Tilted updrafts are found in severe and supercell
thunderstorms. As we shall see this allows those storms to
get bigger, stronger, and last longer. The
tilted updraft will sometimes begin to rotate. We'll see
this produces an interesting cloud feature called a wall cloud and
maybe tornadoes. Supercell thunderstorms have a
complex internal structure; we'll watch a short video at
some point that shows a computer simulation of the complex air
motions inside a supercell thunderstorm. In class
I showed a gallery of
storm images that were taken by Mike Olbinski. The
first image in the gallery shows the base of a supercell
thunderstorm photographed in Texas. Image #8 shows a
somewhat smaller supercell that formed in Arizona.
We won't spend anytime discussing mesoscale convective systems
except to say that they are a much larger storm system. They
can cover a large portion of a state. They move slowly and
often thunderstorm activity can persist for much of a day.
Occasionally in the summer in Tucson we'll have activity that
lasts throughout the night. This is often caused by an MCS.
The following somewhat tedious material was intended to prepare
you to better appreciate a time lapse video movie of a
thunderstorm developing over the Catalina mountains. I don't
expect you to remember all of the details given below. The
figures below are more carefully drawn versions of what was done
in class.
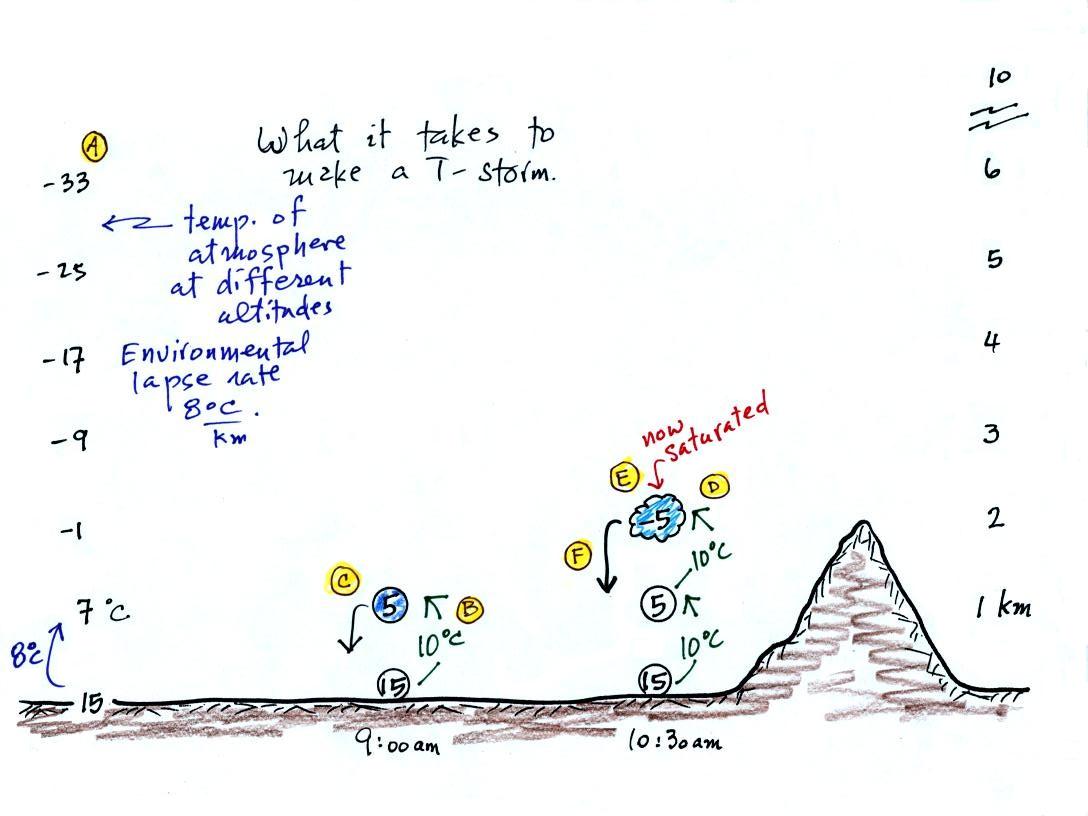
Refer back and forth between the lettered points in the
figure above and the commentary below.
The numbers in Column A
show the temperature of the air in the atmosphere at various
altitudes above the ground (note the altitude scale on the right
edge of the figure). On this particular day the air
temperature was decreasing at a rate of 8 C per kilometer.
This rate of decrease is referred to as the environmental lapse
rate (lapse rate just means rate of decrease with altitude).
Temperature could decrease more quickly than shown here or less
rapidly. Temperature in the atmosphere can even increase
with increasing altitude (a temperature inversion).
At Point B, some
of the surface air is put into an imaginary container, a
parcel. Then a meteorological process of some kind lifts the
air to 1 km altitude (in Arizona in the summer, sunlight heats the
ground and air in contact with the ground, the warm air becomes
buoyant - that's called free convection). The rising air
will expand and cool as it is rising. Unsaturated air (RH
is less than 100%) cools at a rate of 10 C per
kilometer. So the 15 C surface air will have a temperature
of 5 C once it arrives at 1 km altitude.
Early in the morning "Mother Nature" is only able to lift the
parcel to 1 km and "then lets go." At Point C note that the
air inside the parcel is slightly colder than the air outside (5 C
inside versus 7 C outside). The air inside the parcel will
be denser than the air outside and the parcel will sink back to
the ground. You can't see this because the air is clear,
invisible.
By 10:30 am the parcel is being lifted to 2 km as shown at Point D. It is
still cooling 10 C for every kilometer of altitude gain. At
2 km, at Point E
the air has cooled to its dew point temperature, the
relative humidity is now 100%, and a cloud has formed.
Notice at Point F,
the air in the parcel or in the cloud (-5 C) is still colder and
denser than the surrounding air (-1 C), so the air will sink back
to the ground and the cloud will disappear. Still no
thunderstorm at this point.
At noon, the air is lifted to 3 km. Because the air
became saturated at 2 km, it will cool at a different rate between
2 and 3 kilometers altitude. It cools at a rate of 6 C/km
instead of 10 C/km. The saturated air cools more slowly
because release of latent heat during condensation offsets some of
the cooling due to expansion. The air that arrives at 3km, Point H, is again
still colder than the surrounding air and will sink back down to
the surface.
By 1:30 pm the air is getting high enough that it has become
neutrally buoyant, it has the same temperature and density as the
air around it (-17 C inside and -17 C outside). This is
called the level of free convection, Point J in the figure.
If you can, somehow or another, lift air above the level
of free convection it will find itself warmer and less dense than
the surrounding air as shown at Point K and will float upward to
the top of the troposphere on its own. This is really the beginning
of a thunderstorm. The thunderstorm will grow
upward until it reaches very stable air at the bottom of the
stratosphere.
This was followed by a Time
lapse video showing a day's worth of work leading eventually
to the development of a thunderstorm.
Thunderstorm
life cycle
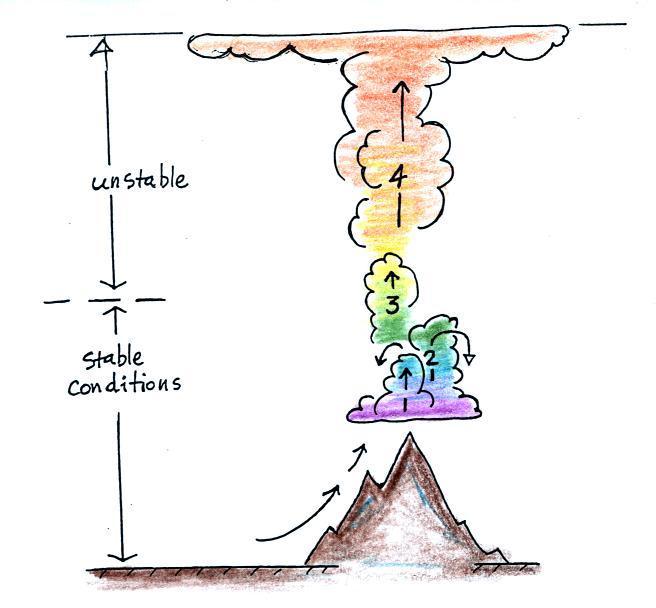
The events leading up to the initiation of a summer air mass
thunderstorm are summarized in the figure below.
It takes some effort and often a good
part of the day before a thunderstorm forms. The air must
be lifted to just above the level of free convection (the dotted
line at middle left in the picture). Once air is lifted
above the level of free convection it finds itself warmer and
less dense that the air around it and floats upward on its
own. I've tried to show this with
colors below. Cool colors below the level of free
convection because the air in the lifted parcel is colder and
denser than its surroundings. Warm colors above the
dotted line indicate parcel air that is warmer and less dense
than the surroundings. Once the parcel is lifted above
the level of free convection it becomes buoyant; this is
the moment at which the air mass thunderstorm begins.
Once a thunderstorm develops it
then goes through a 3-stage life cycle
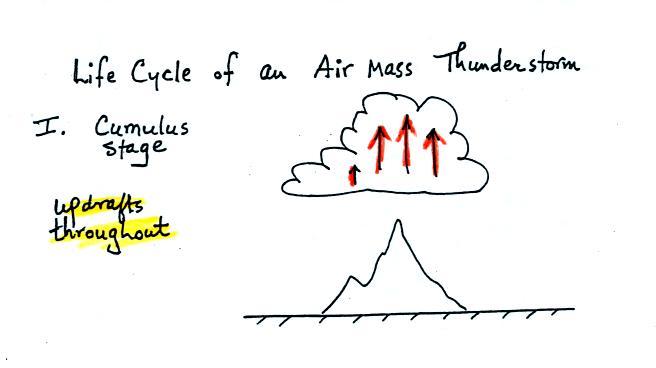
In
the first stage you would only find updrafts inside the cloud
(that's all you need to know about this stage, you don't even
need to remember the name of the stage).
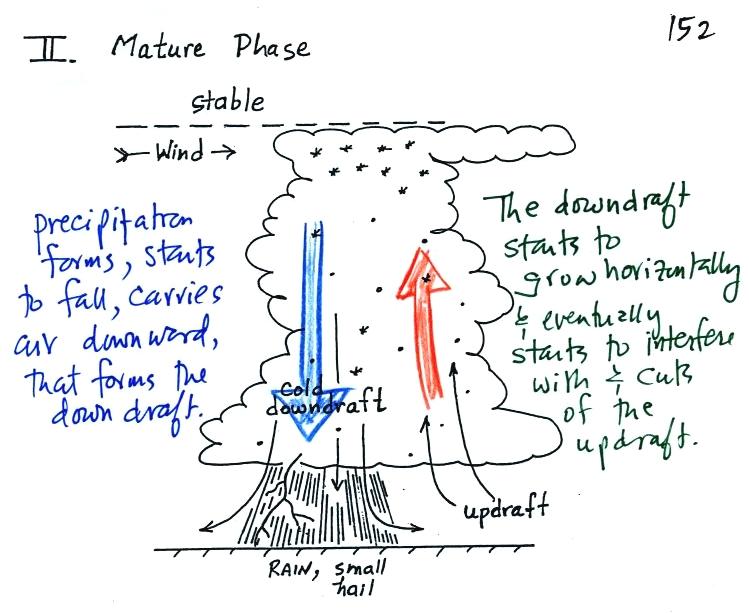
Once precipitation has formed and grown to a certain size, it
will begin to fall and drag air downward with it. This
is the beginning of the mature stage where you find both an
updraft and a downdraft inside the cloud. The falling
precipitation will also pull in dry air from outside the
thunderstorm (this is called entrainment). Precipitation
will mix with this drier air and evaporate. The
evaporation will strengthen the downdraft (the evaporation
cools the air and makes it more dense).
The thunderstorm is strongest in the mature stage. This
is when the heaviest rain, hail, strongest winds, and most of
the lightning occur.
Eventually the downdraft spreads
horizontally throughout the inside of the cloud and begins to
interfere with the updraft. This marks the beginning of
the end for this thunderstorm.
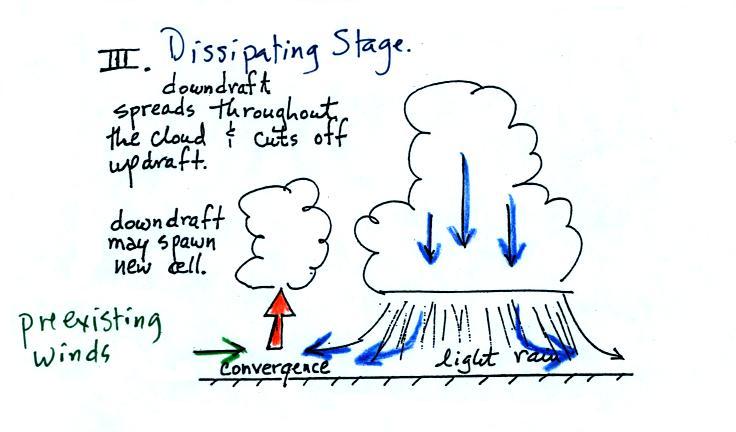
The downdraft
eventually fills the interior of the cloud. In this
dissipating stage you would only find weak downdrafts
throughout the cloud.
Note how the winds from one
thunderstorm can cause a region of convergence on one side of
the original storm and can lead to the development of new
storms. Preexisting winds refers to winds that were
blowing before the thunderstorm formed. Convergence
between the prexisting and the thunderstorm downdraft winds
creates rising air that can initiate a new thunderstorm.
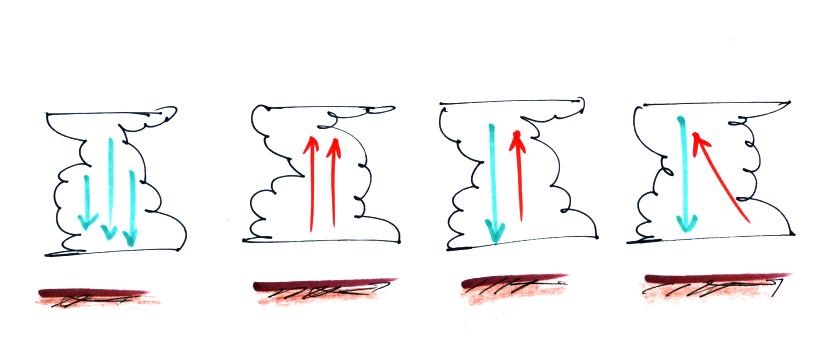
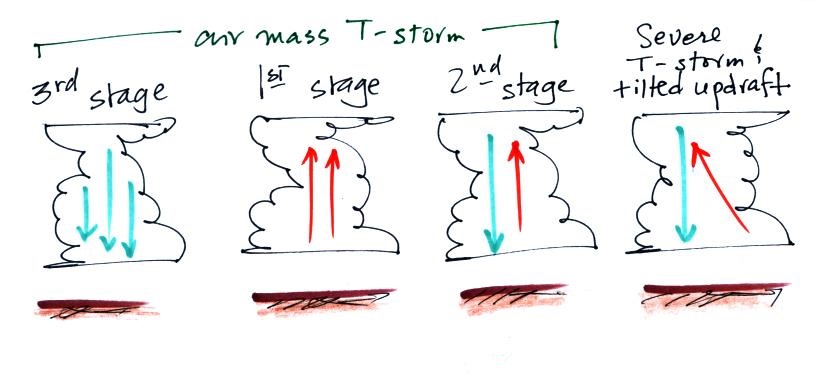
Here's a sketch of 4 thunderstorm clouds and a question: what
information could you add to each picture.
You should be able to say something about the first
three. The 4th cloud might be a bit of a puzzle.
You'll find the answer to the question at the end of today's
notes.
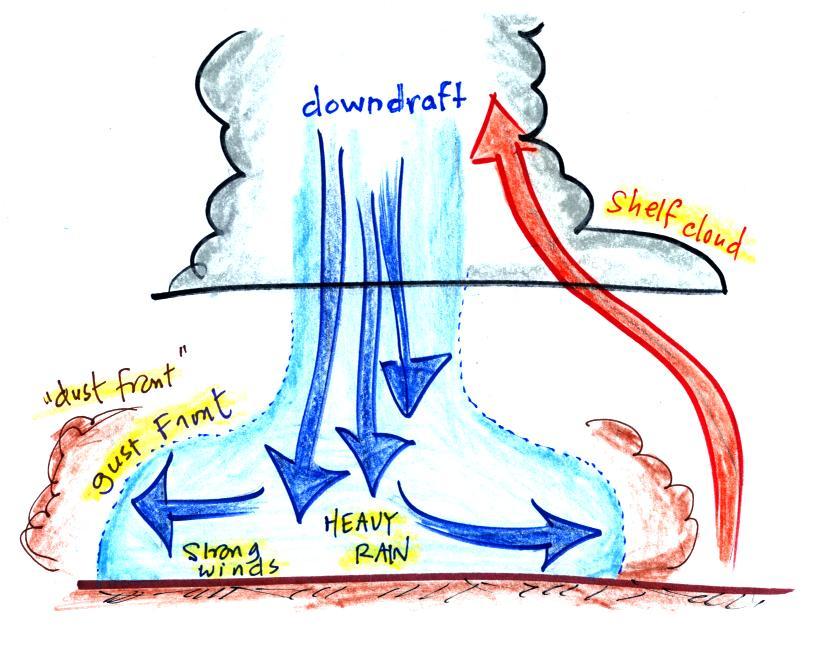
Gust fronts and the dust storms they can produce
The picture below shows some of the features at the base
of a thunderstorm.
The cold downdraft air spilling out of a
thunderstorm hits the ground and begins to move outward from underneath the thunderstorm. The
leading edge of this outward moving air is called a gust
front. You can think of it as a dust front because the
gust front winds often stir up a lot of dust here in the desert
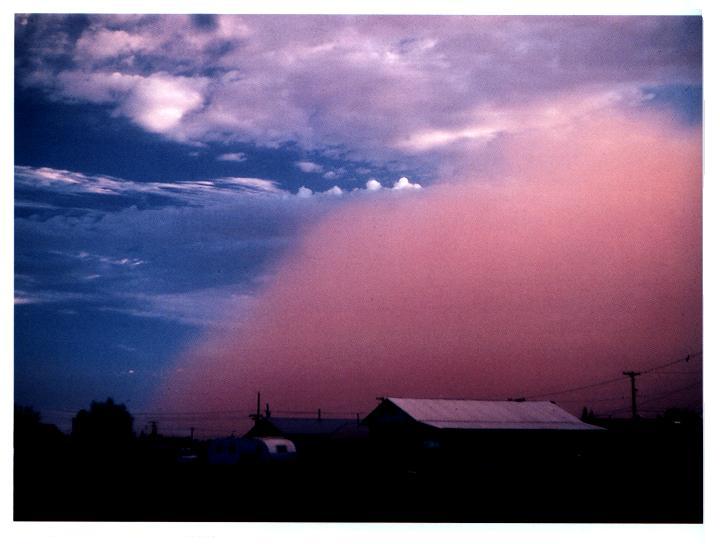
southwest (see below, a photo not
shown in class).
The gust front in this picture
(taken near Winslow,
Az) is moving from the right to the left.
Visibility in the dust cloud can drop to near zero which
makes this a serious
hazard to automobile traffic. Dust storms like this
are sometimes called "haboobs".
There's lots of video on YouTube of an impressive dust storm a
few summers ago. Here's an example
from Gilbert Arizona (July 5, 2011). You
can see day literally turn to night when the dust cloud is
overhead (start about 1:20). Here's another video of the same storm
from a different location (South Mountain). Finally a time
lapse video of the
July 5, 2011 storm taken by Mike Olbinski (click on the
Massive Haboob Hits Pheonix link) and another time lapse video of
a July 3, 2014 storm taken
by him.
Here's a video
from a summer 2012 dust storm captured from the front window
of a vehicle that drove through the storm. Check the last
minute or two of the video where visibility drops to near zero
(about 5:00 minutes into the video). Officials recommend
that you drive off the highway under conditions like this, turn
off your lights, and take your foot off the brake so that your
brake lights are not on. Otherwise someone might follow your
lights thinking you're still on the highway and run into you from
behind.
Here are answers to several
questions embedded in today's notes.
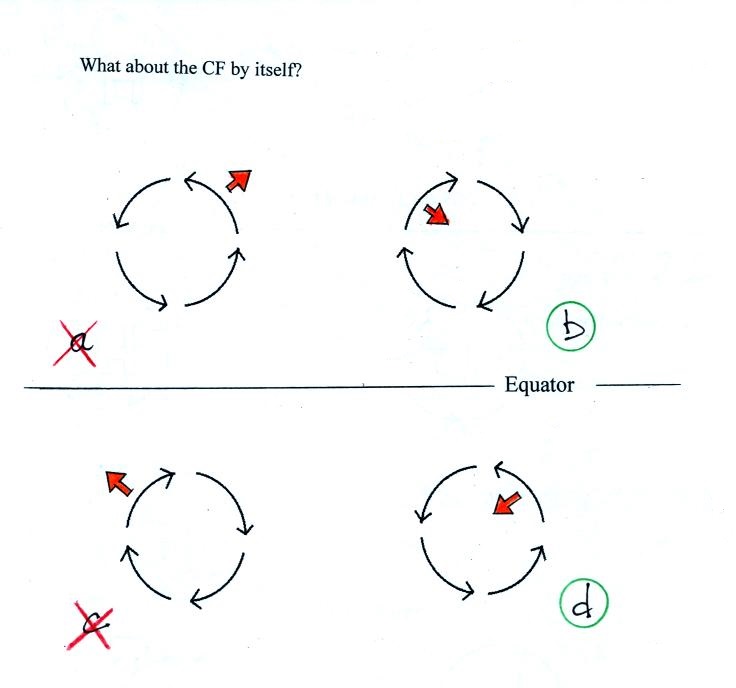
The Coriolis force is perpendicular
to the wind and to the right in the northern
hemisphere, perpendicular and to the left in the
southern hemisphere. Spinning motions would be
possible in Figs. b and d work because the
Coriolis force is pointed inward. An inward
force is needed to keep something moving in a circular
path.
Surface winds blow across the contours always in
the direction of low pressure. So determining
which of these is H and L pressure should be
easy. The figure below shows you how to go about
determining whether figure belongs in the southern or
northern hemisphere.
Rising air motions will be
found with the two centers of L pressure.
The air sinks in the middle of centers of H
pressure independent of hemisphere.
Here's the answer to another
question embedded in today's notes:
The first 3 pictures shows the different stages in
the lifetime of an air mass thunderstorm.
There's a tilted updraft in the 4th picture which is a
characteristic of a severe thunderstorm.