Thursday Nov. 20, 2014
Bicycling racing from the Tour de France (either the race to
the summit of Luz Ardiden
[between 10:50 - 21:50 on the video] or the ride from the Col d'Aubisque
to La Mongie [a longer segment from about 9:00 to 22:30])
was featured in class this morning to celebrate El Tour de Tucson
this Saturday.
The 1S1P reports on Thermal Circulations and Satellite Photographs
of Clouds were collected today. One Final 1S1P Assignment is
being prepared for students that are still in need of some points
(if you are someone in need of a lot of 1S1P pts you should
contact me).
Several students have told me they weren't able to find their 1S1P
Fog in Tucson reports. Papers from the 8 am Sect. 2
class are normally kept separate from the 9:30 am Sect. 3
class. After class I found that papers have somehow or
another become all mixed together. I'll get all of that
straightened out (and hopefully have some more 1S1P reports
graded) by next Tuesday.
There are a number of students that haven't picked up their
Experiment/Scientific Paper/Book reports. Here's a
list of reports that I have now. The deadline for
revised reports is Tue., Dec. 2, so you need to pick up your
report by next Tuesday (Nov. 25) if you plan on doing a revision.
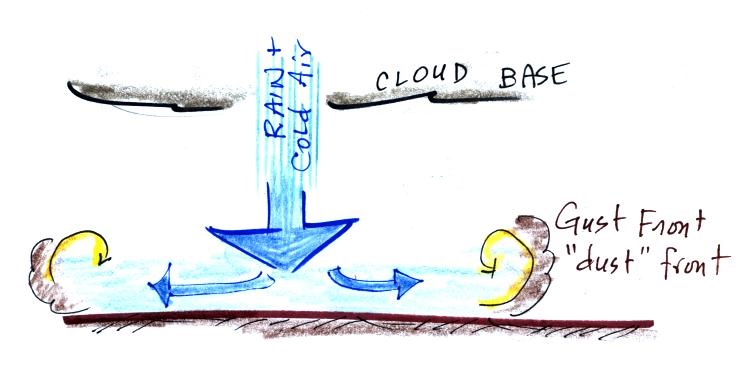
Microbursts
We were looking at the surface winds that come from thunderstorm
downdrafts on Tuesday. Our interest then was mostly the dust
clouds and dust storms stirred up by the gust front.
A narrow intense
thunderstorm downdraft is called a microburst. At the
ground microburst winds will sometimes reach 100 MPH or more
(over a limited area). As we will see later in today's
class, most tornadoes have winds of 100 MPH or less.
Microburst winds can damage homes (especially mobile homes that
aren't tied to the ground), uproot trees, and seem to blow over
a line of electric power poles at some point every summer in Tucson. Wind damage from a microburst is
often incorrectly attributed to a tornado.
Microbursts
are a serious threat to aircraft especially when they are close
to the ground during landing or takeoff. A pilot coming in
for a landing and encountering headwinds at Point 1 in the
figure below might cut back on the power. Very quickly the
plane would lose the headwinds (Point 2) and then encounter
tailwinds (Point 3). The plane would lose lift and might
lose altitude so quickly that it would crash into the ground
before corrective action could be taken. Microburst
associated wind shear was largely responsible for the crash of Delta
Airlines Flight 191 while landing at the Dallas Fort Worth
airport on Aug. 2, 1985 (caution some of the links at the end of
the article contain audio of actual cockpit communications).
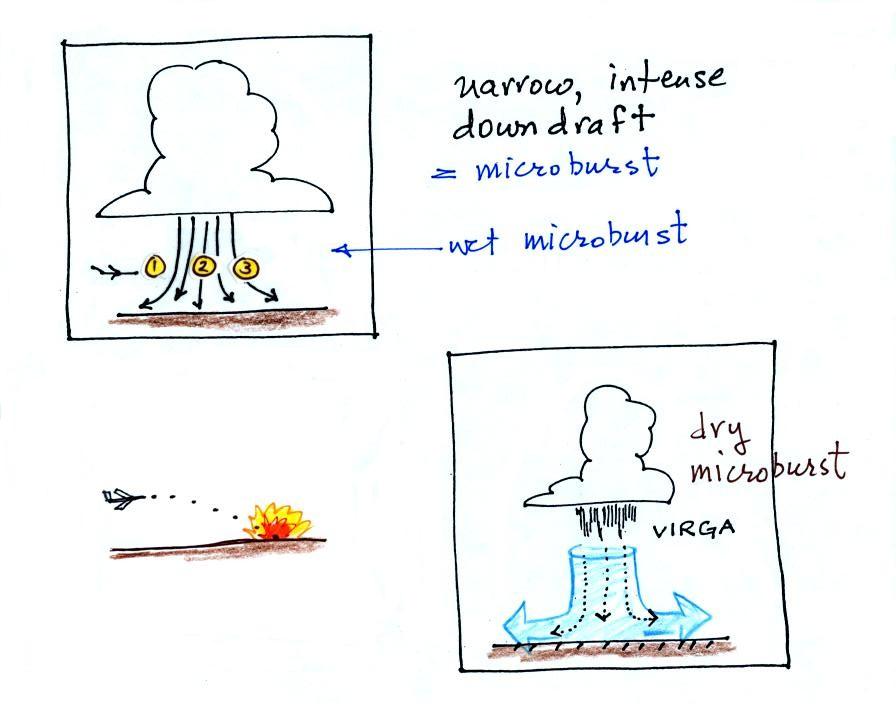
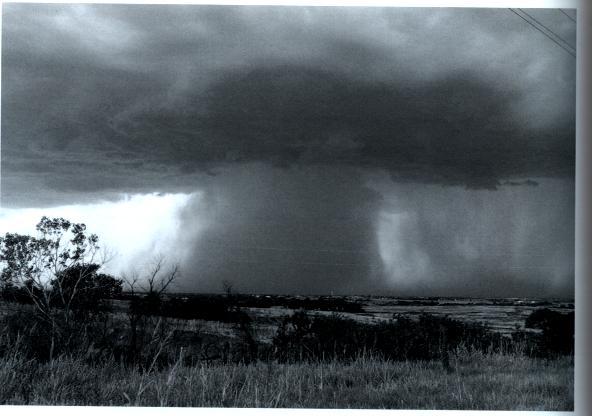
Falling rain could
warn of a wet microburst (see photo
below which was not shown in class).
In other cases,
dangerous dry microburst winds might be invisible (the virga, evaporating rain, will cool the
air, make the air more dense, and strengthen the downdraft
winds).
Here are a couple of microburst
videos. The first video
was taken in the heavy rain and strong winds under a
thunderstorm in the microburst. You'll see a power pole
snapped in half by the microburst winds at about 2:26 into the
video. I showed portions of a 2nd longer
video in class. It was taken in or near San Tan,
Arizona. The microburst doesn't look too impressive at the
start of the footage but the storm winds soon get pretty violent
(at about the 3:15 point in the video) and blew over or uprooted
several trees (6:45 into the video).
Severe thunderstorms, wind shear, mesocyclones, and
wall clouds
Next I wanted to look at some of the conditions
that can lead to severe thunderstorm formation and some of the
characteristics of these storms. Severe thunderstorms last
longer, grow bigger, and become stronger than ordinary air mass
thunderstorms. They can also produce tornadoes.
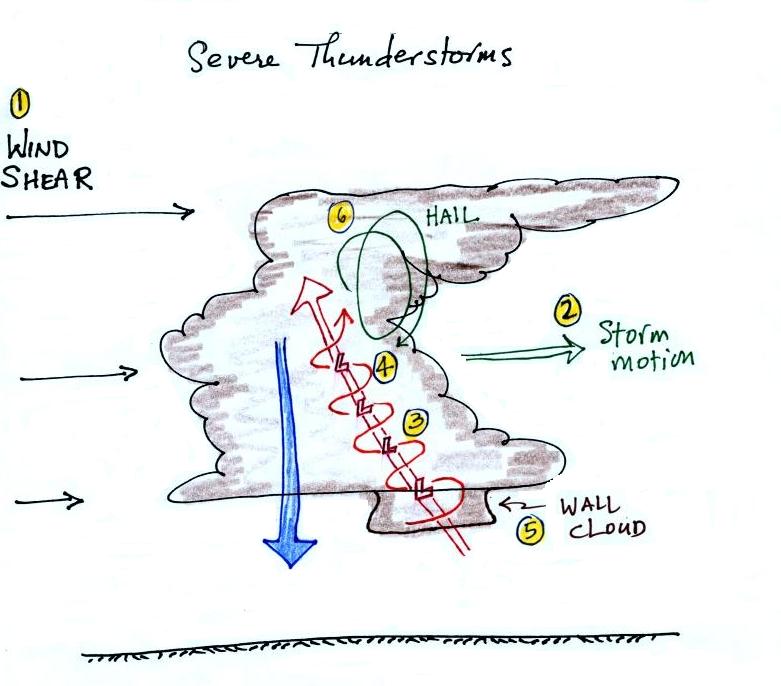
Severe storms are more likely to form
when there is vertical wind shear (the picture above is on p.
154a in the ClassNotes). Wind shear (Point 1) is changing wind
direction and/or wind speed with distance. In the case
shown above, the wind speed is increasing with increasing
altitude, this is vertical wind shear.
A thunderstorm that forms in this kind of an environment will move at an average of
the speeds at the top and bottom of the cloud (pt. 2).
The thunderstorm will move to the right more rapidly than the
air at the ground which is where the updraft begins.
Rising air that is situated at the front bottom edge of the
thunderstorm will find itself at the back edge of the storm
when it reaches the top of the cloud.
This produces a tilted updraft (pt.
3). The downdraft is situated at the back of the
ground. The updraft is continually moving to the right
and staying away from the downdraft. The updraft and
downdraft coexist and do not "get in each others way."
If you remember in air mass thunderstorms, the downdraft gets
in the way of the updraft and leads to dissipation of the
storm.
Sometimes
the tilted updraft will begin to rotate. A rotating
updraft is called a mesocyclone (pt. 4). Meso refers to medium size
(thunderstorm size) and cyclone means winds spinning around
low pressure (tornadoes are sometimes called cyclones).
Low pressure in the core of the mesocyclone
creates an inward pointing pressure gradient force needed to
keep the updraft winds spinning in circular path.
The cloud that extends below the cloud
base and surrounds the mesocyclone
is called a wall cloud
(pt. 5). The largest and strongest tornadoes will
generally come from the wall cloud.
Note (pt. 6) that a tilted updraft also
provides a way of keeping growing hailstones inside the
cloud. Hailstones get carried up toward the top of the
cloud where they begin to fall. But
they then fall back into the strong core of the updraft and
get carried back up toward the top of the cloud.
Here is a link to an exceptional time lapse video
of a supercell thunderstorm in Texas (from Mike Olbinski).
Click on Supercell near Booker, Tx at the top of the list on the
left side of the page. In time lapse you can see the
rotation of the wall cloud. If you watch closely you'll see
another interesting feature: moisture from air in the downdraft
that reaches the ground is drawn into the thunderstorm updraft
(starting at about 0:38 in the video up until the end of the first
segment of video). As it moves upward cloud begins to
form.
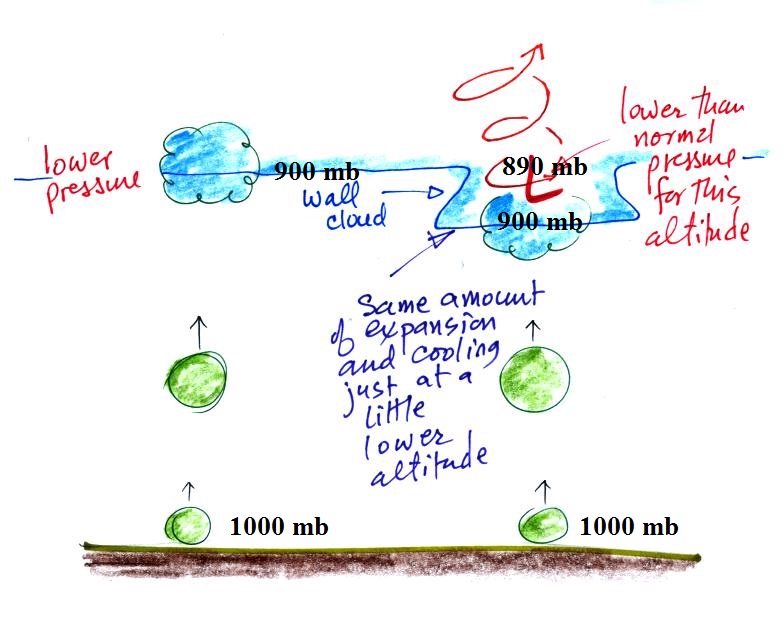
It is worth trying to understand
why the wall cloud surrounds the mesocyclone and why it extends
below the rest of the cloud.
Clouds form when
air rises, expands, and cools as shown above at
left. The rising air expands because it is moving
into lower pressure surroundings at higher altitude.
Only when the air has risen high enough, moved into low
enough pressure, expanded and cooled enough will a cloud
form. Just for the purposes of illustration we'll
assume that once air has traveled from the ground to 900
mb pressure it will have expanded and cooled enough for a
cloud to form.
Air in the center of the rotating updraft has a little
lower pressure than the air surrounding it at the same
altitude. I've assumed that the pressure in the middle
of the mesocyclone at cloud base altitude is 890 mb. In
this part of the picture 900 mb pressure is found a little bit
closer to the ground. Thus air that rises into the
rotating updraft doesn't have to go as high before it
encounters 900 mb pressure and has expanded and cooled enough
to form a cloud.
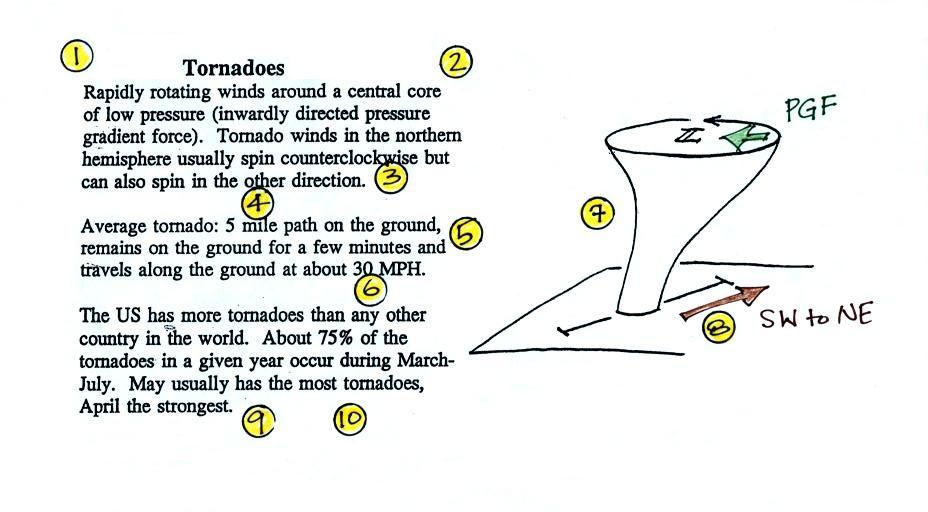
Tornadoes
Now
on to tornadoes.
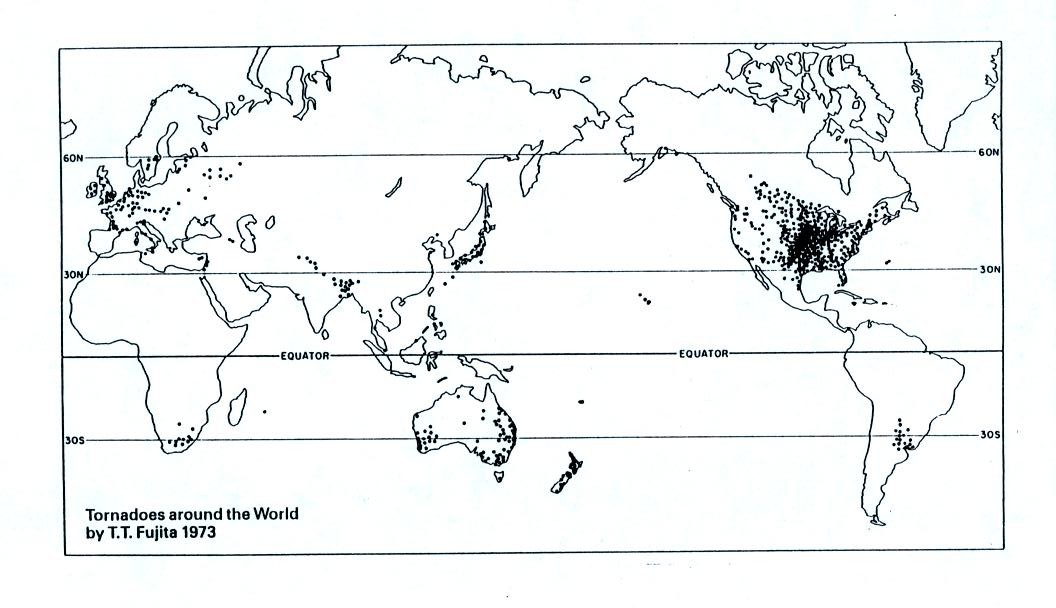
The United States has roughly
1000 tornadoes in an average
year. That is more than any
other country in the world .
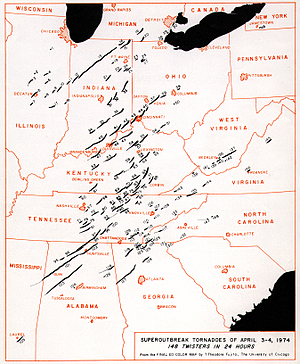
A
year's worth of tornado activity plotted
on a world map. Note the name at
bottom left: T.T. Fujita, "Mr.
Tornado." The scale used to rate
tornado strength and intensity is named
after him.
Part of the reason why the central
US
has
some
many
tornadoes
is
just a consequence of geography.
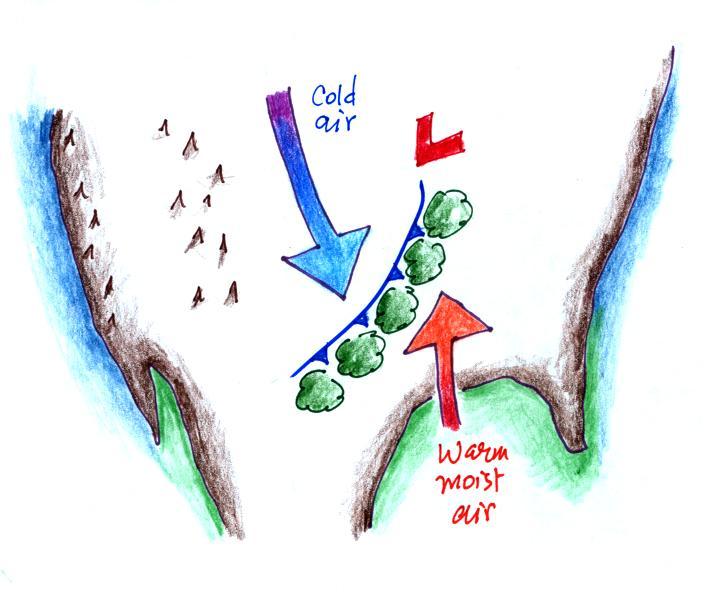
Without any mountains in
the way, cold dry air can move in the spring all the
way from Canada to the Gulf Coast. There it
collides with warm moist air from the Gulf of Mexico
to form strong cold fronts and thunderstorms.
There are some other meteorological conditions that
come into play that make these storms capable of
producing tornadoes.
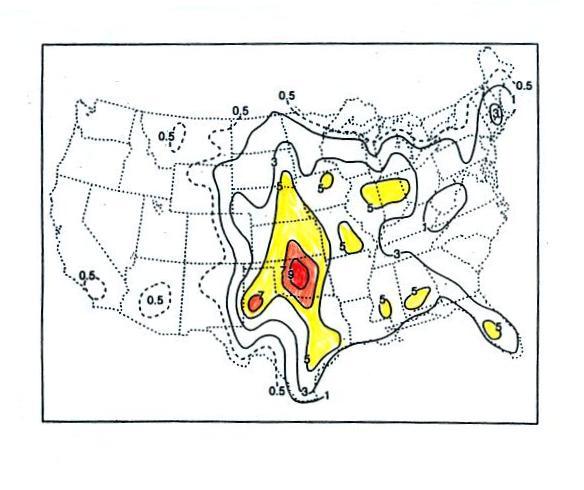
This map (found on p. 161 in the
ClassNotes) shows the average frequency of tornado
occurrence in the US. Tornadoes have been
observed in every state (including Alaska), but they
are most frequent in the Central Plains, a region
referred to as "Tornado Alley" (highlighted in red,
orange, and yellow above).
Tornado characteristics
Here are some basic tornado characteristics (the
figure above is also on p. 161)
1. About 2/3rds (maybe 3/4) of tornadoes are
F0 or F1 tornadoes (this is referring to the Fujita Scale,
which we'll learn more about on Tuesday) and have spinning
winds of about 100 MPH or less. Microburst winds can
also reach 100 MPH. Microbursts are much more common in
Tucson in the summer than tornadoes and can inflict the same
level of damage.
2. A very strong inwardly directed pressure
gradient force is needed to keep winds spinning in a circular
path. The pressure in the center core of a tornado can
be 100 mb less than the pressure in the air outside the
tornado. This is a very large pressure difference in
such a short distance. The
PGF
is
much
stronger
than
the
Coriolis
Force
(CF)
and
the
CF
can
be
neglected.
The same pressure drop can be found in strong hurricanes but
it takes place over a much larger distance. The PGF
isn't as strong and the CF does play a role.
3. Because the Coriolis force doesn't play a
role, tornadoes can spin clockwise or counterclockwise, though
counterclockwise rotation is more common. This might be
because larger scale motions in the cloud (where the CF is
important, might determine the direction of spin in a
tornado).
4, 5, 6. Tornadoes usually last only a few
minutes, leave a path on the ground that is a few
miles long, and move at a few 10s of MPH.
There are exceptions, we'll look at one shortly.
7, 8. Most tornadoes move from the SW toward
the NE. This is because tornado-producing thunderstorms
are often found just ahead of a cold front where winds often
blow from the SW. Most
tornadoes
have
diameters
of
10s
to
a
few
100s of yards but tornadoes with diameters over a mile have
been observed. Tornado diameter can also be much larger
near the base of the thunderstorm than it is near the ground.
9, 10. Tornadoes
are
most
frequent
in
the
Spring.
The
strongest
tornadoes
also
occur
at
that
time
of
year.
You
don't need to remember the specific months. Tornadoes
are most common in the late afternoon when the atmosphere is
most unstable.
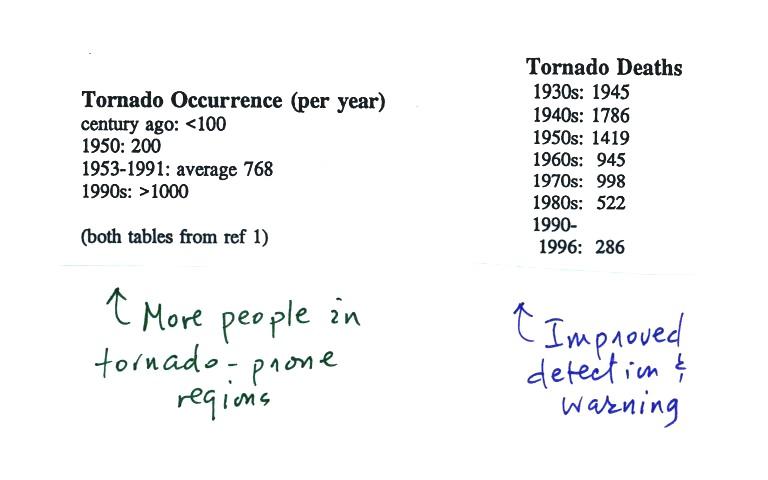
At the present time about 75 people are killed every year
in the United States by tornadoes. This is about a factor of
ten less than a century ago due to improved methods of detecting
tornadoes and severe thunderstorms. Modern day
communications also make easier to warm people of dangerous
weather situations. Lightning and flash floods (floods are
the most serious severe weather hazard) kill slightly more people
than tornadoes. Hurricanes kill fewer people on average than
tornadoes.
The increase in the number of tornadoes observed per year is
probably more due to there being more people in locations that are
able to observe and report a tornado rather than a true increase
in tornado activity.
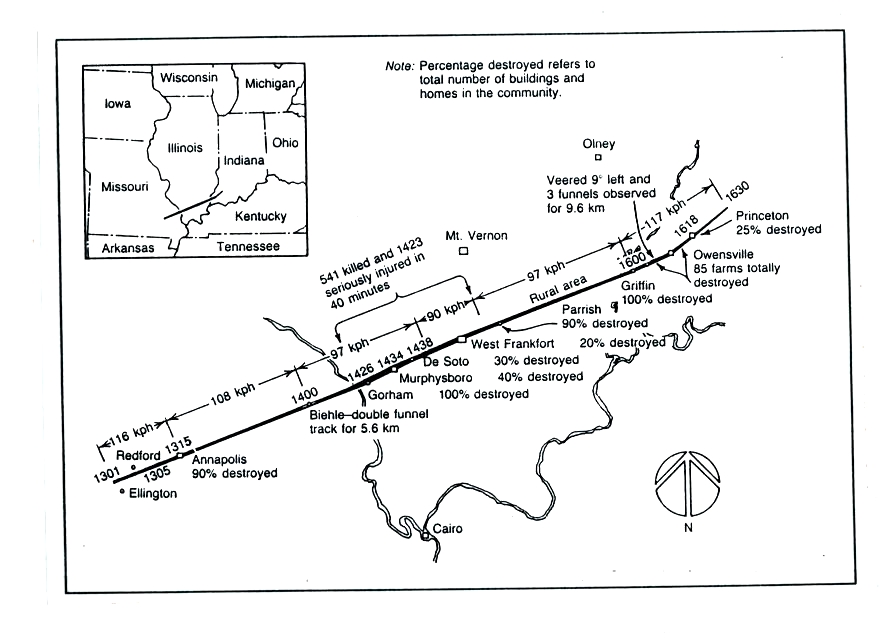
1925 Tri State Tornado
This figure traces out the path of the
1925 "Tri-State
Tornado" . The tornado path (note the SW to NE
orientation) was 219 miles long, the tornado lasted about
3.5 hours and killed 695 people. The tornado was
traveling over 60 MPH over much of its path. It is still
today the deadliest single tornado ever in the United
States (you'll find a compilation of tornado records here).
The Joplin
Missouri tornado (May 22, 2011) killed 162 people making
it the deadliest since 1947 and the 7th deadliest tornado in
US history.
Tornado
outbreaks
Tornadoes often
occur in "outbreaks." The paths of 148 tornadoes
during the April 3-4, 1974 "Jumbo
Tornado Outbreak" are shown above. Note
the first tornadoes were located in the upper left
corner of the map and all of the tornado paths are
oriented from SW to NE.
The April
25-28, 2011 outbreak is now apparently the largest
tornado outbreak in US history (358 tornadoes, 346 people
killed)
Tornado activity and tornado outbreaks in
November,
like those that occurred during the Fall semester a year ago,
are unusual. It was one of the largest November
outbreaks ever.
As we learn more about tornadoes I'm
hoping you'll look at video with a more critical eye than
you would have otherwise. So we took a moment, at
this point, to have a look at some tornadoes caught
on video. If you click on the links below you'll see
the same or a similar video that I found online. The
videos shown in class were from a tape called "Tornado
Video Classics".
The numbers in the left column identified the tornado on
the tape. The next column shows the Fujita Scale
rating (the scale runs from F0 (weakest) to F5
(strongest). The locations and date are shown
next. The last column has comments and things to
look for when watching the video segment.
Video
ID
|
Fujita
Scale
rating
|
Location
|
Date
|
Comments
|
54a
|
F3
|
Grand Isle NE
|
Mar. 13, 1990
|
tornado cloud is pretty
thick and vertical |
61f
|
F3
|
McConnell
AFB
KS
|
Apr. 26, 1991
|
this is about as close
to a tornado as you're ever likely to get. Try to
judge the diameter of the tornado cloud. What
direction are the tornado winds spinning?
|
52
|
F5
|
Hesston
KS
|
Mar. 13, 1990
|
Watch closely, you may
see a tree or two uprooted by the tornado winds
|
51
|
F3
|
North
Platte
NE
|
Jun. 25, 1989
|
Trees uprooted and
buildings lifted by the tornado winds. The online
video is longer than the one shown in class and has some
good closeup video. See especially the last couple
of minutes of the video
|
65
|
F1
|
Brainard
MN
|
Jul. 5, 1991
|
It's a good thing this
was only an F1 tornado
|
57
|
F2
|
Darlington
IN
|
Jun. 1, 1990
|
Tornado cloud without
much dust
|
62b
|
F2
|
Kansas
Turnpike
|
Apr. 26, 1991
|
It's sometimes hard to
run away from a tornado. Watch closely you'll see a
van blown off the road and rolled by the tornado.
The driver of the van was killed!
|
47
|
F2
|
Minneapolis
MN
|
Jul. 18, 1986
|
Tornado cloud appears
and disappears. The online video compares features
seen in this tornado with one created in a laboratory.
|
The online Kansas
turnpike video also has a warning that a highway underpass
is actually a very dangerous place to take shelter from a
tornado. Here is some
additional information from the Norman OK office of the
National Weather Service. Slide 6 lists some of the reasons
why underpasses are so dangerous.
Supercell thunderstorms
In the next video you'll see
1. Some additional footage of the Andover KS tornado (the
one that tore through the parking lot and the one that caught up
the people driving on an interstate highway and forced them to
seek shelter under a bridge).
2. Pictures of new and distant supercell
thunderstorms and wall clouds.
3. A computer simulation of the growth and
development of a supercell thunderstorm.
But first we need to learn a little bit about supercell
thunderstorms.
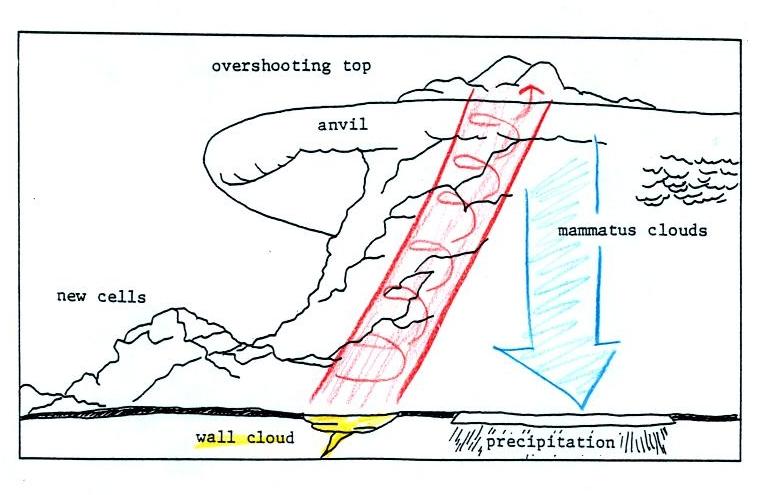
Here is a relatively simple
drawing showing some of the key features on a supercell thunderstorm (found
on p. 163 in the ClassNotes). In a supercell the rotating updraft
(shown in red above) is strong enough to penetrate a
little way into the stratosphere. This produces
the overshooting top or dome feature above. A
wall cloud and a tornado are shown at the bottom of
the mesocyclone. In
an ordinary thunderstorm the updraft is unable to
penetrate into the very stable air in the stratosphere
and the upward moving air just flattens out and forms
an anvil. The flanking line is a line of new
cells trying to form alongside the supercell thunderstorm
(similar to convergence between prexisting winds and
thunderstorm downdraft winds that can lead to new
storm development alongside a dissipating air mass
thunderstorm).
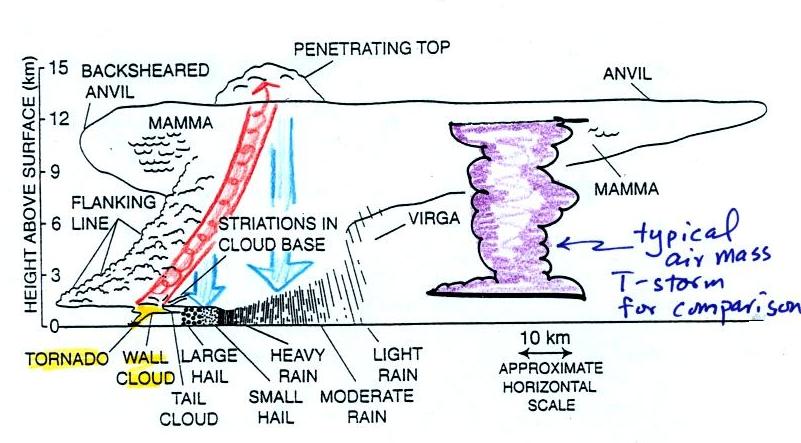
Here is a second slightly more complicated and
realistic drawing of a supercell
thunderstorm. A typical air mass thunderstorm
(purple) has been drawn in so that you can appreciated how
much larger supercell thunderstorms can be.
The video segment was shown at this point. It
showed a distant supercell thunderstorm and photographs of
the bases of nearby supercell thunderstorms. Here you
could see the spectacular wall cloud that often forms at the
base of these storms. Finally a computer simulation
showed some of the complex motions that form inside
supercell thunderstorms, particularly the tilted rotating
updraft.
I haven't been able to find the video that I showed in class
online. But the intent of the video was
just to illustrate the complex air motions inside supercell
thunderstorms. Here's an alternate
video that also shows development of a tornado. This
video wasn't shown in class.
Weather radar and "hook
echoes"
Thunderstorms with rotating updrafts and supercell thunderstorms
often have a distinctive radar signature called a hook echo.
This is one of the ways that scientists are now able to
better detect and warn of tornadic thunderstorms
We haven't discussed
weather radar in this class. In some ways a radar image of
a thunderstorm is like an X-ray photograph of a human body.
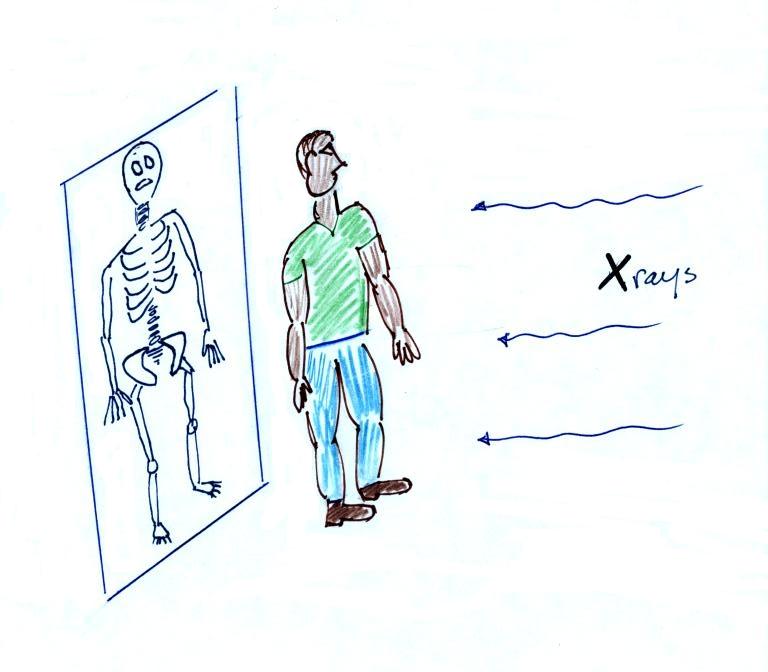
An X-ray image of a person doesn't usually
show the entire body, often just the bones and skeleton
inside.
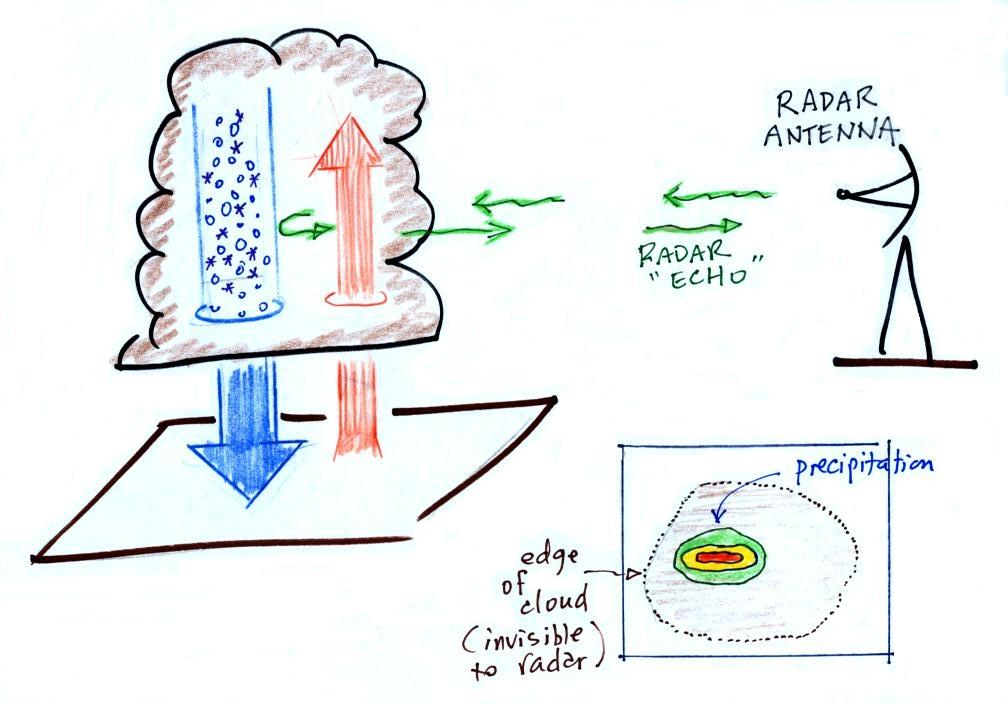
The
radio signals emitted by radar pass through the cloud itself
but are reflected by the much larger precipitation
particles. The radar keeps track of how long it takes for the
emitted signal to travel out to the cloud, be reflected, and
return to the radar antenna. The radar can use this to
determine the distance to the storm. It also knows the
direction to the storm and can locate the storm on a
map. The intensity of the reflected signal (the echo) is
often color coded. Red means an intense reflected signal
and lots of large precipitation particles. The edge of
the cloud isn't normally seen on the radar signal.
A Doppler radar (something we didn't
discuss in class) can detects small shifts in the
frequency of the reflected radar signal caused by precipitation
moving toward or away from the radar antenna. This can be
used to determine wind speeds inside the tornado.
Below is an actual radar image with a prominent hook
echo. The hook is evidence of large scale rotation inside
a thunderstorm and means the thunderstorm is capable of, and may
already be, producing tornadoes.
This is the radar image of a
thunderstorm that produced a very strong tornado that hit Oklahoma City in May 1999
. The hook echo is visible near the lower left
hand corner of the picture. Winds in the tornado
may have exceeded 300 MPH. You can read more about this
tornado here.
And here is some storm chase
video of the tornado.
We'll finish the section on tornadoes next week and talk about
the Fujita Scale (and the newer Enhanced Fujita Scale) and tornado
damage. We'll also cover lightning next week.