Tuesday Oct. 7, 2014
The Beatles: "I Should Have
Known Better" (2:29), "If I Fell"
(2:19), "You
Can't Do That" (2:36), "I'll
Follow the Sun" (1:48), "Tell Me Why"
(2:11), "I'll
Cry Instead" (1:48), "Things We Said
Today" (2:39), and "I'll Be Back"
(2:27).
The 1S1P Ozone reports have been graded and were returned in
class today. We've begun work on the Scattering of Sunlight
reports.
An Upper Air
Charts Optional Assignment and a separate Surface Weather Map
Analysis Optional Assignment were officially announced in
class today (they were posted online last Friday). Both
assignments are due next Tuesday (Oct. 14). Be
sure to circle one of the two Options at the top of each
assignment telling me how you would like any credit your earn to
be used.
We won't be spending much classroom time on upper level charts
but there are a few features that you should be familiar with.
First the overall
appearance is somewhat different from a surface weather
map. The pattern on a surface map can be complex but you
generally find circular (more or less) centers of high and low
pressure (see the bottom portion of the figure below).
You can also find closed high and low pressure centers at
upper levels, but mostly you find a relatively simple wavy
pattern like is shown on the upper portion of the figure below
(sort of a 3-dimensional view). The figures and text
below come from Upper
Level Charts pt. 1, which is required reading.
A simple upper
level chart pattern is sketched below (a pure top view).
There are two basic features: wavy lines that dip southward
and have a "u-shape" and
lines that bend northward and have an "n-shape".

The u-shaped portion
of the pattern is called a trough. The n-shaped portion is called
a ridge.

Troughs are produced by large volumes of cool or
cold air (the cold air is found between the ground and the upper
level that the map depicts). The western half of the
country in the map above would probably be experiencing colder
than average temperatures. Large volumes of warm or hot
air produce ridges.
Here's an actual upper level chart from yesterday (Mon.,
Oct. 6, 2014). A ridge is centered over the west Coast
of the US (the ridge axis may be off shore).
The eastern half of the country is under a trough.
Note also the remnants of Hurricane Simon. Moisture from
that storm will be moving through Arizona during the next day
or so. The forecasts that I've seen show most of
the rain falling in western Arizona.
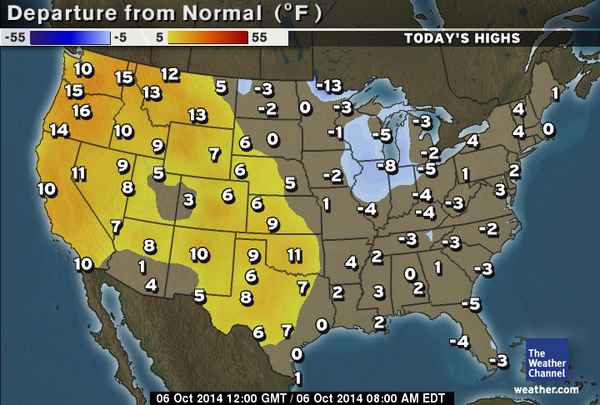
You would expect to find warmer and colder than average
temperatures over the west coast and the eastern half of the
US, respectively. That's just what the graphic below,
from The Weather Channel, shows.
Upper level conditions can also determine whether a surface low
will intensity or weaken.

This figure (see p. 42 in
the photocopied Classnotes) shows a cylinder of air positioned
above a surface low pressure center. The pressure at the
ground, at the bottom of the cylinder, is determined by the
weight of the air overhead. The surface winds are
spinning counterclockwise and spiraling in toward the center
of the surface low. These converging surface winds add
air to the cylinder. Adding air to the cylinder means
the cylinder will weigh more and you would expect the surface
pressure at the bottom of the cylinder to increase.
It's kind of like shoveling
dirt into a hole. You would expect that would eventually
fill the hole.
But if the pressure in the
Low were to decrease. How would you explain that?
What if you were shoveling dirt into a hole and the hole kept
getting deeper?
The next figure shows us
what could be happening (back to p. 42 in the Class Notes).

There may be some upper
level divergence (more arrows leaving the cylinder at some
point above the ground than going in). Upper level
divergence removes air from the cylinder and would decrease
the weight of the cylinder (and that would lower the surface
pressure)
Whether the surface pressure gets higher or lower depends on
the exact amounts of convergence and divergence. If
upper level divergence dominates the surface low pressure will
get lower (the surface storm would intensify). If the
surface convergence is dominant the surface low pressure will
rise (the storm will weaken).
This is explored further in
Upper Level Charts pt. 3. You'll need to read that in
order to answer some of the questions on the Upper Level
Charts Optional Assignment.
We're done with weather maps for the time
being. Though if interesting weather appears imminent I'll
try to mention it in class.
If we were using a textbook in this class we'd be moving
into Chapter 2! During the next couple of weeks we will be
concerned with energy, temperature, heat, energy transport, and
energy balance between the earth, atmosphere, and space.
It is easy to lose sight of the
main concepts because there are so many details. The
following is an introduction to this new section of material and
most of the figures are found on pages 43 & 44 in the
photocopied ClassNotes.
1. Types of energy
We will learn the names of several different types or forms of
energy.
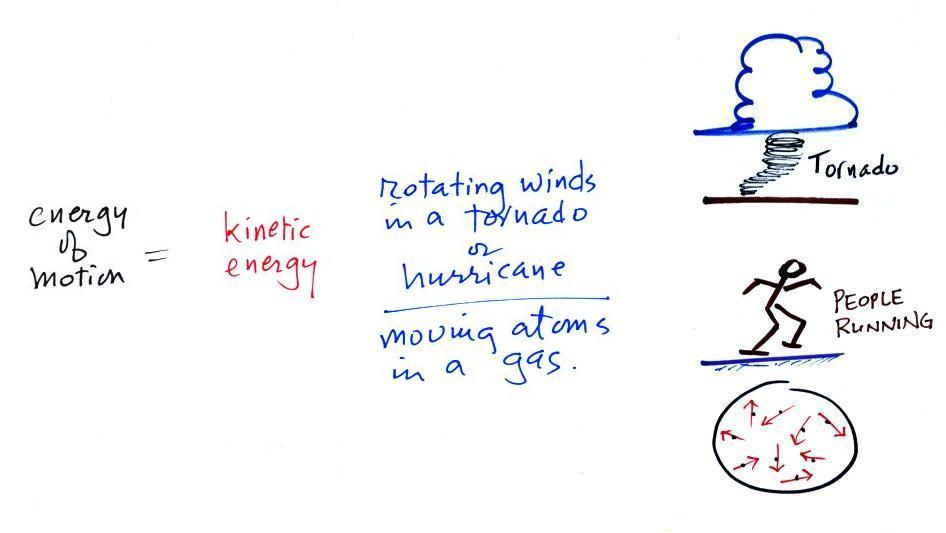
Kinetic energy is energy of
motion. Some examples (both large and microscopic
scale) are mentioned and sketched above. This is a
relatively easy to visualize and understand form of
energy.
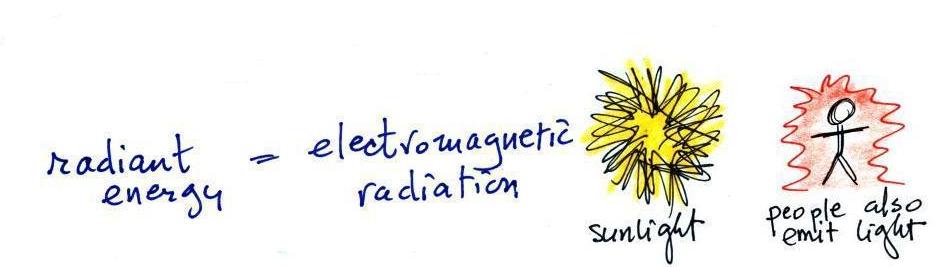
Radiant energy is a very important form of energy that was for
some reason left off the original list in the ClassNotes (pps
43&44). Electromagnetic radiation is another
name for radiant energy. Sunlight is an example of radiant
energy. It's something that we can see and feel (you feel
warm when you stand in sunlight). But everyone in the
classroom is emitting light, infrared light, an invisible form of
radiant energy. And actually the walls, ceiling, floor and
even the air in the classroom are also emitting infrared
light. We can't see it. Because it's there all the
time I'm not sure whether we can feel it or not.
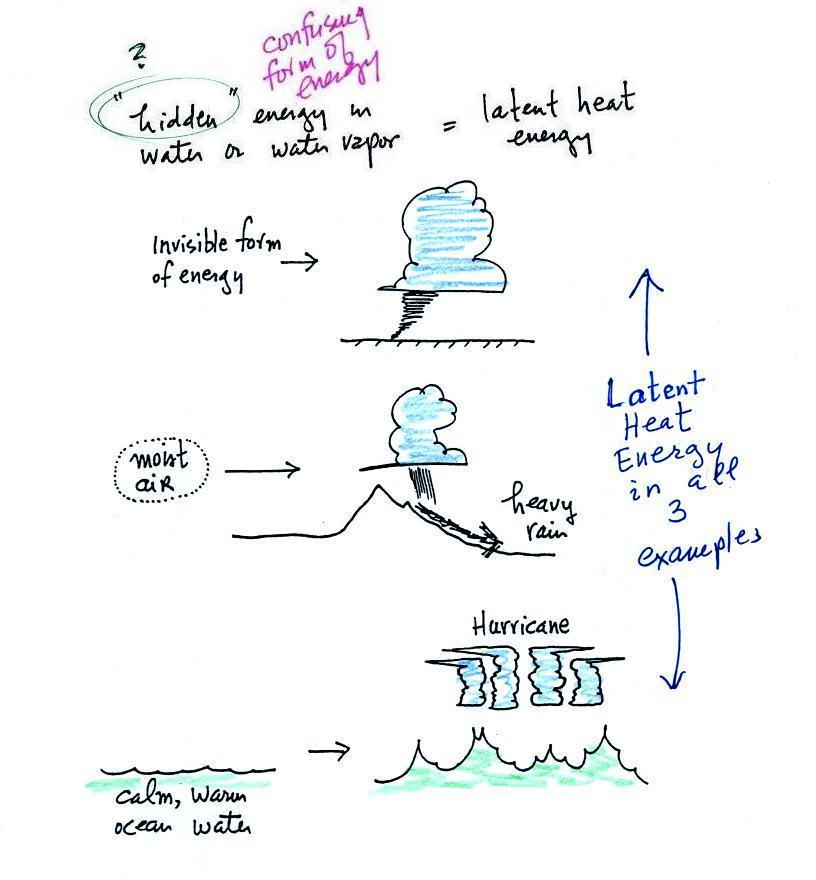
Latent heat energy is an
under-appreciated and rather confusing type of energy. The
word latent refers to energy that is hidden. That's
part of the problem. But it is also the fact that
the energy is contained in water vapor and water.
That seems like an unlikely place for energy to be
found. The hidden energy emerges when
water vapor condenses or water freezes.
In the bottom picture above, sunlight shining on a
tropical ocean warms and evaporates ocean water. The
sunlight energy is stored in the resulting water
vapor. A hurricane derives much of its energy from
the condensation of water vapor (it also gets heat energy
from the warm ocean water).
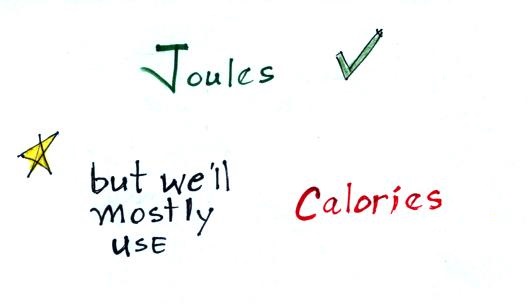
Energy units
Now just brief mention of units of energy
Joules are the
units of energy that you would probably encounter in a
physics class. We'll usually be using calories
as units of energy. 1 calorie is the energy need
to warm 1 gram of water 1 C (there are about 5 grams
of water in a teaspoon). Your electric bill
shows the amount of energy that you have used in a
month's time, the units are kilowatt-hours.
Here's a little miscellaneous information that you
don't need to worry about remembering. You've
probably seen the caloric content of food on food packages
or on menus in restaurants. 1 food calorie is
actually 1000 of the calories mentioned above.
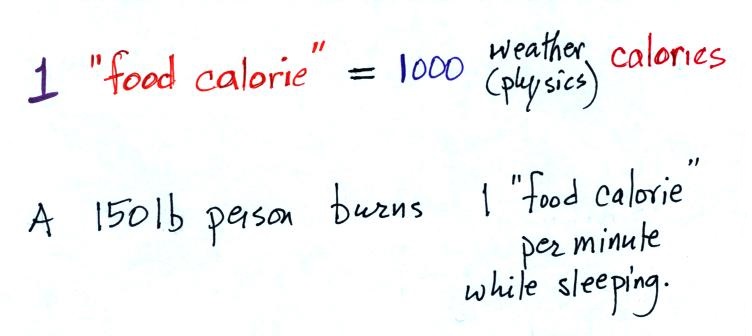
A 150 pound person would burn
almost 500 calories while sleeping during the night
(8 hours x 60 minutes per hour x 1 food calorie per
minute). This is about the energy contained in
a donut.
2. Energy transport processes
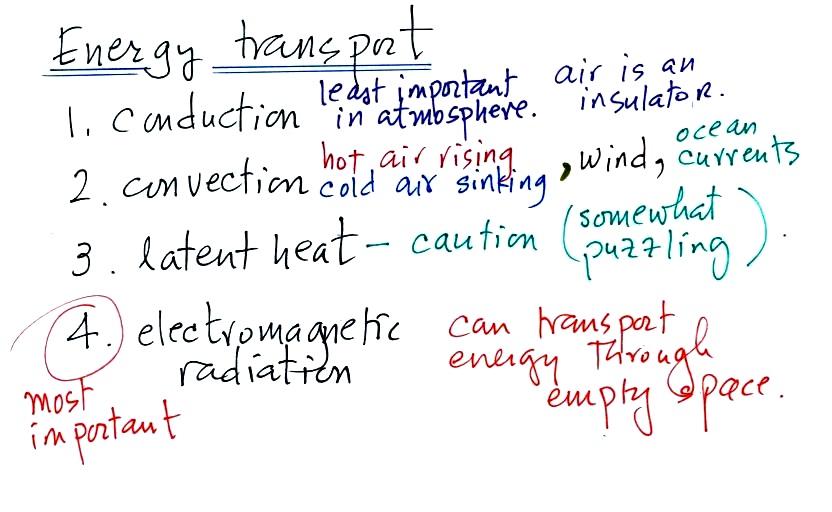
By far the most important process is at the bottom of the list
above. Energy transport in the form of electromagnetic
radiation (sunlight for example) is the only process that can
transport energy through empty space. Electromagnetic
radiation travels both to the earth (from the sun) and away from
the earth back into space. Electromagnetic radiation is also
responsible for about 80% of the energy transported
between the ground and atmosphere.
You might be surprised to learn that latent heat is the second
most important transport process. This term latent heat can
refer to both a type of energy and an energy transport process.
Rising parcels of warm air and sinking parcels of cold air are
examples of free convection. Because of convection you feel
colder or a cold windy day than on a cold calm day (the wind chill
effect). Ocean currents are also an example of
convection.
Convection is also one of the ways of rising air motions in the
atmosphere (convergence into centers of low pressure and fronts
are two other ways we've encountered so far)
Conduction is the least important energy transport at least in
the atmosphere. Air is such a poor conductor of energy that
it is generally considered to be an insulator.
3. Energy balance
The next picture (the figure in the ClassNotes has been split
into three parts for improved clarity) shows energy being
transported from the sun to the earth in the form of
electromagnetic radiation. On average about half of this
sunlight passes through the atmosphere and is absorbed at the
ground. This causes the ground to warm (sunlight energy
striking the ocean warms the oceans but is also used to
evaporate ocean water).
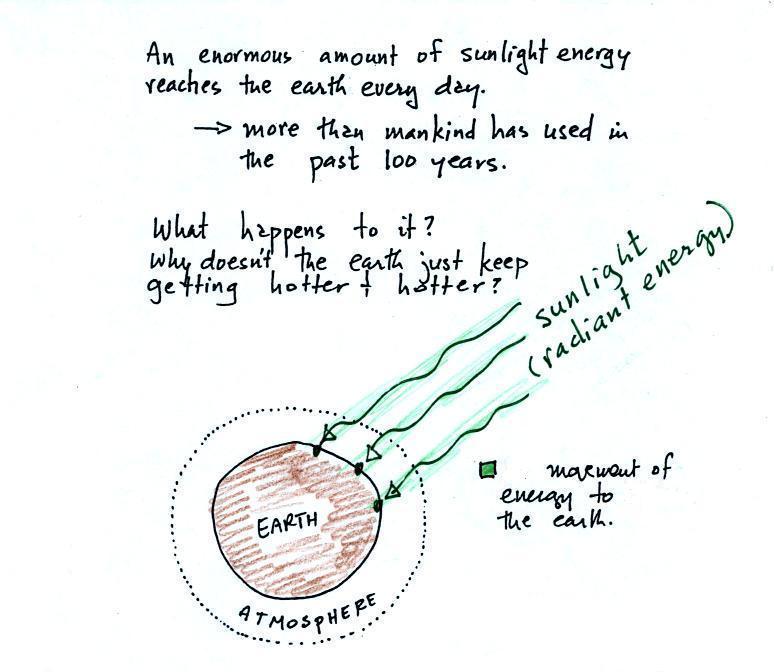
We are aware of this energy
because we can see it (sunlight also contains invisible
forms of light) and feel it. With all of this
energy arriving at and being absorbed by the earth, what
keeps the earth from getting hotter and hotter? If
you park your car in the sun it will heat up. But
there is a limit to how hot it will get. Why is
that?
It might be helpful
when talking about energy balance to think of a bank
account. You open a bank account and start
depositing money. The bank account balance starts to
grow. But it doesn't just grow without limit.
Why not? The answer is that once you find money in
the bank you start to The same is true of energy and the
earth. Once the earth starts to warm it also emits
energy back into space (the orange arrows in the figure
below). Radiant energy is emitted by both the
surface of the earth and the atmosphere.
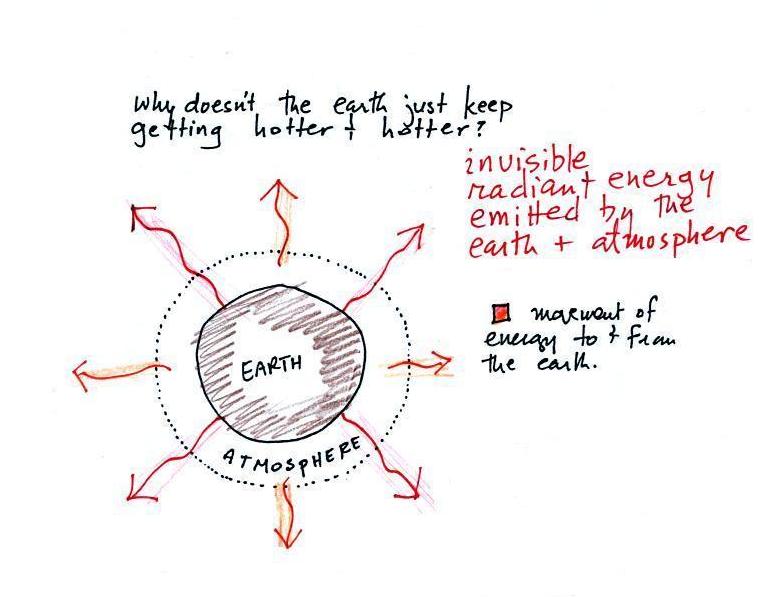
Energy emitted in the form of infrared light is an invisible
form of energy (it is weak enough that we don't usually feel it
either). A balance between incoming and outgoing energy is
achieved and the earth's annual average temperature remains
constant.
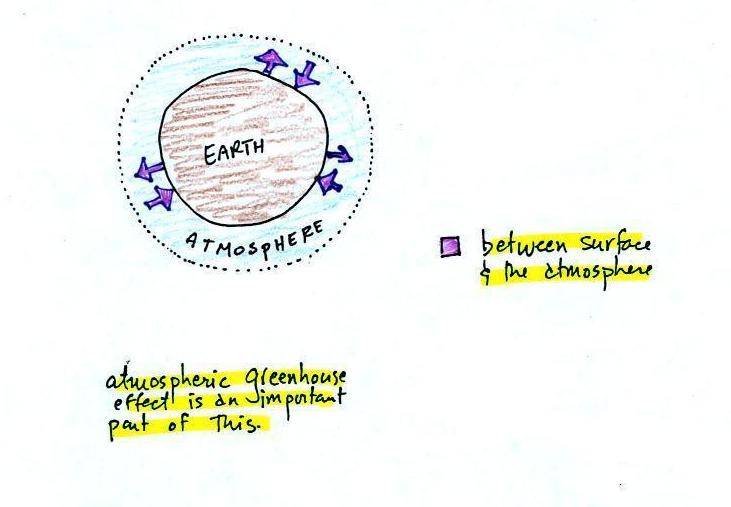
We will also look closely at energy transport between the
earth's surface and the atmosphere (see the figure below). This
is where latent heat energy transport, convection and conduction
operate (they can't transport energy beyond the atmosphere and
into outer space).
That is also where the atmospheric
greenhouse functions. That will be a important
goal - to better understand how the atmospheric
greenhouse effect works.
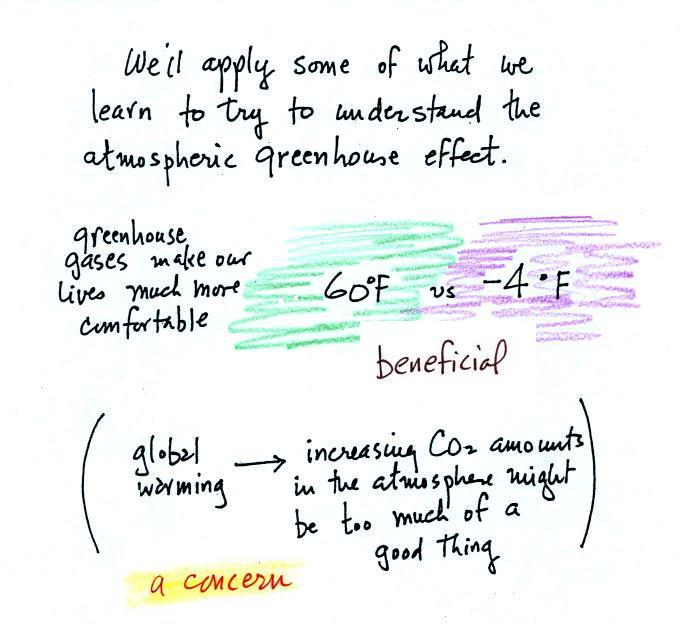
The greenhouse effect is getting a
lot of "bad press". If the earth's atmosphere didn't
contain greenhouse gases and if there weren't a greenhouse
effect, the global annual average surface temperature would be
about 0 F (scratch out -4 F and put 0 F, it's easier to
remember). Greenhouse gases raise this average to about 60
F and make the earth a much more habitable place. That is
the beneficial side of the greenhouse effect. That's
mostly what we'll be concentrating on - how can the greenhouse
effect cause this warming, how can it produce this much warming.
The detrimental side is that atmospheric greenhouse gas
concentrations are increasing (no real debate about that).
This might enhance or strengthen the greenhouse effect and cause
the earth to warm (some debate here particularly about how much
warming there might be). While that doesn't necessarily
sound bad it could have many unpleasant side effects (lots of
debate and uncertainty about this also). That's a subject
we'll explore at different times during the semester.
Energy, temperature, and specific heat
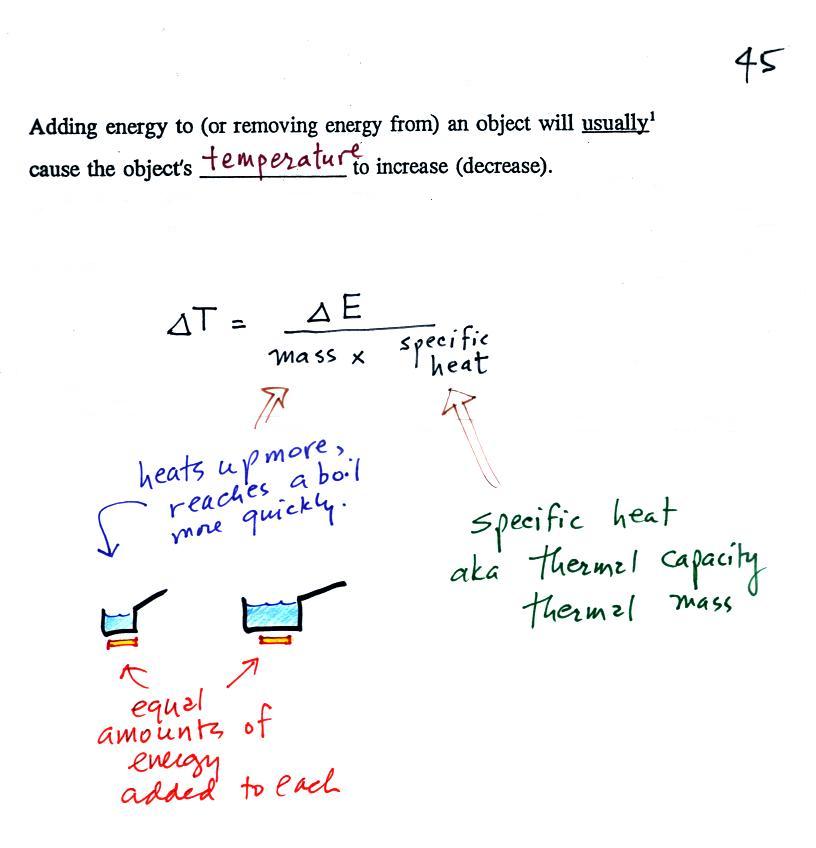
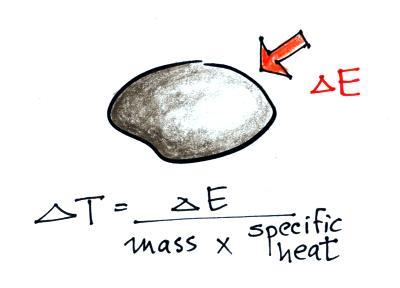
When you add energy to an object, the object will usually warm up
(or if you take energy from an object the object will cool).
It is relatively easy to come up with an equation that allows you
to figure out what the temperature change will be (this is another
equation I'll write on the board before the next quiz if you
ask me to - try to understand it, you don't have to memorize it).
The temperature change, ΔT, will first depend on how much
energy was added, ΔE. This is a
direct proportionality, so ΔE is in the
numerator of the equation (ΔE and ΔT
are both positive when energy is added, negative when energy is
removed)
When you add equal amounts of energy to large and small
pans of water, the small pan will heat up more quickly. The
temperature change, ΔT, will depend on the
amount of water, the mass. A small mass will mean a large ΔT,
so mass should go in the denominator of the equation.
Specific heat is what we use to account for the fact that
different materials react differently when energy is added to
them. A material with a large specific heat will warm more
slowly than a material with a small specific heat. Specific
heat has the same kind of effect on ΔT as
mass. Specific heat is sometimes called "thermal mass" or
"thermal capacity." You can think of specific
heat as being thermal inertia - a substance with high specific
heat, lots of thermal inertia, will be reluctant to change
temperature.
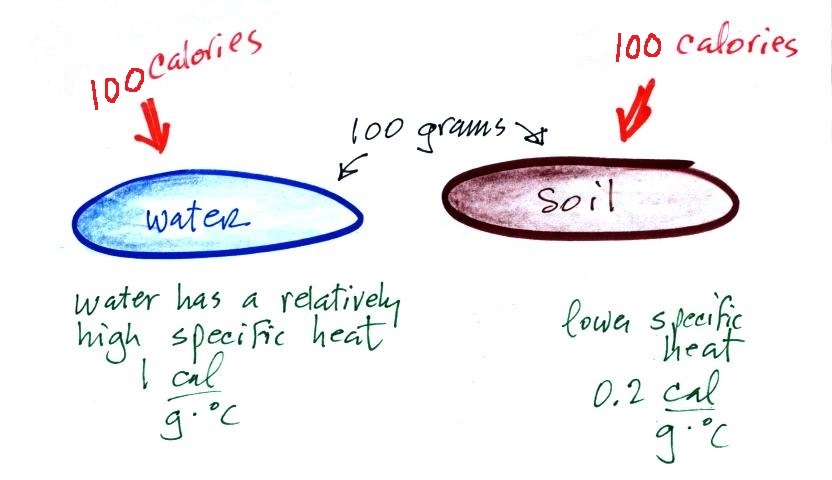
Here's an important example that will show the effect of
specific heat (middle of p. 45).
Equal amounts of energy (500 calories) are added to
equal masses (100 grams) of water and soil. We use water and
soil in the example because most of the earth's surface is either
ocean or land. Before we do the calculation, try to guess which
material will warm up the most. Everything is the same
except for the specific heats. Will water with its 5 times
larger specific heat warm up more or less than the soil?
The details of the calculation are shown below.

With its higher specific heat, the water
doesn't heat up nearly as much as the soil. If we had
been removing energy the wouldn't cool off as much as the soil
would.
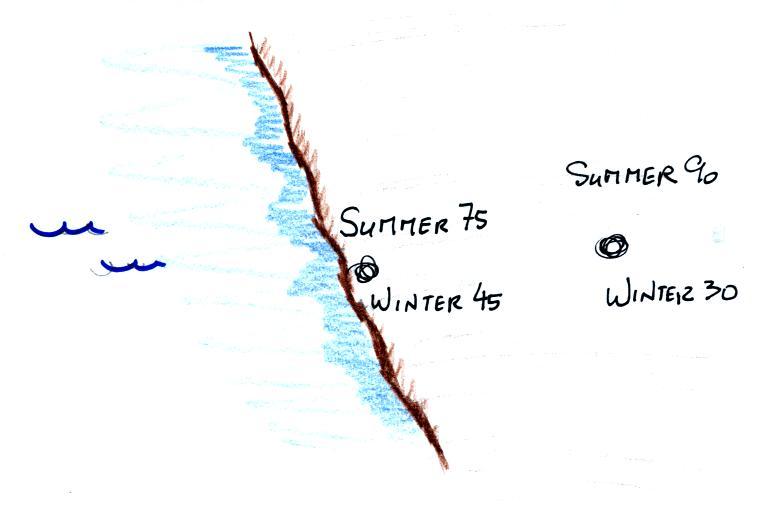
Water moderates climate
These different rates of warming of water and soil have important
effects on regional climate.
Oceans moderate the climate. Cities near a large body of
water won't warm as much in the summer and won't cool as much
during the winter compared to a city that is surrounded by land.
Water's ΔT is smaller than land's because water has
higher specific heat.
The yearly high and low monthly average temperatures are shown
at two locations above. The city on the coast has a 30o
F annual range of temperature (range is the difference
between the summer and winter temperatures). The city
further inland (assumed to be at the same latitude and altitude)
has an annual range of 60o F. Note that
both cities have the same 60o F annual average
temperature.
Here's another situation where you can take advantage of
water's high specific heat to moderate climate on a smaller scale.
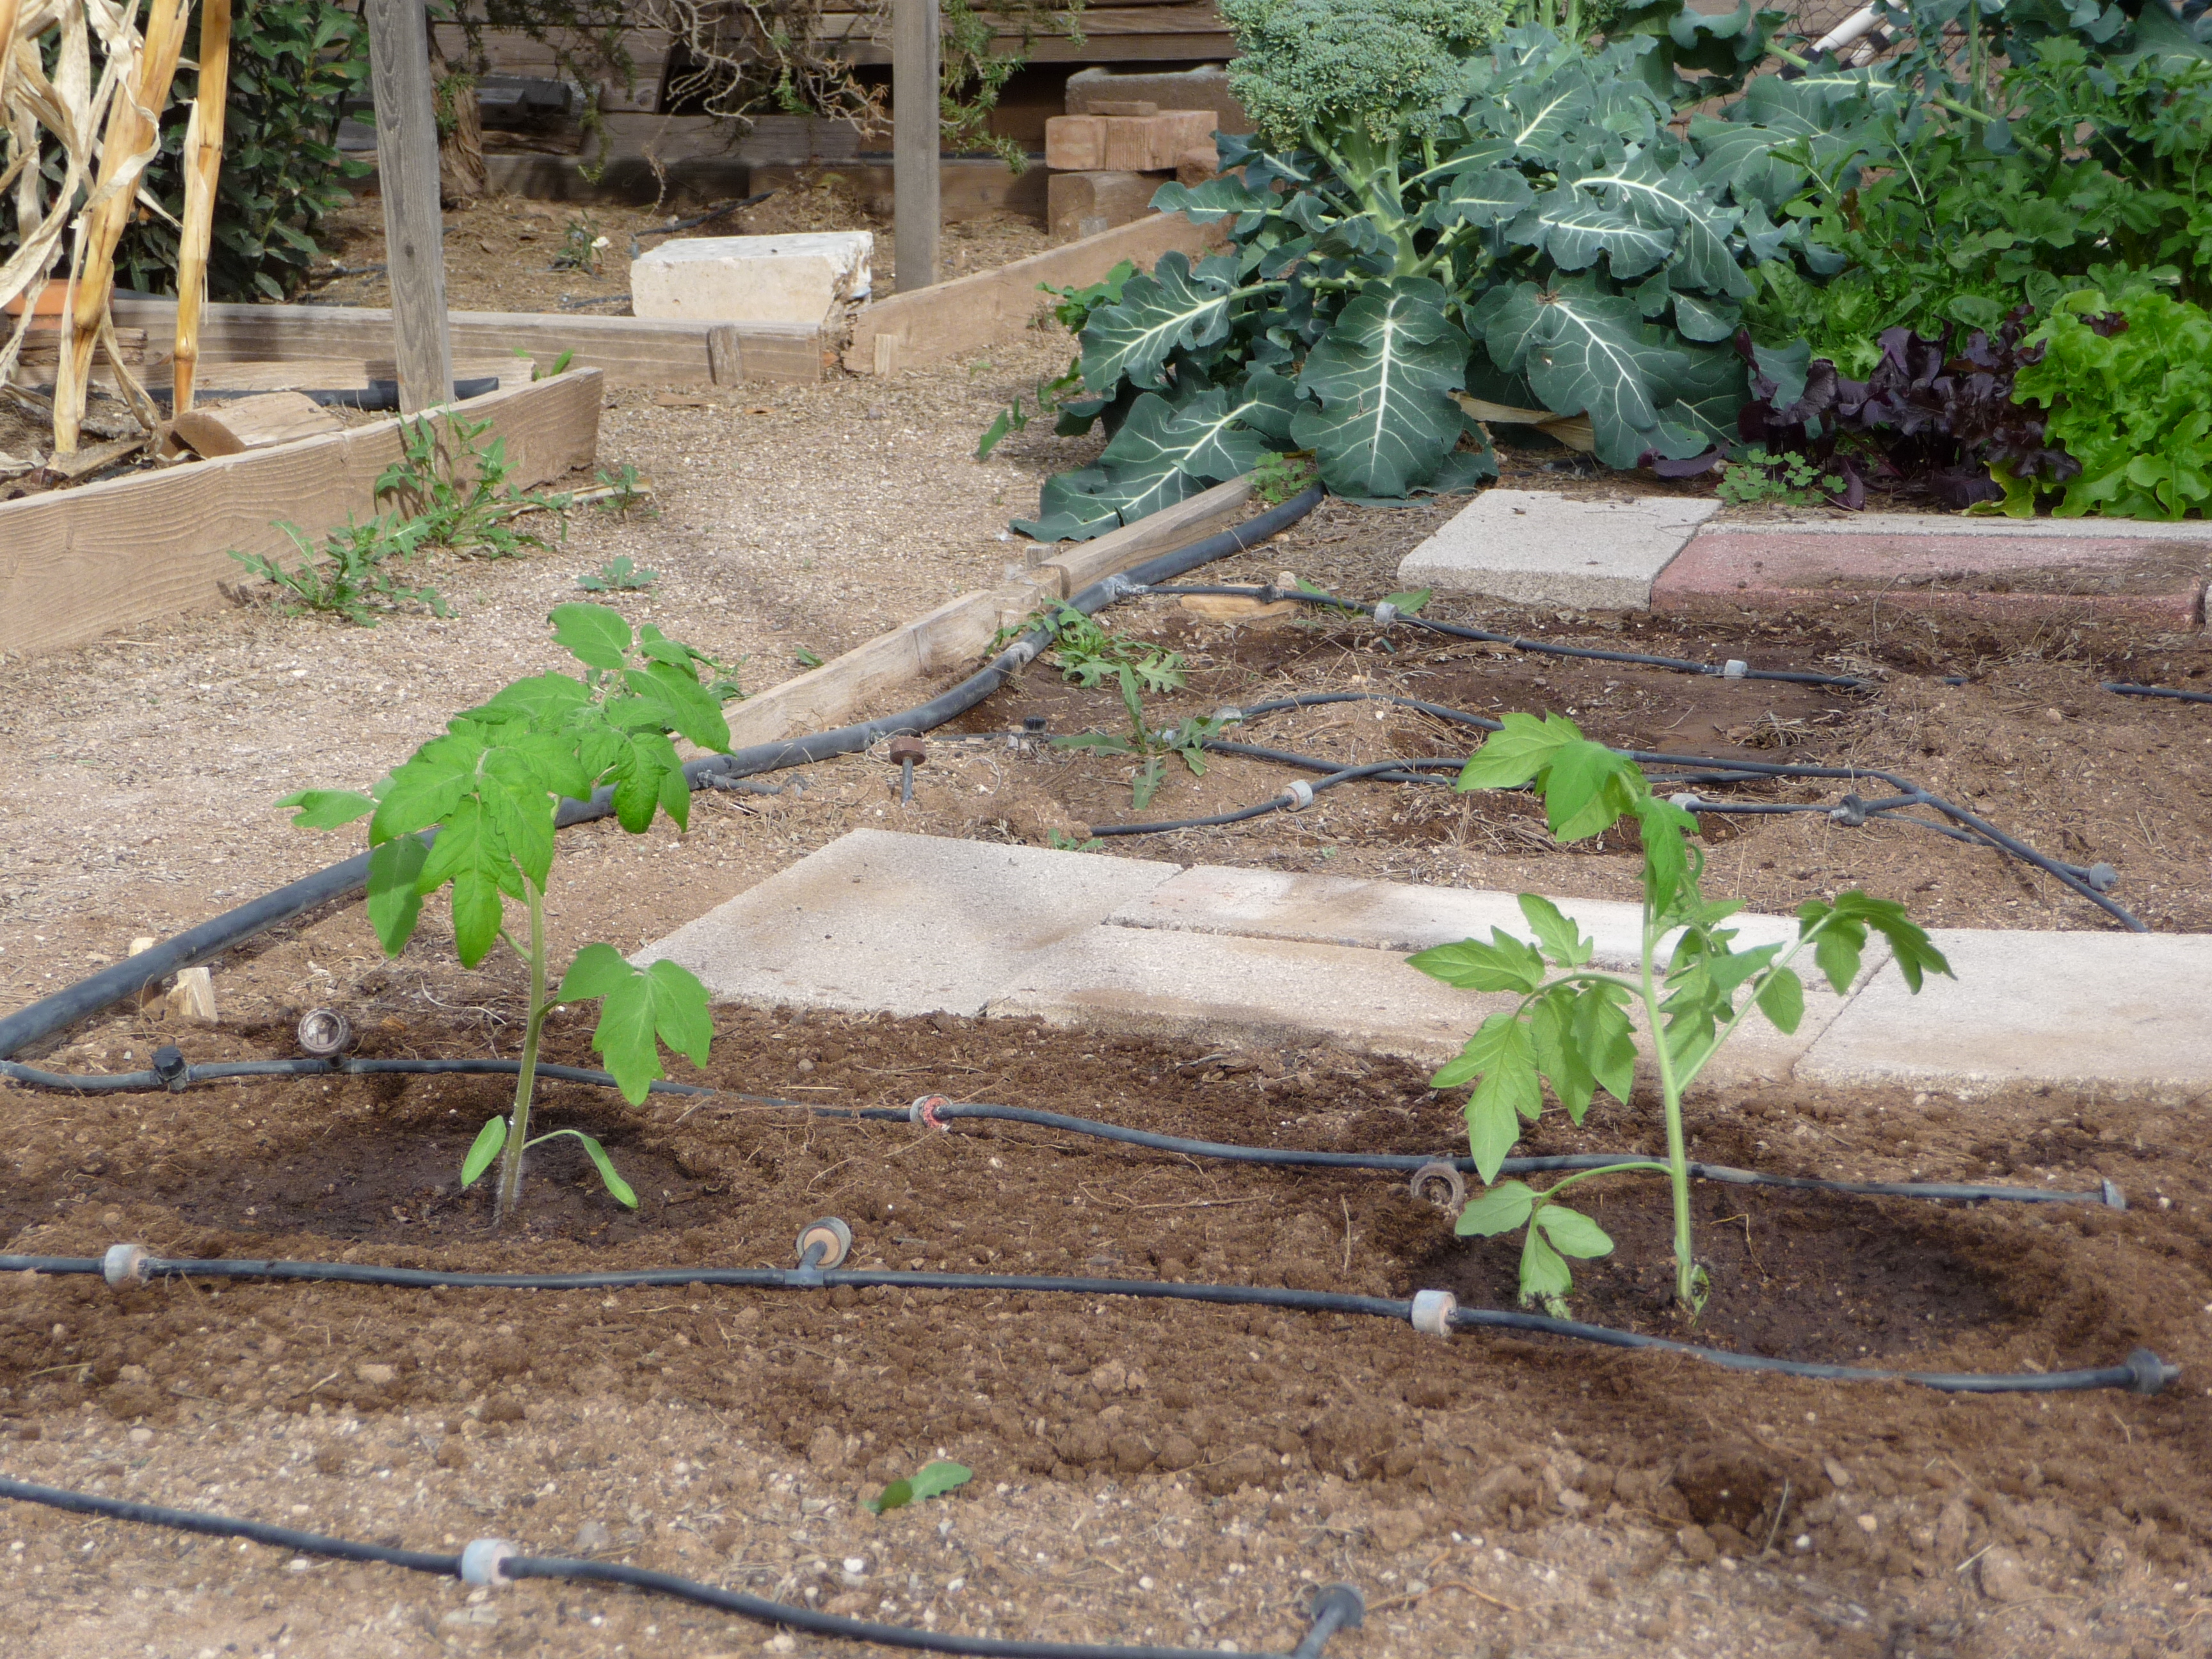
If this were the
spring semester I'd be planting tomatoes. They go in
the ground early in Tucson so that so
that they can start to make tomatoes before it starts to
get too hot in May. In February it can
still get cold enough to kill tomatoes so they need some
protection (the broccoli and lettuce in the
background can handle a light frost, I'm currently
planting this winter's brocolli, lettuce, and spinach).
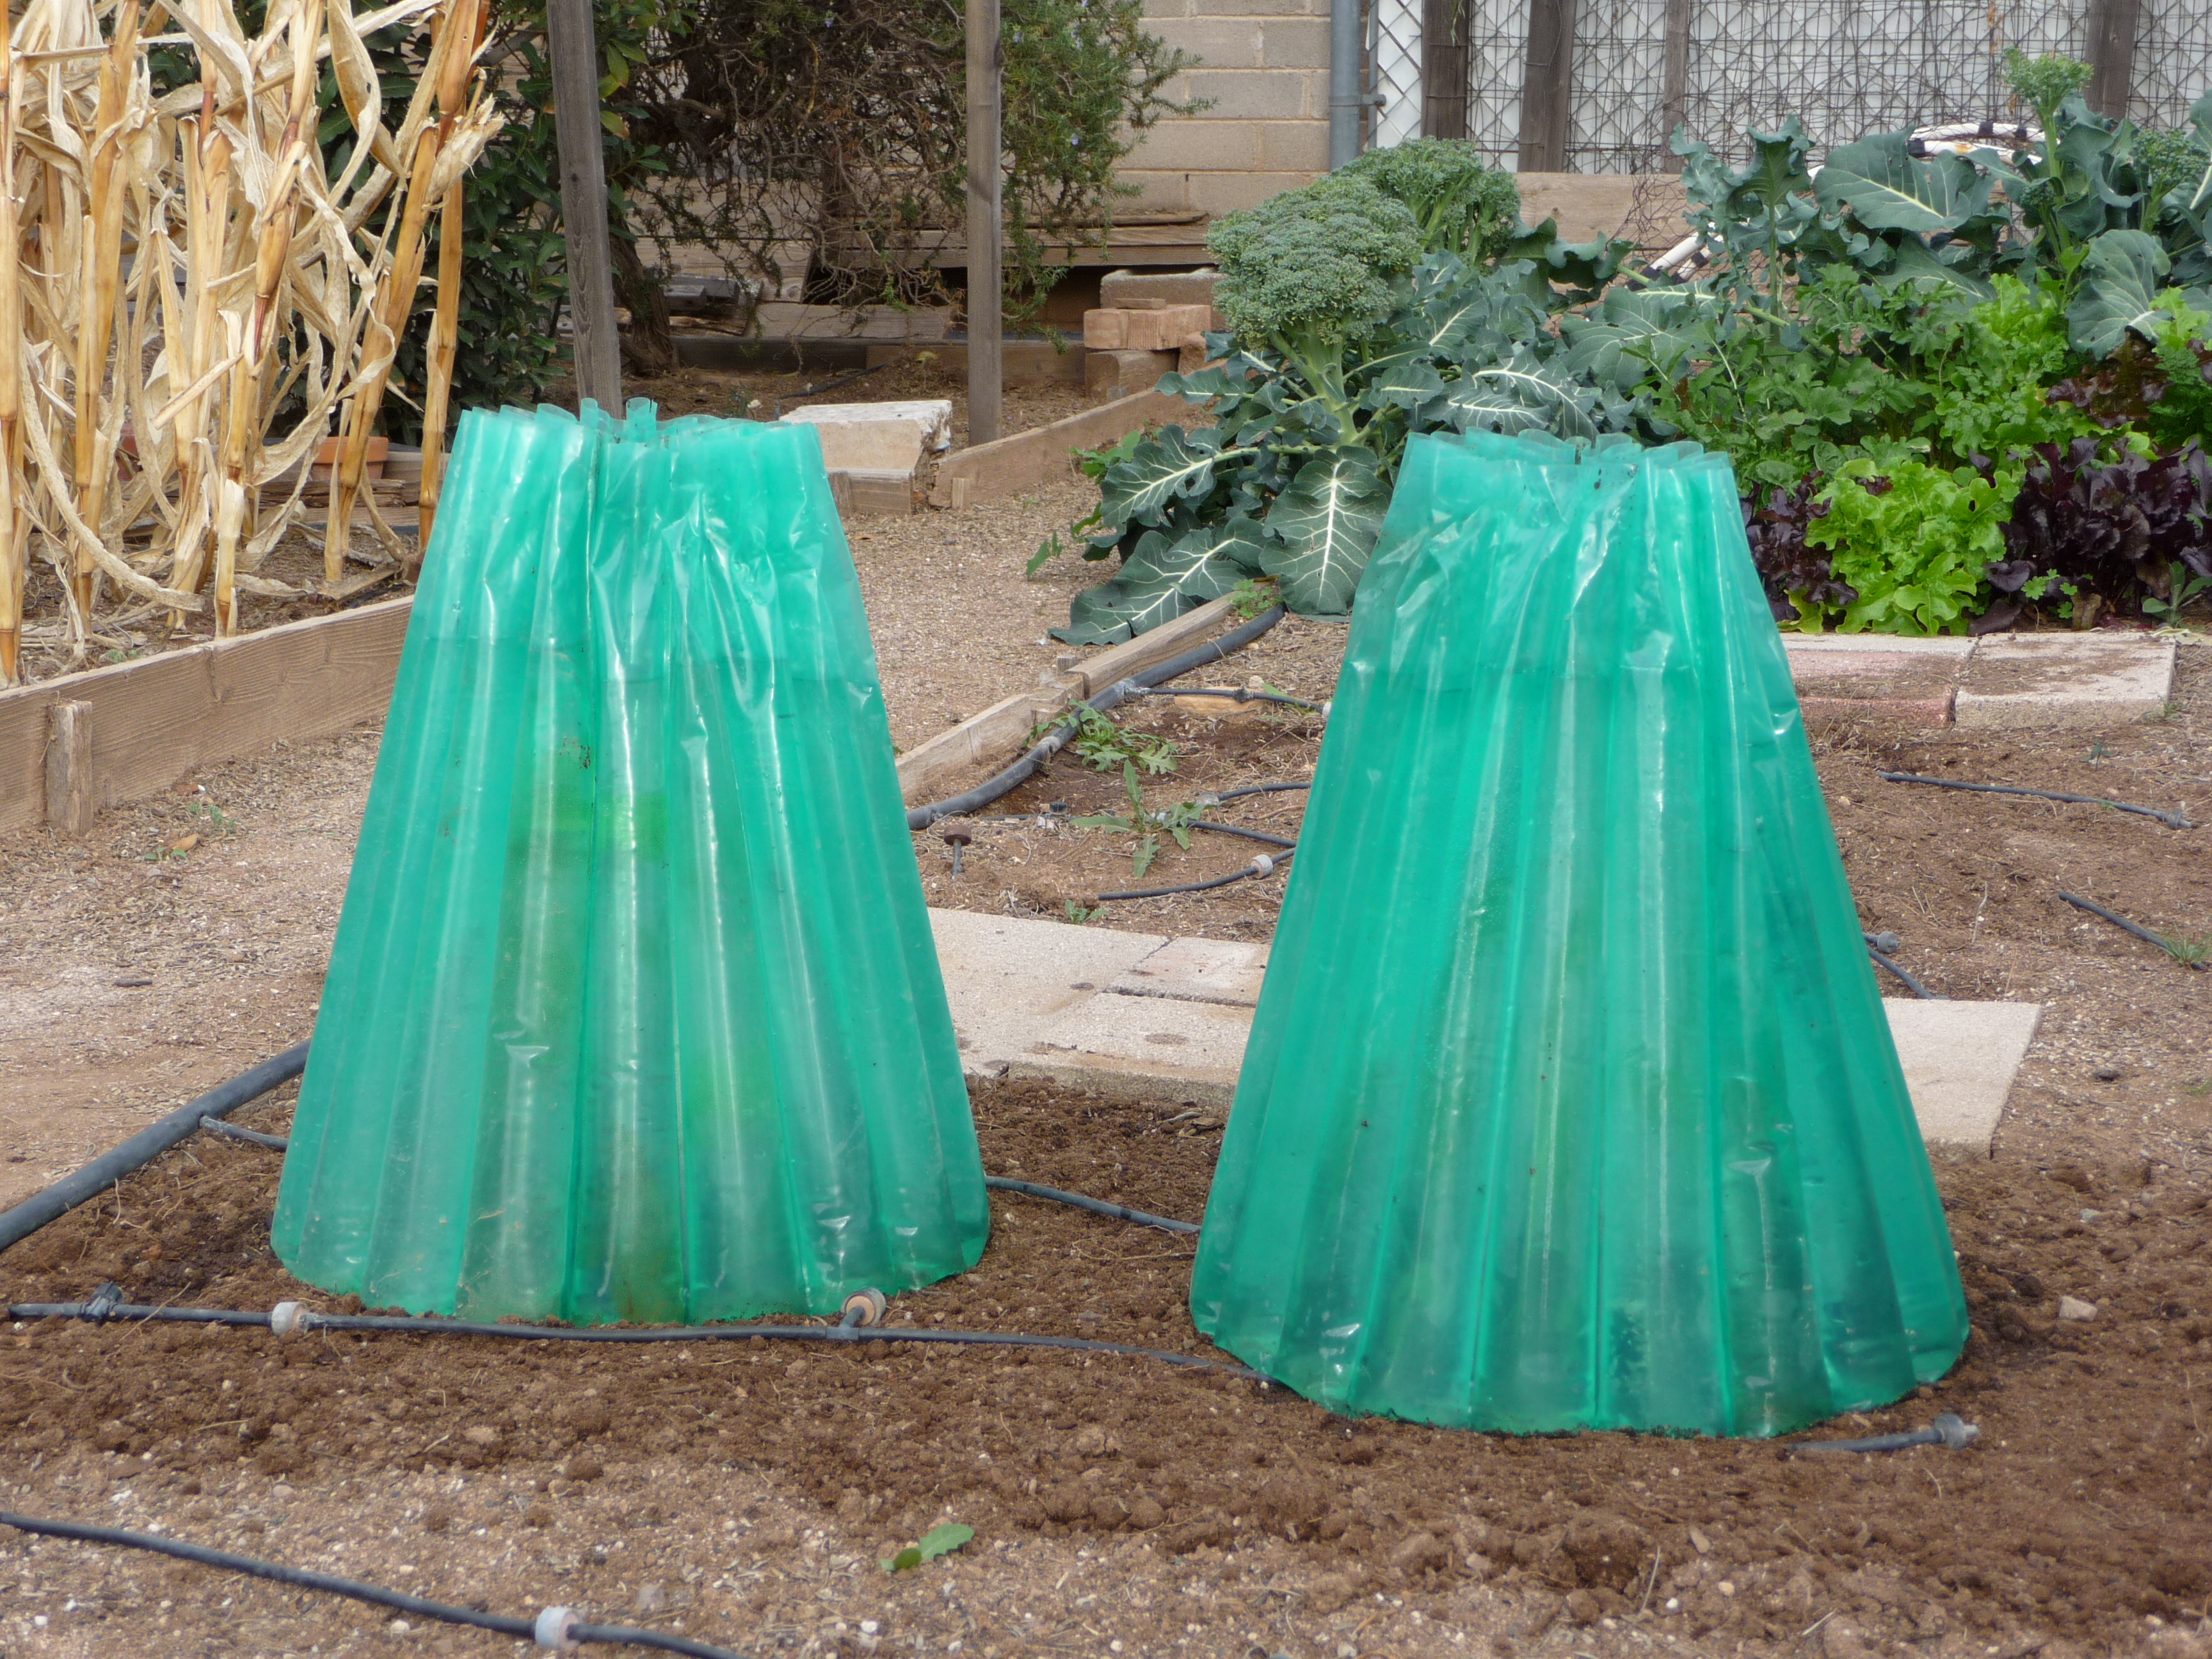
Here's one way of doing that. You
moderate the climate and surround each plant with a "wall o
water" - a teepee like arrangement that surrounds each
plant. The cylinders are filled with water and they take
advantage of the high specific heat of water and won't cool as
much as the air or soil would during a cold night. The walls
of water produce a warm moist micro climate that the tomato
seedlings love. The plastic is transparent so plenty of
sunlight can get through.
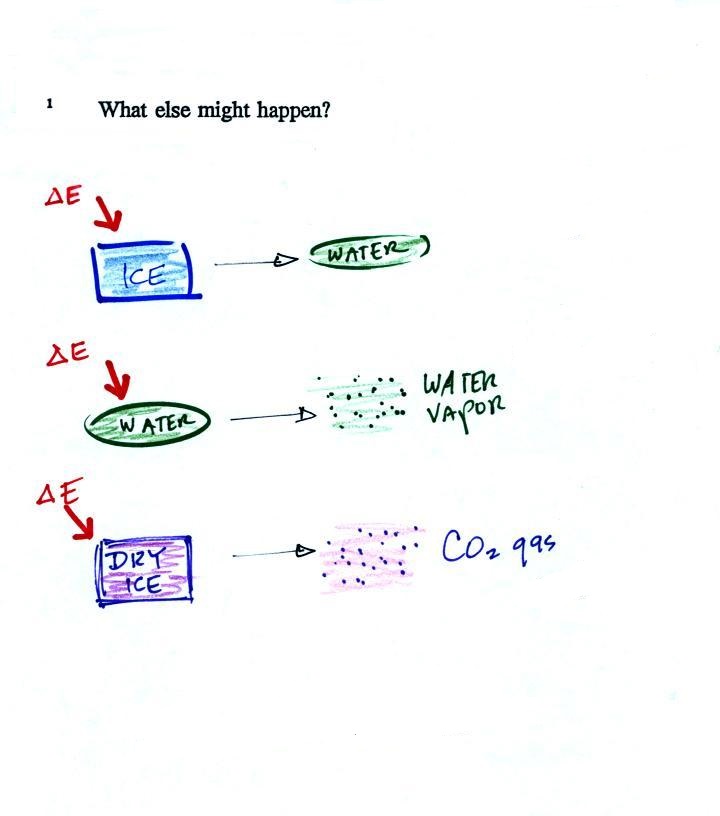
Adding energy to something will usually cause its
temperature to change. But not always. What
else could happen?
You put a pan of water on the stove and turn on the
burner. The water will warm. It will only warm to
a certain point however. Then what happens?
The water will warm to 212 F (100 C) and then it
will start to boil. Adding energy to ice will first
cause it to warm to 0 C. But then it will stop warming
and will start to turn to water. Adding energy to an
object can cause the object or material to change phase.
The dry ice above is sublimating (changing directly from solid
to gas).
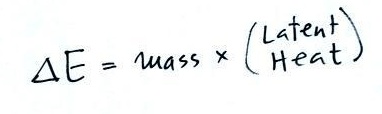
It is very easy to calculate how much energy is needed to
cause a phase change.
The energy needed depends on the amount of material present
(the mass) and on the material itself (that's the Latent Heat term
above). It also depends on the specific phase change.
I.e. there are different Latent Heat values depending on whether
the material changes from solid to liquid, liquid to gas, or solid
to gas.
We had just enough to conduct an
experiment. I was able, with some difficulty, to get a
student to assist.
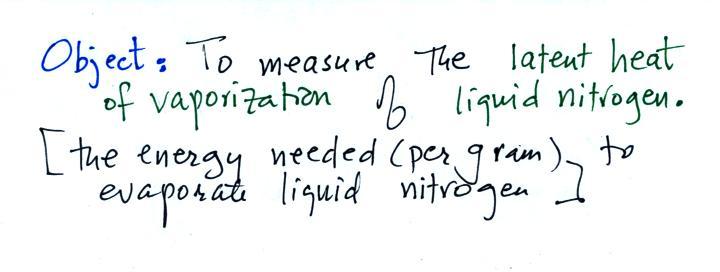
Here's the object of the experiment:
The source of energy in our experiment will be the energy
contained in a cup of room temperature water. We'll
pour some liquid nitrogen into the cup of water.
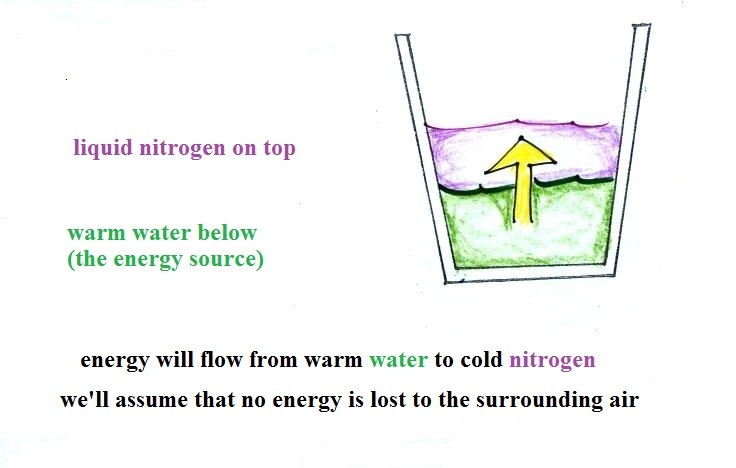
Energy will naturally flow from hot (the
water) to cold (the liquid nitrogen). As energy is taken
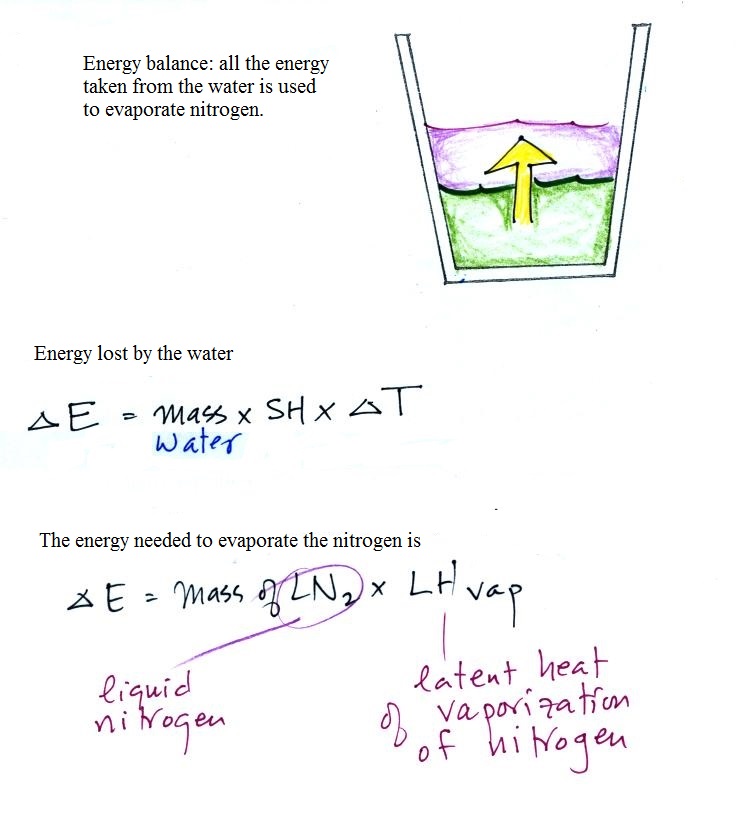
from the water it will cool. We'll assume that all of
the energy taken from the water is used to evaporate nitrogen,
no energy flows from the cup into the surrounding air (that's
part of the reason we conduct the experiment in a styrofoam
cup.
|
|
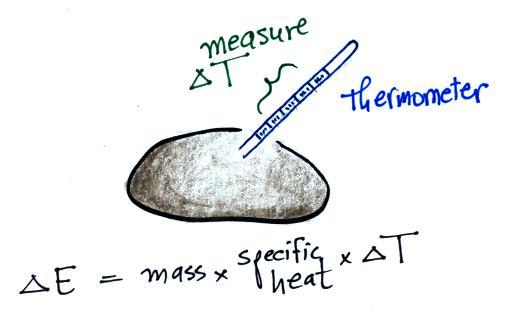
Our earlier equations is shown above at
left. If you know how much energy is added to something
you could determine the temperature change that would
result. We can turn the equation around so that is we
measure the temperature change that any object undergoes we
can calculate the amoutn of energy added or removed (the
equation at right).
As we saw last Friday, adding energy to an object will cause
it to warm up. If you know how much energy you added,
the object's mass and specific heat, you can calculate the
temperature change that will result using the left equation
above.
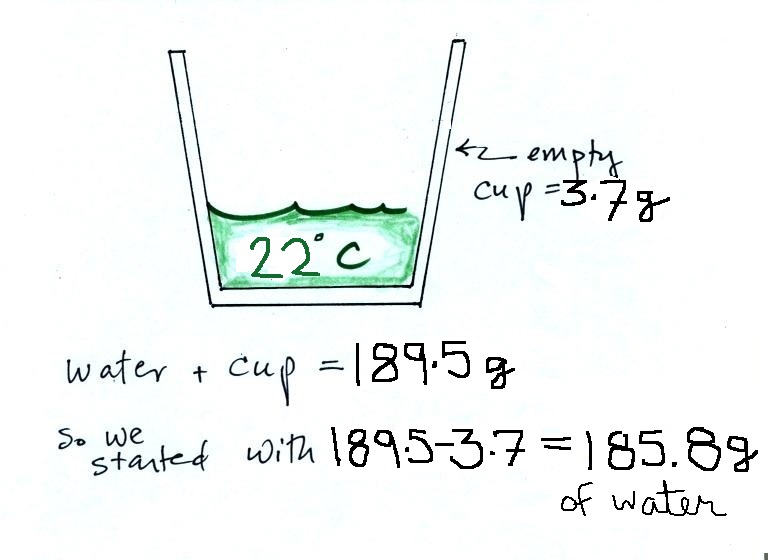
We start with a styrofoam cup filled about 1/3 full
with room temperature water.
The cup and the water together weighed 189.5 g of room
temperature water. The cup weighed 3.7 g, so we really
had 185.8 g of water. The student measured its
temperature, 22 C.
Next the student poured some liquid nitrogen into a
second, smaller styrofoam cup.
We're going to evaporate 35.6 grams of
liquid nitrogen. The total amount of energy needed to do
that, ΔE, is the mass of the liquid nitrogen times
the Latent Heat of Vaporization of Nitrogen (LHvap).
ΔE = mass x LHvap
LHvap is the energy needed per gram to vaporize
(evaporate) liquid nitrogen. That's the quantity we are
trying to measure.
We poured the 29.3 grams of liquid nitrogen
into the cup containing 150.5 g of water. Energy flows
naturally from hot to cold. We assume that any energy
lost by the water is used to evaporate nitrogen.
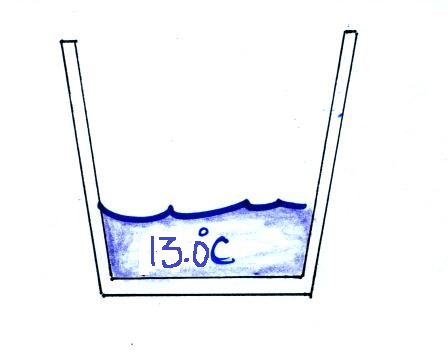
Once the liquid nitrogen was gone (it had
evaporated) we remeasured the water temperature. It had
dropped to 13 C. Now we're ready to
calculate the latent heat of vaporization
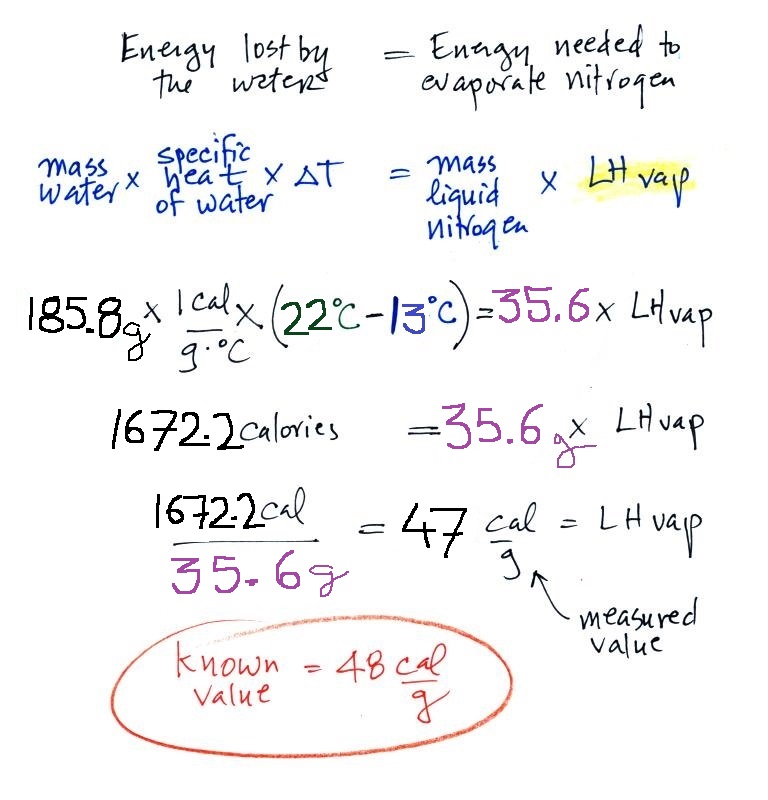
We set up an energy balance equation
(energy lost by the water = energy used to evaporate nitrogen)
and plugged in all our measured values. We obtained a
measured value of LHvap = 47 calories/gram (51.4 cal/g earlier
in the day in the 8 am class). A trustworthy student in
the class informed us that the known value is 48 cal/g.
Very good agreement
Here's just a tad bit more material.
We'll go over it quickly at the start of class on
Thursday. None of this was
covered in class today.
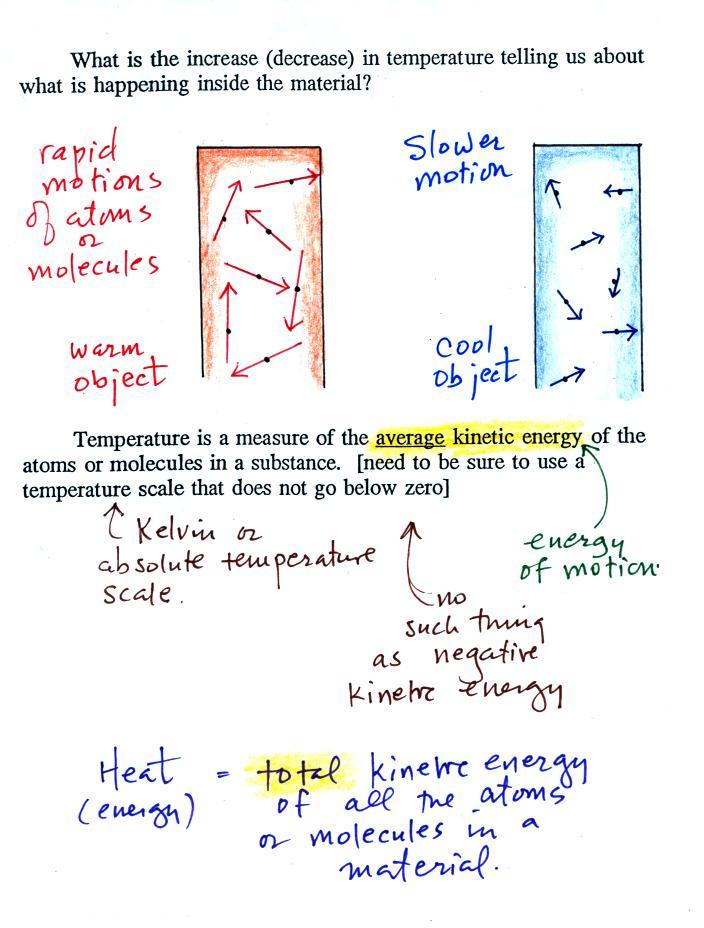
You add energy to something and its
temperature usually increases. The figure below (p. 46
in the ClassNotes) shows you what happens inside an object
when it's temperature changes.
The atoms or molecules inside
the warmer object will be moving more rapidly (they'll be
moving freely in a gas, just "jiggling" around while still
bonded to each other in a solid). Temperature
provides a measure of the average kinetic energy of the atoms
or molecules in a material.
You need to be careful what temperature scale you use when
using temperature as a measure of average kinetic
energy. You must use the Kelvin temperature scale
because it does not go below zero (0 K is known as absolute
zero). The smallest kinetic energy you can have is zero
kinetic energy. There is no such thing as negative
kinetic energy.
You can think of heat as being the total
kinetic energy of all the molecules or atoms in a material.
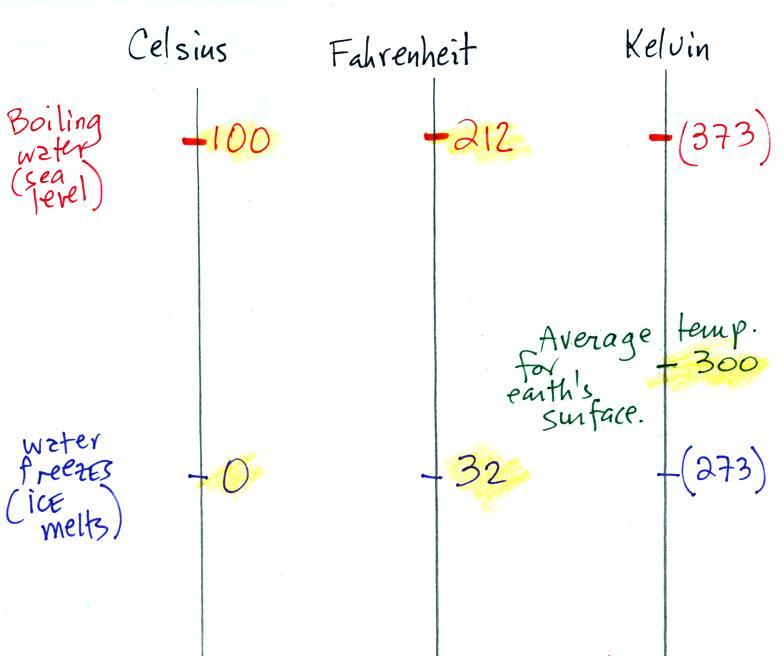
Speaking of
temperature scales
You should remember the temperatures of the
boiling point and freezing point of water on at least the
Fahrenheit and Celsius scales (and the Kelvin scale if
you want to). 300 K is a good easy-to-remember value for
the global annual average surface temperature of the
earth. Remember 300 K and also that temperature never
goes below zero on the Kelvin scale.
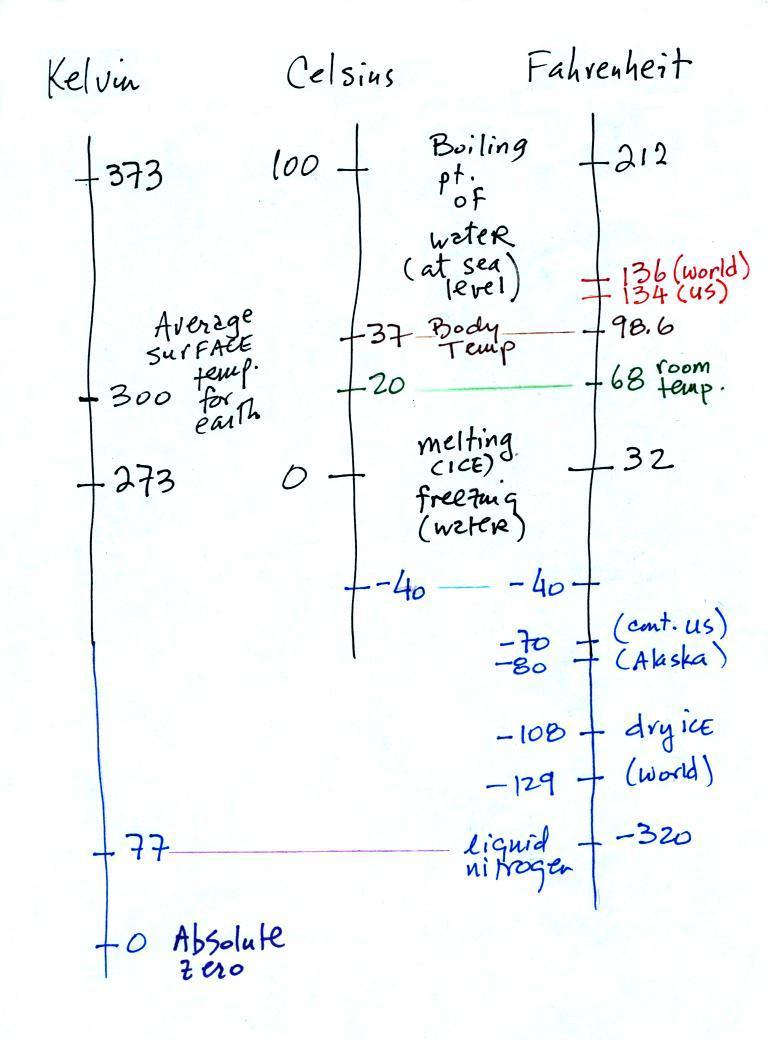
You certainly don't need to try to remember
all these numbers. The world high temperature record
value of 136 F above was measured in Libya at a location that
was only about 35 miles from the Mediterranean coast.
Water, as we have seen, moderates climate so it seemed odd
that such a high temperature would have been recorded
there. The World Meteorological Organization recently
decided the 136 F reading was invalid and the new world record
is the 134 F measurement made in Death Valley.
The continental US cold temperature record of -70 F was
set in Montana and the -80 F value in Alaska. The world
record -129 F was measured at Vostok station in
Antarctica. This unusually cold reading was the result
of three factors: high latitude, high altitude, and location
in the middle of land rather than being near or surrounded by
ocean (again water moderates climate, both hot and
cold).
Liquid nitrogen is very cold but it is still quite a bit
warmer than absolute zero. Liquid helium gets within a
few degrees of absolute zero, but it's expensive and there's
only a limited amount of helium available. So I would
feel guilty bringing some to class and I don't think it would
look any different than liquid nitrogen.