Tuesday Sep. 2, 2014
A medley of bluegrass music before class this morning: Nickel
Creek "Smoothie
Song", Crooked Still "American Tune"
, Black Prarie "Nowhere
Massachusetts", and the Punch Brothers "Sometimes".
Just of handful of additional sets of Expt.
#1 materials vanished quickly before class started
today. Those of who that are on the waiting
list can continue to wait or you might think about changing
to Expt. #2 or Expt. #3. Those of you with Expt. #1
materials might think of getting the experiment started and out of
the way. That will free up materials for people on the
waiting list.
Keep an eye out for the first
of the 1S1P report topics. They'll be appearing online
sometime between now and class on Thursday.
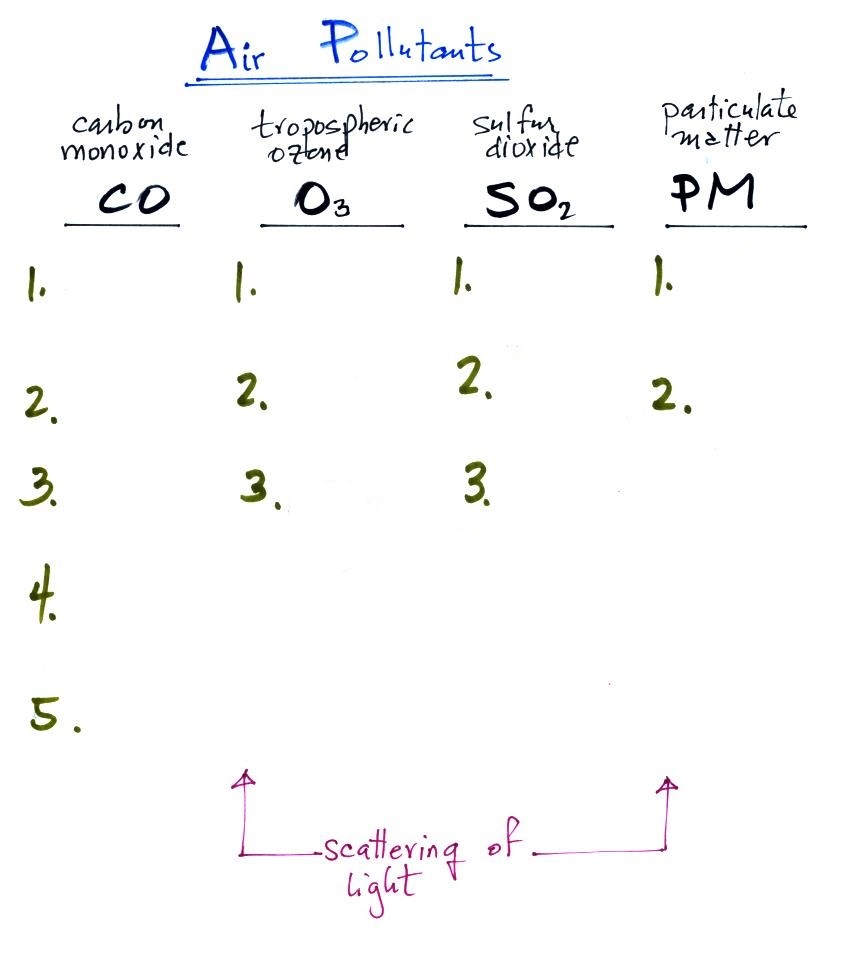
Air Pollutants
Today and Thursday we will be looking at four air
pollutants. They are carbon monoxide, tropospheric ozone,
sulfur dioxide, and particulate matter. They're listed below
together with an idea of the number of main points you should
remember and understand about each.
Today's class will also feature a light scattering
demonstration. It's a fairly simple concept and helps to
make different kinds of smog and particulate matter visible.
Light scattering also shows up in lots of additional and
unexpected places. We will also produce some photochemical
smog in a second separate demonstration (safely confined in a
glass bottle).
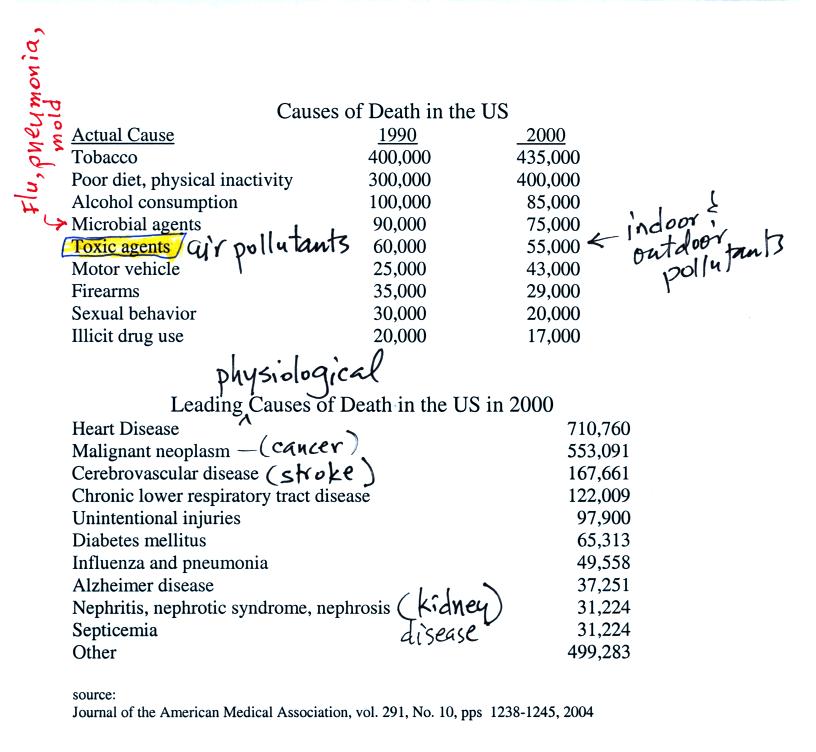
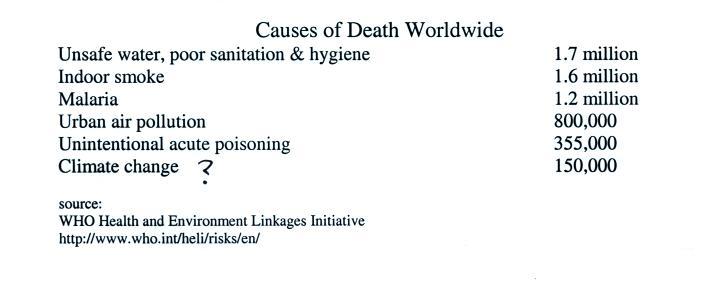
Air Pollution is a serious health hazard in the US and
around the globe (click here to download a
copy of the information below). The
lists below give some idea of how serious a threat it is.
The top list shows the external or
environmental agent that causes death. The second list
is the physiological or internal bodily function that
ultimately leads to your demise. Keep in mind that many
of these numbers are difficult to measure and some may contain
a great deal of uncertainty. The row that is
highlighted, toxic agents, contains estimates of deaths caused
by indoor and outdoor air pollution, water pollution, and
exposure to materials such as asbestos and lead both in the
home and at the work place. It is estimated that 60% of
the deaths are due to exposure to particulate matter,
something that we will examine in a little more detail later
in the week.
.
I'm not sure how the researchers determine that 150,000 people are
killed by climate change every year.
The Blacksmith
Institute listed the Top 10 polluted places in the
world in a 2007 report. The report has received a lot of
worldwide attention. If you go to this address (click on
2007 at the top edge of the page) you can view the report online
or download and print a copy of the report. This is just in
case you are interested (click on some of the other years also if
you do go to the site). And note they are concerned with all
types of pollution, not just air pollution.
You may have heard of the record setting levels of air
pollution that sometimes affect Beijing, China. Here's a
link to a pretty good collection of photographs. Much
of this is particulate pollution which is something we'll cover
later this week. In addition to being a health hazard,
particulates can have a dramatic effect on visibility.
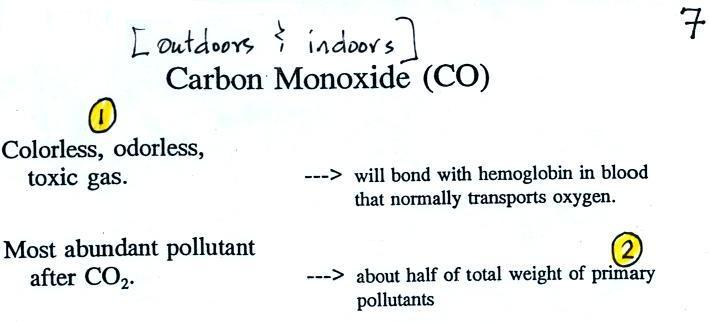
Carbon monoxide
We'll start our section on air pollutants with carbon
monoxide. You'll find additional information on carbon
monoxide and other air pollutants at the Pima County
Department of Environmental Quality website and also at the
US Environmental Protection Agency
website.
The material above is from page 7 in the photocopied
ClassNotes. We will mostly be talking about carbon monoxide
found outdoors, where it would rarely reach fatal
concentrations. CO is a serious hazard indoors also where it
can (and does) build up to deadly concentrations (several
people
were
almost
killed
in
Tucson
in
December 2010 for example). Between
1999 and 2010 an average of 430 people were killed per year
from unintentional, non-fire-related carbon monoxide poisoning
according to the Centers for Disease Control and Prevention (ref).
Carbon monoxide is insidious, you can't smell it or see it and
it can kill you (Point 1).
Once
inhaled,
carbon
monoxide
molecules
bond
strongly
to
the
hemoglobin
molecules
in
blood
and
interfere
with
the
transport
of
oxygen
throughout
your
body.
The
article above about carbon monoxide poisoning mentions that the
victims were put inside a hyperbaric (high pressure) chamber
filled with pure oxygen. This must force oxygen into the
blood and displace the carbon monoxide.
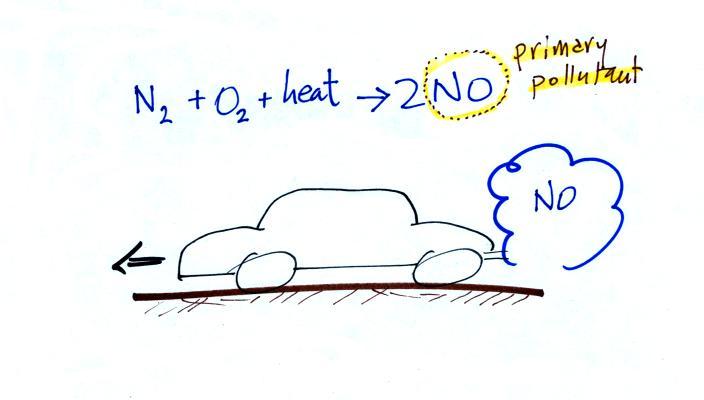
CO is a primary pollutant (Point
2 above). That means it goes directly from a source
into the air, CO is emitted directly from an
automobile tailpipe into the atmosphere for example.
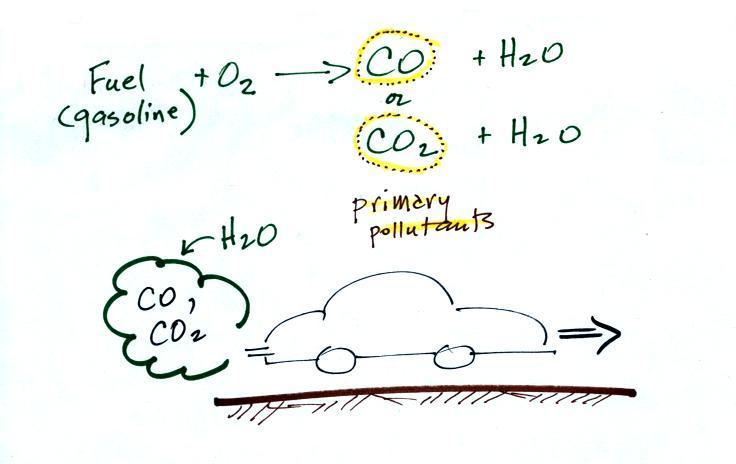
The difference between primary and secondary pollutants
is probably explained best in a series of pictures.
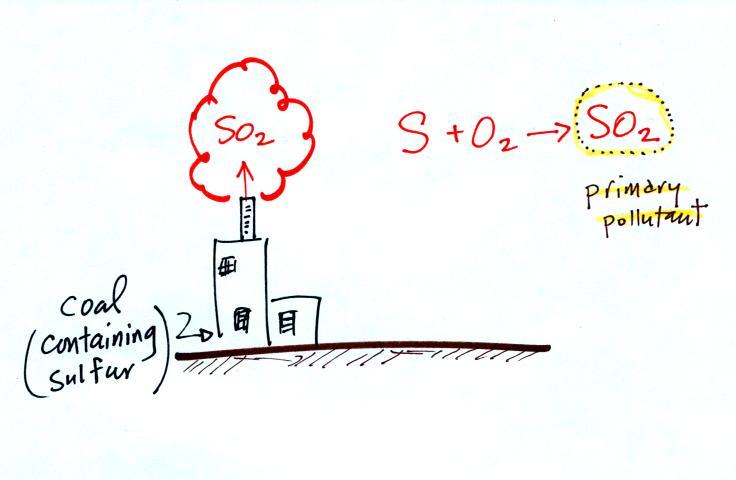
In addition to carbon monoxide, nitric oxide (NO) and sulfur
dioxide (SO2), are also
primary pollutants. They all travel directly from a source
(automobile tailpipe or factory chimney) into the
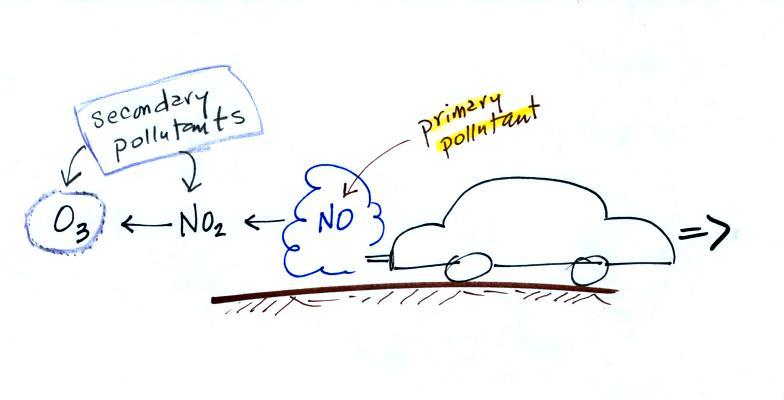
atmosphere. Ozone is a secondary pollutant (and here we mean
tropospheric ozone, not stratospheric ozone). It wouldn't be
present in the exhaust coming out of a car's tailpipe. It
shows up in the atmosphere only after a primary pollutant has
undergone a series of reactions without other chemical compounds
in the air.
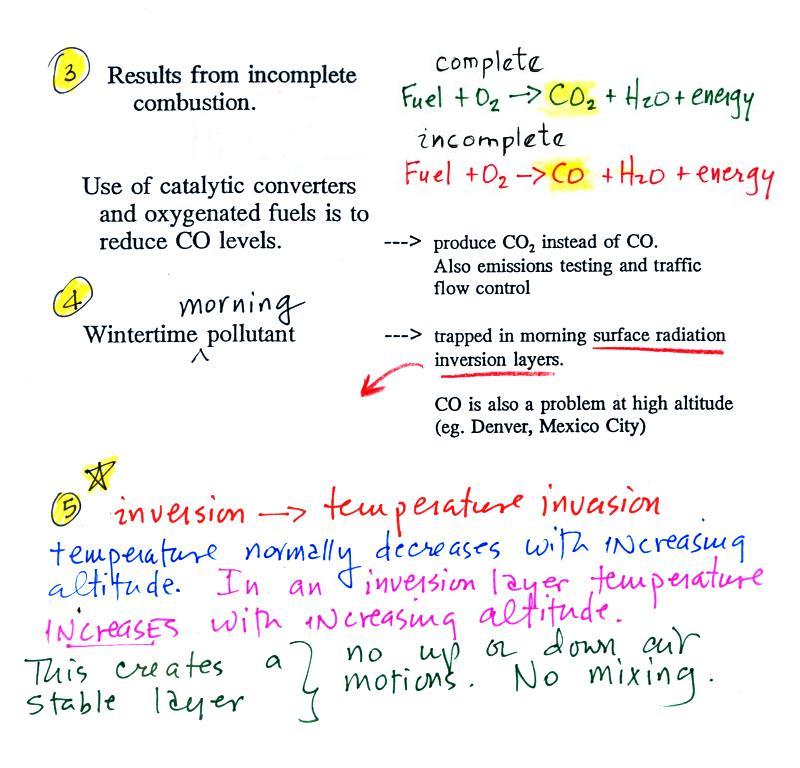
Point 3 explains that CO is produced by incomplete
combustion of fossil fuel (insufficient oxygen). Complete
combustion would produce carbon dioxide, CO2. Cars and trucks
produce much of the CO in the atmosphere in Tucson.
Special formulations of gasoline (oxygenated fuels) are used
during the winter months to try to reduce CO emissions. The
added ethanol has the effect of adding more oxygen to the
combustion process.
Vehicles must also be fitted with a catalytic converter
that will change CO into CO2
(and also NO into N2 and O2 and hydrocarbons into H2O and CO2).
In Pima County, vehicles must also pass an emissions test every
year to insure that the car is burning fuel as cleanly as
possible.
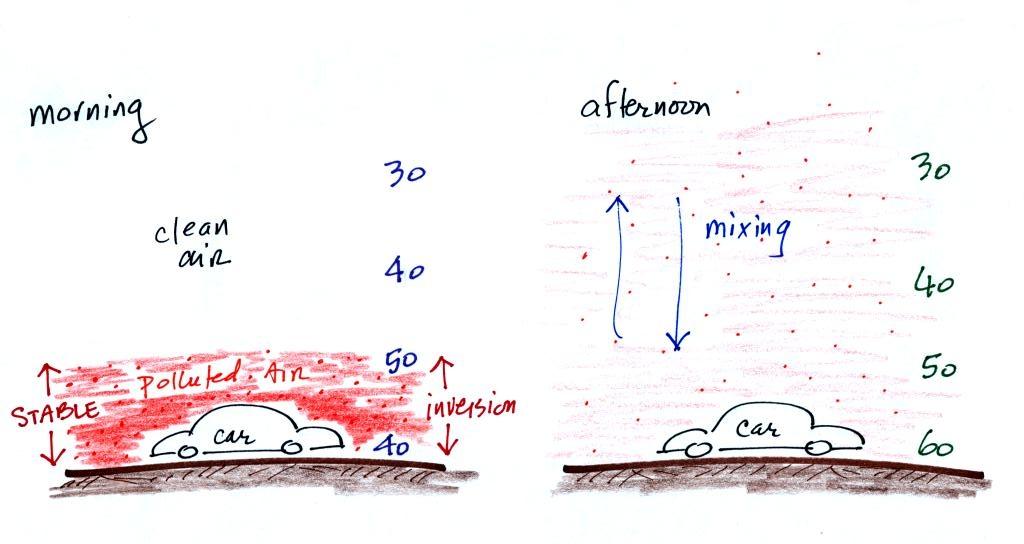
In the atmosphere CO concentrations peak on winter mornings (Point 4). The reason for
this is surface radiation inversion layers. They are most
likely to form on cold winter mornings.
When we say inversion layer (Point 5), we mean a temperature inversion, a
situation where air temperature increases with increasing
altitude, just the opposite of what we are used to.
This produces stable atmospheric conditions which means there is
little up or down air motion.
There is very little vertical mixing in a stable air
layer.
In the left figure above, notice how
temperature increases from 40 F to 50 F in the thin air
layer next to the ground. It then begins to decrease as
you move further up). This bottom layer is the stable
inversion layer. When CO is emitted into the thin stable
layer, the CO remains in the layer and doesn't mix with cleaner
air above. CO concentrations build.
In the afternoon, the ground warms. Air temperatures
decrease with increasing altitude from the ground upward.
Air in contact with the ground warms, becomes buoyant, and
rises. Cooler air comes down from above and
replaces. Upward and downward motions are
initiated. The atmosphere is now unstable. CO
emitted into air at the surface mixes with cleaner air
above. The same amount of CO is added to the air but it is
mixed in a larger volume. The CO concentrations are
effectively diluted.
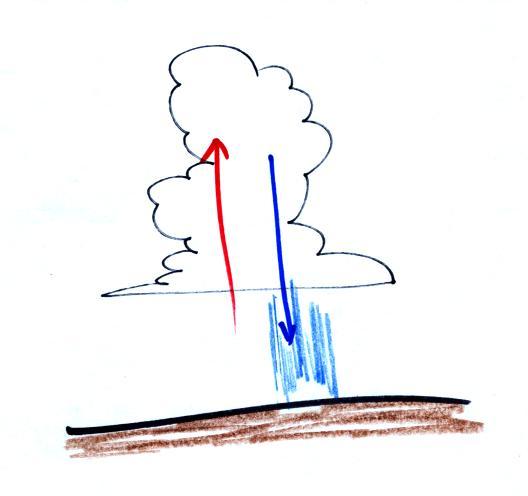
Thunderstorms contain strong up (updraft) and down (downdraft)
air motions. Thunderstorms are a sure indication of unstable atmospheric
conditions.
This
Afternoon

Sunny
High: 102
°F
|
Wednesday
Sunny
High: 102
°F
|
Thursday

Isolated
Thunderstorms
High: 100
°F
|
Friday

Scattered
Thunderstorms
High: 97 °F
|
Saturday

Scattered
Thunderstorms
High: 94 °F
|
Speaking of thunderstorms, they are back in the forecast
by the end of the week (the figure above is from the Tucson National
Weather Service web page)
Light scattering demonstration
We spent the next portion of today's class learning about the
scattering of light. You are able to see a
lot of things in the atmosphere (clouds, fog, haze, even the
blue sky) because of scattering of light. We'll try to
make a cloud of smog in class later today. The
individual droplets making up the smog cloud are too small to
be seen by the naked eye. But you will be able to see
that they're there because the droplets scatter light.
So we took some time for a demonstration that tried to show
you exactly what light scattering is.
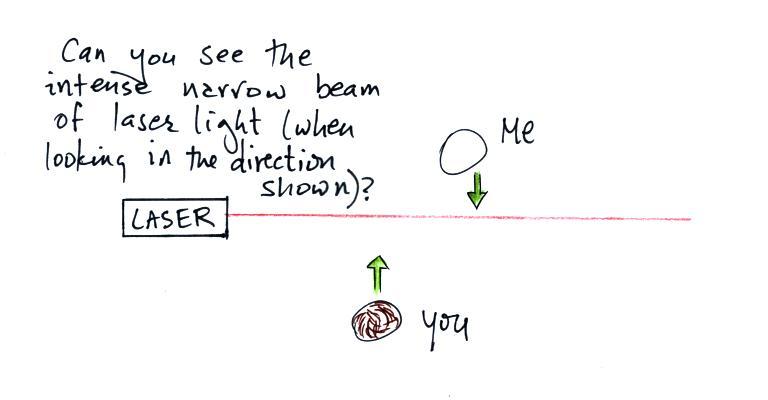
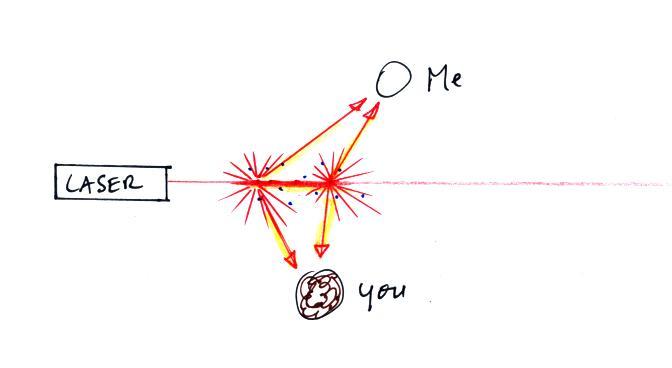
In the first part of the demonstration a narrow beam of intense
red laser light was directed from one side of the classroom to the
other.
We're looking down from above in the the figure
above. Neither the students or the instructor could see
the beam of light. To see the laser light some of it
would need to be traveling toward you rather than from one
side of the room to the other.
The instructor would have been able to see the beam if he had
stood at the end of the beam of laser light and looked back along
the beam of light toward the laser. That wouldn't have been
a smart thing to do, though, because the beam was strong enough to
possibly damage his eyes (there's a warning on the side of
the laser).
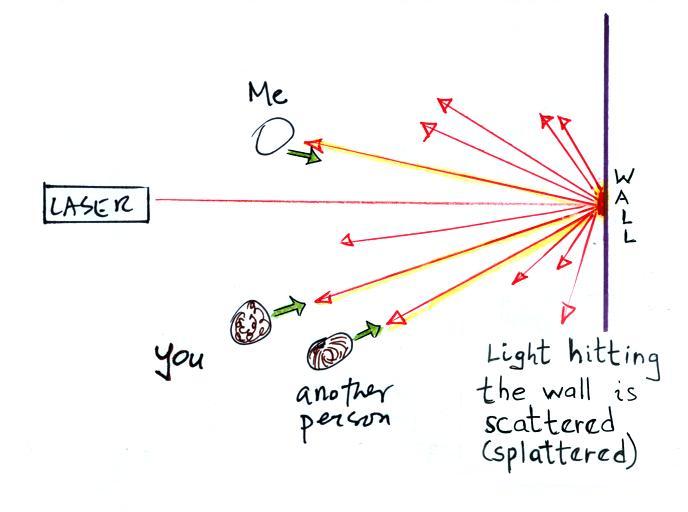
Everybody was able to see a bright red spot where the laser
beam struck the wall.
This is because when the intense beam of
laser light hits the wall it is scattered (I think splattered is a more
descriptive term). The original beam is broken up into
a multitude of weaker rays of light that are sent out in all
directions. There is a ray of light sent in the
direction of every student in the class. They see the
light because they are looking back in the direction the ray
came from. It is safe to look at this light
because the original intense beam is split up into many much
weaker beams.
Next we clapped some erasers together so that some small
particles of chalk dust fell into the laser beam.
Now instead of a single spot on the wall, students saws
lots of points of light coming from different positions along a
straight segment of the laser beam. Each of these points of
light was a particle of chalk, and each piece of chalk dust was
intercepting laser light and sending light out in all
directions. Each student saw a ray of light coming from each
of the chalk particles. With a cloud of chalk dust you are
able to see segments of the laser beam.
We use chalk because it is white, it will scatter rather than
absorb visible light. What would you have seen if black
particles of soot had been dropped into the laser beam?
In the last part of the demonstration we made a cloud by pouring
some liquid nitrogen into a cup of water. The cloud droplets
are much smaller than the chalk particles but are much more
numerous. They make very good scatterers.
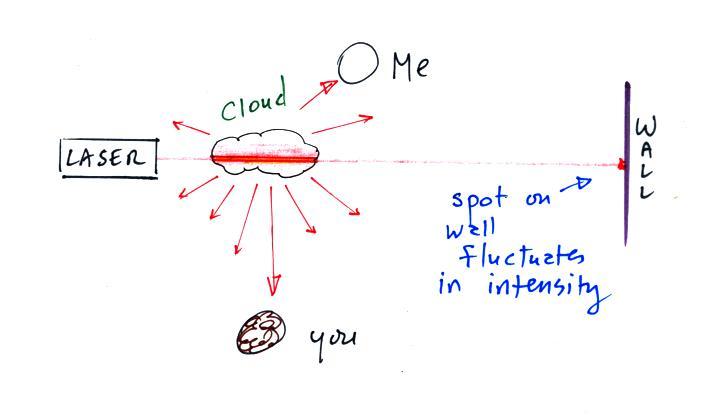
The beam of laser light was very
bright as it passed through the small patches of cloud.
The cloud droplets did a very good job of scattering laser
light. So much light was scattered that the spot on the
wall fluctuated in intensity (the spot dimmed when lots of light
was being scattered, and brightened when not as much light was
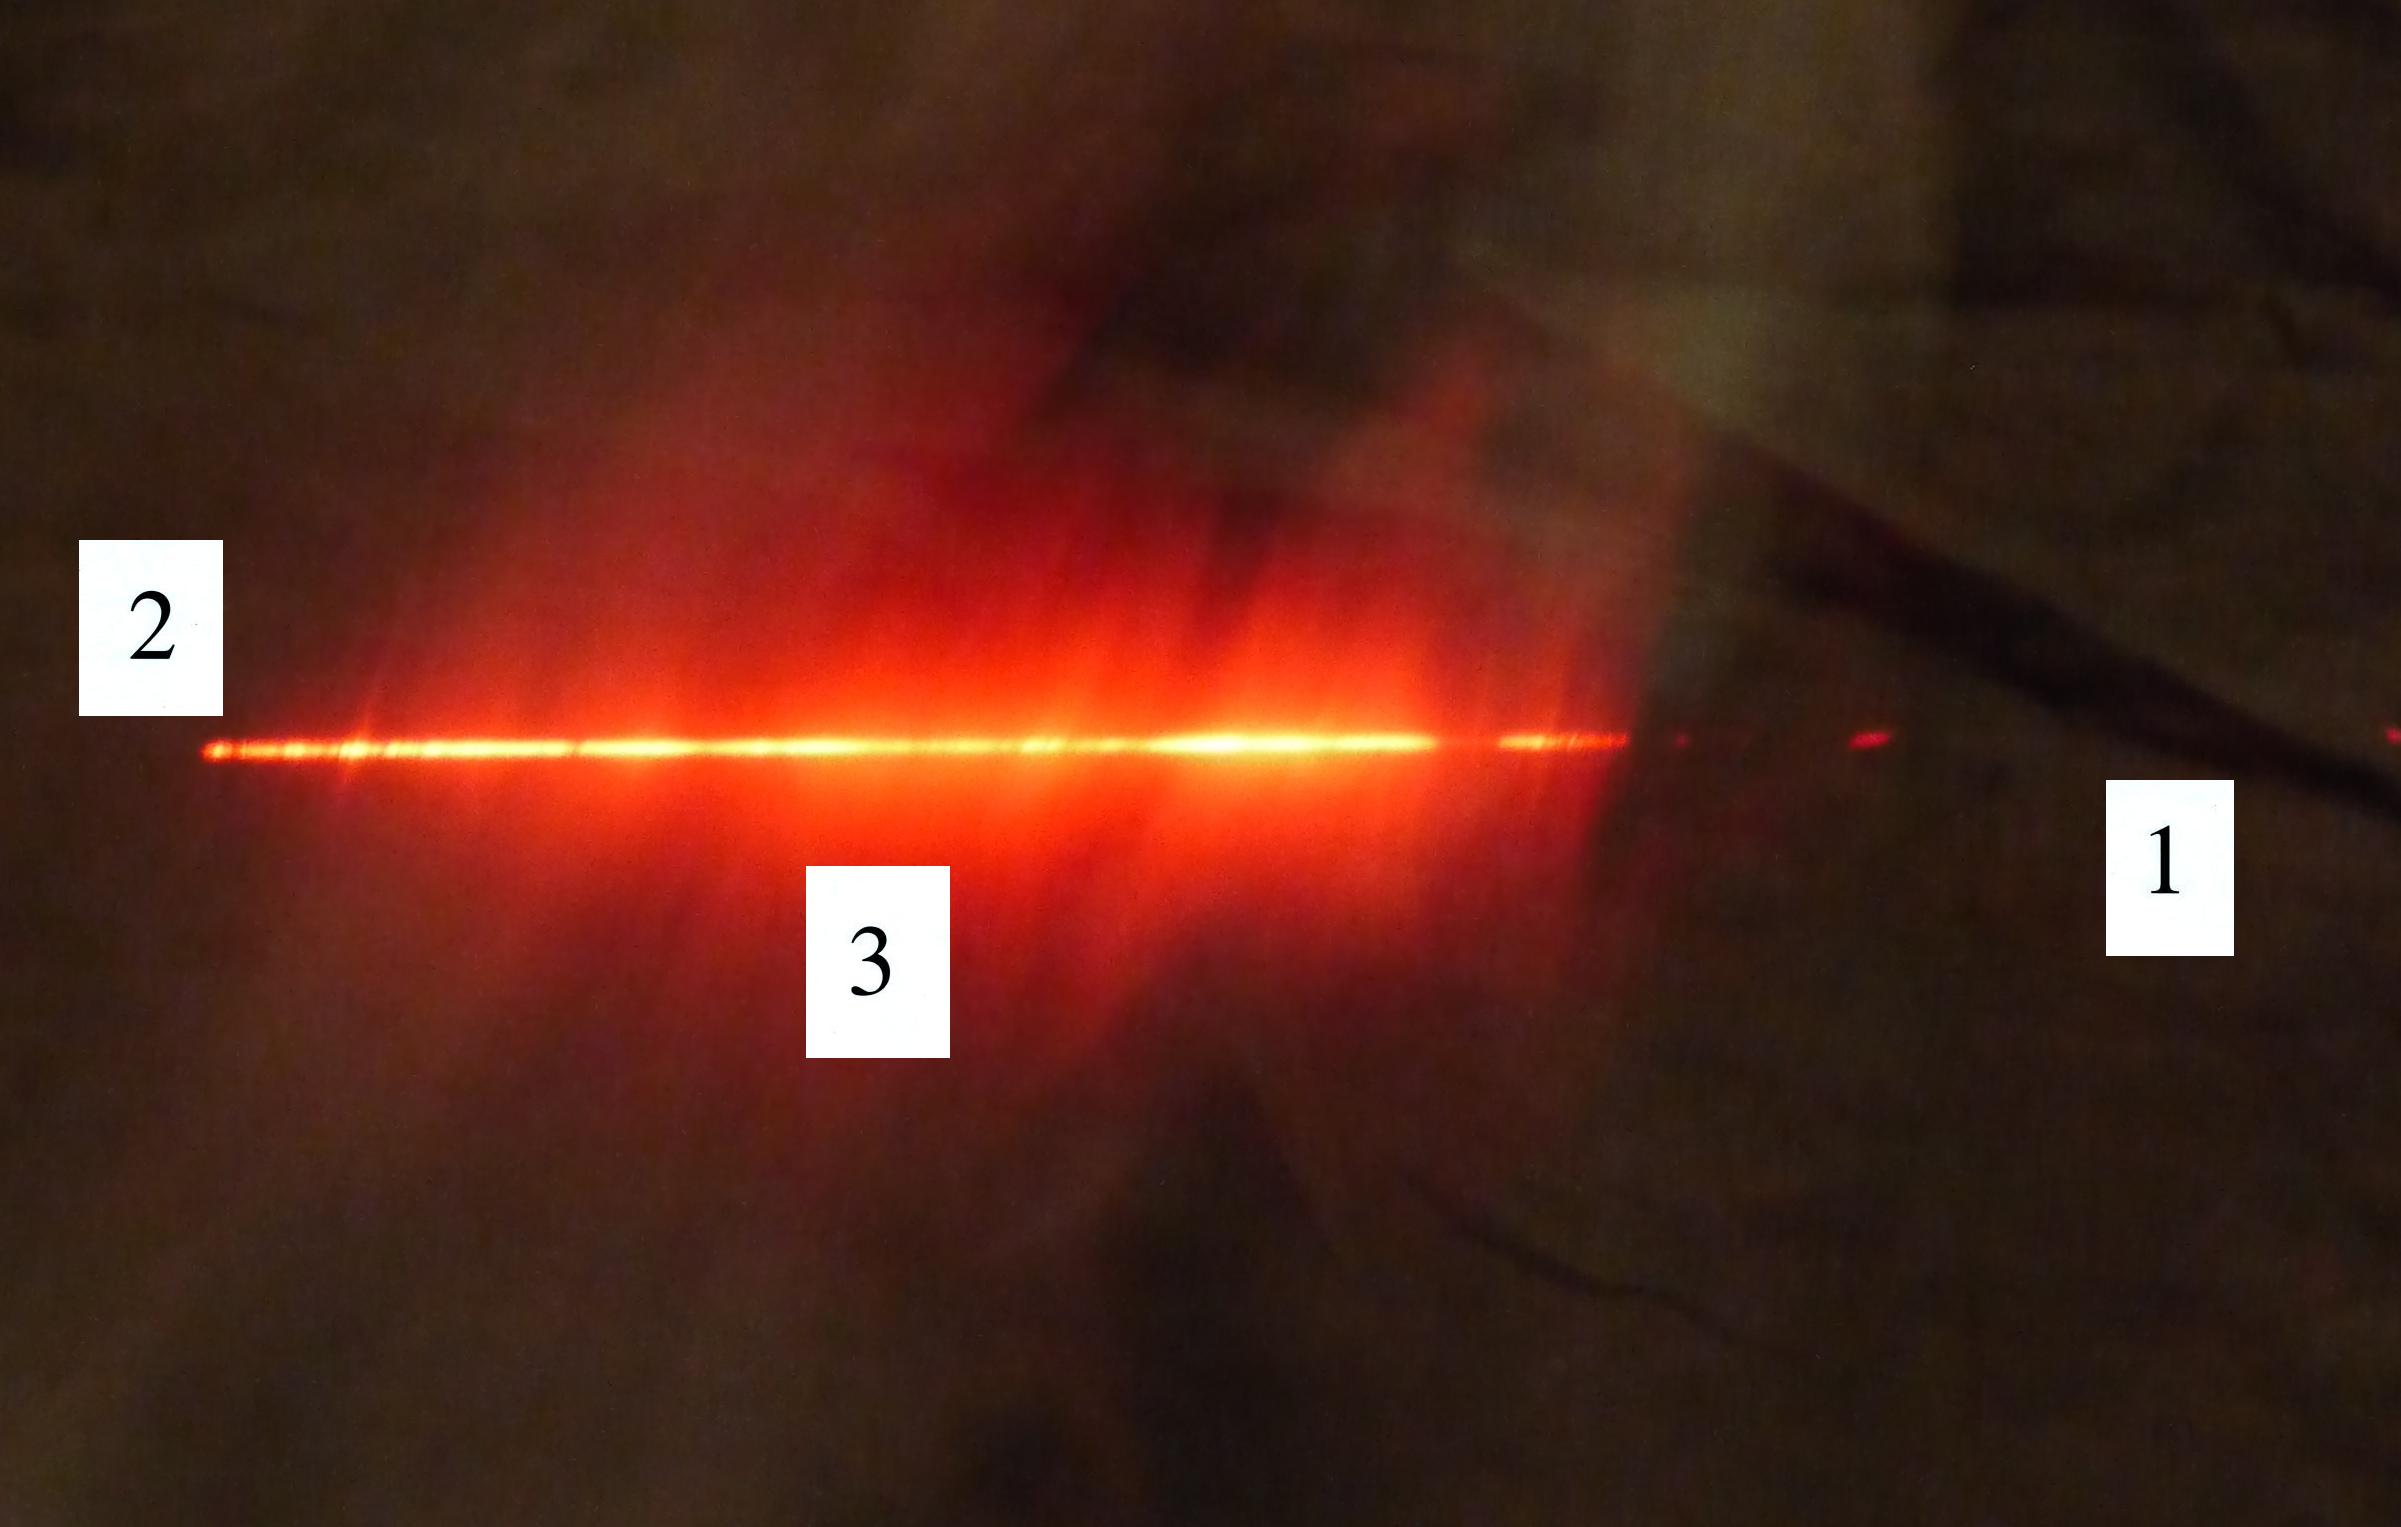
scattered). Here's a photo I took back in my office.
The laser beam is visible in the left 2/3 rds of the picture
because it is passing through cloud and light is being scattered
toward the camera. There wasn't any cloud on the right
1/3rd of the picture so you can't see the laser beam over near
Point 1.
Good (stratospheric) and bad
(tropospheric) ozone
Next we turned our attention to ozone, another outdoor
pollutant of concern.
Ozone has a kind of Dr.
Jekyll
and
Mr Hyde personality.
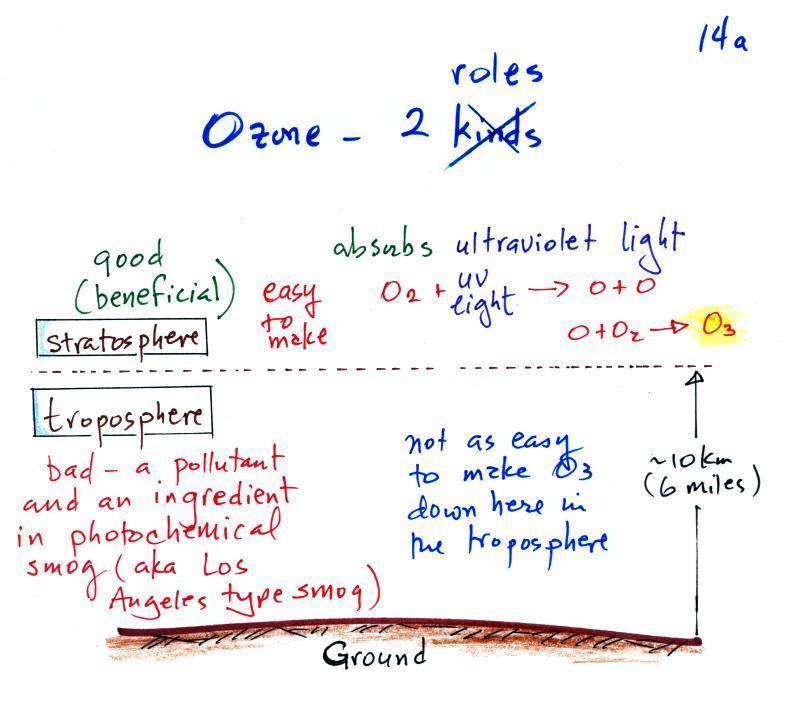
The figure above can be found on p. 14a in the photocopied
ClassNotes. The ozone layer (ozone in the stratosphere) is
beneficial, it absorbs dangerous high energy ultraviolet light
(which would otherwise reach the ground and cause skin cancer,
cataracts, etc. There are some types of UV light that
would quite simply kill us).
Ozone in the troposphere is bad, it is toxic and a
pollutant. Tropospheric ozone is also a key component of
photochemical smog (also known as Los Angeles-type smog)
We'll be making some photochemical smog in a class
demonstration. To do this we'll first need some ozone;
we'll make use of the simple stratospheric recipe (shown above)
for making what we need instead of the more complex tropospheric
process (the 4-step process in the figure below). You'll
find more details a little further down in the notes.
At the top of this figure (p. 15 in the packet of
ClassNotes) you see that a more complex series of reactions is
responsible for the production of tropospheric ozone. The
production of tropospheric ozone begins with nitric oxide
(NO). NO is produced when nitrogen and oxygen in air are
heated (in an automobile engine for example) and react.
The NO can then react with oxygen in the air to make nitrogen
dioxide, the poisonous brown-colored
gas that I used to make in class.
Sunlight can dissociate (split) the nitrogen dioxide molecule
producing atomic oxygen (O) and NO. O and O2 react in a 4th step to make ozone (O3) just like happens in the
stratosphere. Because ozone does not come directly from an
automobile tailpipe or factory chimney, but only shows up after
a series of reactions in the air, it is a secondary
pollutant. Nitric oxide (NO) would be the primary
pollutant in this example.
NO is produced early in the day (during the morning rush
hour). The concentration of NO2 peaks somewhat later. Because sunlight is
needed in step #3 and because sunlight is usually most intense
at noon, the highest ozone concentrations are usually found in
the afternoon. Ozone concentrations are also usually
higher in the summer when the sunlight is more intense than at
other times of year.
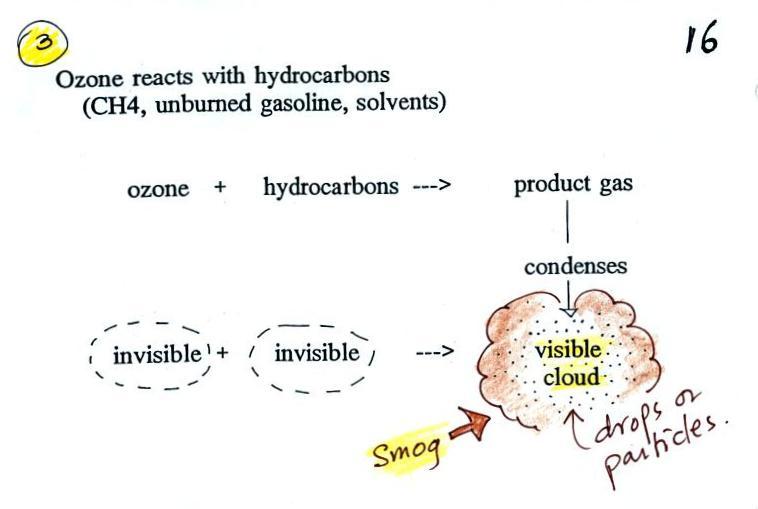
Once ozone is formed, the ozone can react with a hydrocarbon
of some kind to make a product gas. The ozone,
hydrocarbon, and product gas are all invisible, but the product
gas sometimes condenses to make a visible smog cloud or
haze. The cloud is composed of very small droplets or
solid particles. They're too small to be seen but they are
able to scatter light - that's why you can see the cloud.
Photochemical smog demonstration
Here's a pictorial summary of the photochemical smog
demonstration.
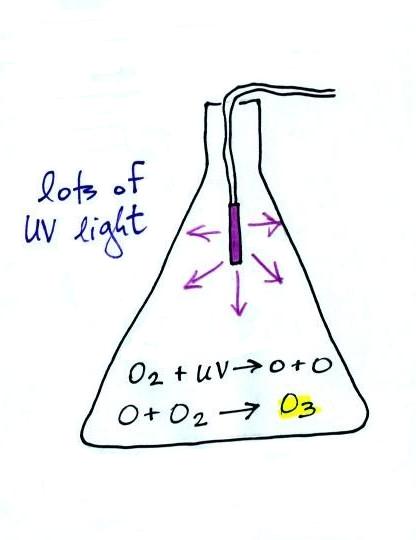
We started by putting a small "mercury
vapor" lamp inside a flash. The bulb produces a lot of
ultraviolet light (the bulb produced a dim bluish light that
we could see, but the UV light is invisible so we had no way
of really telling how bright it was). The UV light and
oxygen in the air produced a lot of ozone (you could easily
have smelled it if you had taken the cover off the flask).
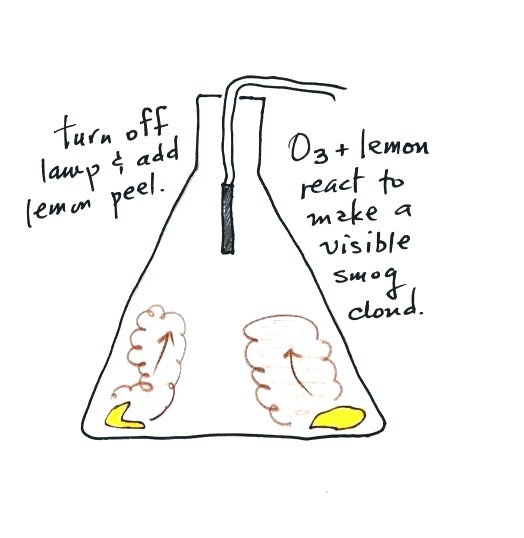
After a few minutes we turned off the lamp and put a few
pieces of lemon peel into the flash. Part of the smell
that comes from lemon peel is limonene, a hydrocarbon. The
limonene gas reacted with the ozone to produce a product gas of
some kind. The product gas condensed, producing a visible
smog cloud (the cloud was white, not brown as shown
above). I meant (but forgot) to shine the laser beam
through the smog cloud to reinforce the idea that we are seeing
the cloud because the drops or particles scatter light.
Here's a
video that I found of a slightly different version of the
demonstration. Instead of using UV light to produce the
ozone the demonstration uses an electrical discharge (the
discharge travels from the copper coil inside the flask to the
aluminum foil wrapped around the outside of the flask).
The overall effect is the same. The discharge splits an
oxygen molecule O2 into two oxygen atoms.
O2 + UV light
---> O + O
One of the oxygen atoms reacts with an oxygen molecule to form O3
O + O2
---> O3
The smog cloud produced in the video is a little thicker than
the one produced in class. I suspect that is because they
first filled the flask with pure oxygen, 100% oxygen, before
making the ozone. I used air in the room which is 20%
oxygen. More oxygen in the flask means more ozone and a
thicker cloud of Los Angeles type smog.
Summary
Back to our summary list
Air quality index
We finished class a little early to leave me time to clean up the
mess I had made and to get everything ready for a repeat
performance in the 9:30 class. I've gone ahead and stuck in
some information on the Air Quality Index. We didn't cover this in class today
and will go over this following material at the start of class on
Thursday.
A large metropolitan area like Tucson and Pima County is
required to continuously measure concentrations of several air
pollutants. You can read more about air quality
monitoring done by the Pima County Department of Environmental
Quality here.
A photograph of one of the monitoring sites (click here
to see a map of all 18 monitoring sites) is shown below.

monitoring site at Corona de Tucson (
source)
The main pollutants being monitored are shown below (see the top
of p. 8 in the ClassNotes). You can read more about air
quality monitoring done by the Pima County Department of
Environmental Quality here.
The concentration of lead in the air
has decreased significantly since lead was removed from
gasoline (the
following quote is from a Wikipedia
article on gasoline: "In the US, standards to phase
out leaded gasoline were first implemented in 1973 .....
In 1995, leaded fuel accounted for only 0.6% of total
gasoline sales ...... From 1 January 1996, the Clean Air Act banned the sale
of leaded fuel for use in on-road vehicles. Possession and
use of leaded gasoline in a regular on-road vehicle now
carries a maximum $10,000 fine in the US.")
In Tucson, carbon monoxide, ozone, and particulate
matter are of primary concern and daily measurements are
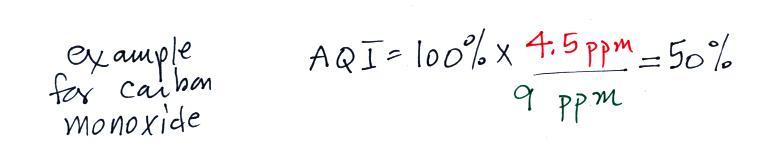
reported in the city newspaper. If
I were to tell you that the measured carbon monoxide
concentration yesterday was 4.5 ppm (averaged over an 8 hour
time period) would you be able to tell me whether that was
high or low, hazardous or not? Most people wouldn't be
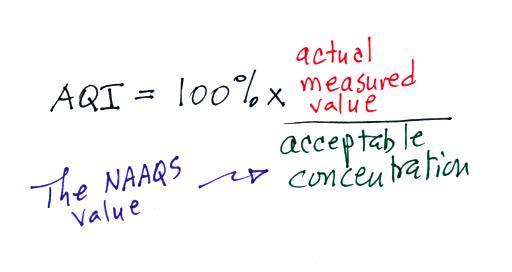
able to answer that question. So rather than report the
actual measured values, an Air Quality Index value is reported
instead. The AQI is the ratio of the
measured to accepted concentrations multiplied by 100%.
The acceptable levels are known
as the National Ambient Air Quality Standards (NAAQS)
for example, the NAAQS for carbon monoxide are:
9 ppm (average value over an 8 hour
period)
35 ppm (average over a 1 hour period)
The air quality in this case would be good. Air becomes
unhealthy when the AQI value exceeds 100%. The
units "ppm", by the way, stand for "parts per million." A CO
concentration of 4.5 ppm would mean that in 1 million air
molecules 4.5 of them would be carbon monoxide.
Current Air Quality Index
values for Tucson are available online.