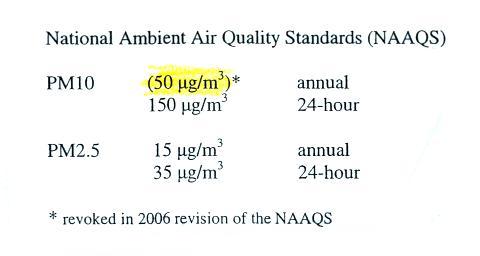
Allowed levels are known as the National
Ambient Air Quality Standards (NAAQS) (see
this
reference for more details)
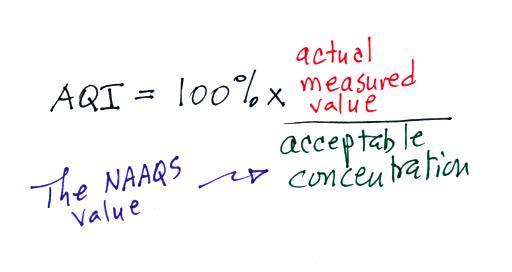
Air Quality Index (AQI)
In Tucson, carbon monoxide, ozone, and particulate matter are
of primary concern and daily measurements are reported online
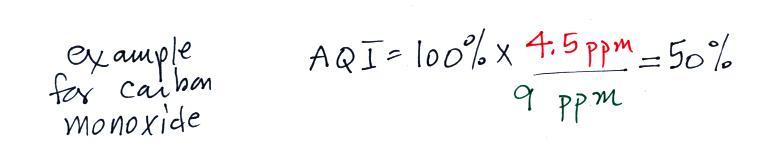
and in the city newspaper. Let suppose a CO
concentration of 4.5 ppm (8 hour average) was measured
yesterday in Tucson. Would this be an acceptable or
hazardous value? Most people wouldn't be able to answer
that question. So rather than report the actual measured
values, an Air Quality Index value is reported
instead. The AQI is the ratio of the
measured to accepted concentrations multiplied by 100%.
It's similar to computing the percentage score on a quiz,
you divide the points you earned by total points possible and
multiply by 100%.
for example, the NAAQS for carbon monoxide are:
9 ppm (average value over an 8 hour
period) - this value is used in the AQI calculation
35 ppm (average over a 1 hour
period)
The air quality in this case would be good. The lower
the AQI value the better (in the case of a quiz score you want
the value to be as high as possible). Air becomes
unhealthy when the AQI value exceeds 100%. The
units "ppm", by the way, stand for "parts per million."
A CO concentration of 4.5 ppm would mean that in 1 million air
molecules 4.5 of them would be carbon monoxide.
Current Air Quality
Index values for Tucson are available online.
Symptoms of carbon monoxide poisoning
Carbon monoxide is a
serious hazard indoors where it can build to much
higher levels than would ever be found
outdoors. This next link is to a newspaper
article describing an
incident at Virginia Tech (that occurred near the
beginning of the school year in 2007). Carbon
monoxide
from
a malfunctioning hot water heater sickened 23
Virginia Tech students in an apartment
complex. The CO concentration is thought to have
reached 500 ppm. You
can get an idea of what kinds of symptoms and effects that
concentrations this high could cause from the figure in
the middle of p. 9 in the photocopied ClassNotes.
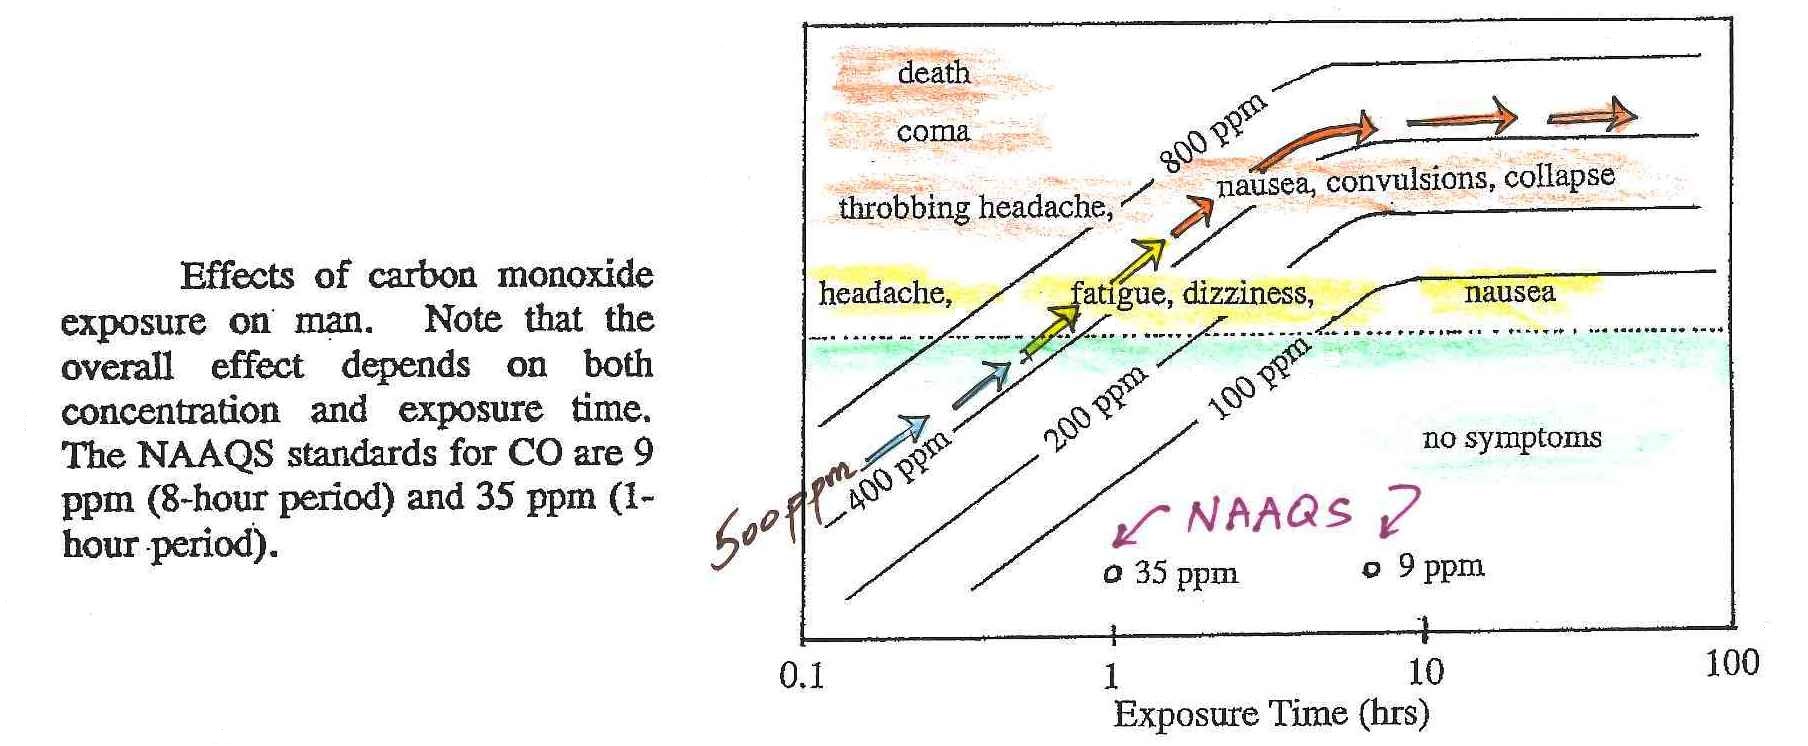
The effects of CO depend on what concentration you
exposed to and the duration of the exposure. In this
case we'll follow the arrows from lower left to the upper
right of the figure. The arrows represent a
concentration of about 500 ppm. Beginning at lower
left we see that we wouldn't experience any symptoms with an
exposure to even 500 ppm for just a few minutes. Note
also the NAAQS values near the bottom of the graph.
Beginning at about 1 hour exposure the arrows cross from the
lower green half to the upper yellow and orange half
of the graph. Beginning at 1 hour you would experience
headache, fatigue, dizziness, nausea. The symptoms
would worsen if the exposure lasted for a few hours:
throbbing headache, nausea, convulsions, and collapse.
The 500 ppm line comes very close to coma and death part of
the graph. At Virginia Tech several
students were found unconscious and a few had difficulty
breathing on their own but were resuscitated.
Carbon monoxide alarms are relatively inexpensive
(~$50) and are available at most hardware stores. They
will monitor CO concentrations indoors and warn you when
concentrations reach hazardous levels.
Indoors CO is produced by gas furnaces and water heaters
that are either operating improperly or aren't being
properly vented to the outdoors. A few hundred people
are killed indoors by carbon monoxide every year in the
United States. An operating carbon
monoxide alarm probably saved the lives of the
6 Tucson residents in December 2010. You can
learn more about carbon monoxide hazards and risk prevention
at the Consumer
Product Safety Commission web page.
Sulfur dioxide (SO2
)
We turn now to the 3rd of the air
pollutants we will cover, sulfur
dioxide (SO2 ).

Sulfur dioxide is produced
by the combustion of sulfur containing fuels such as
coal. Combustion of fuel also produces carbon
dioxide and carbon monoxide. People probably first
became aware of sulfur dioxide because it has an
unpleasant smell. Carbon dioxide and carbon monoxide
are odorless. That is most likely why sulfur dioxide
was the first pollutant people became aware of.
I double checked on the smell of sulfur dioxide after
class and found two descriptions: one described it as the
smell of rotten eggs (I associate that with hydrogen
sulfide, H2S, which is also
poisonous) but also a pungent irritating odor which is
what I remember. Apparently sulfur dioxide is one of
the smells in a freshly struck match (or as someone
mentioned in fireworks).
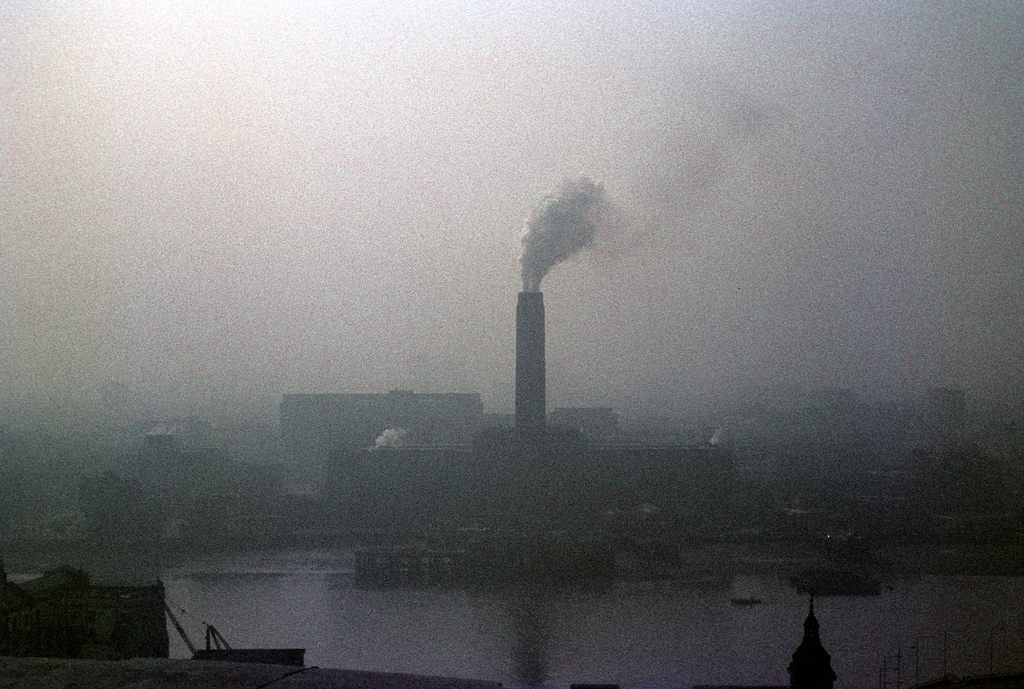
Volcanoes are a natural source of sulfur dioxide.
London-type smog
The inversion layer in this case lasted for several days and
was produced in a different way than the surface radiation
inversions we heard about when covering carbon monoxide.
Surface radiation inversions usually only last for a few
hours.
The term smog, a contraction of smoke + fog, was invented to
describe a mixture of smoke and fog, something that was fairly
common in the winter in London. The 1952 event was an
extreme case. Now we distinguish between "London-type
smog" which contains sulfur dioxide and photochemical or "Los
Angeles-type smog" which contains ozone.
Most of the
photographs below come
from articles published in 2002 and 2012, the
50th and 60th anniversaries of the event.
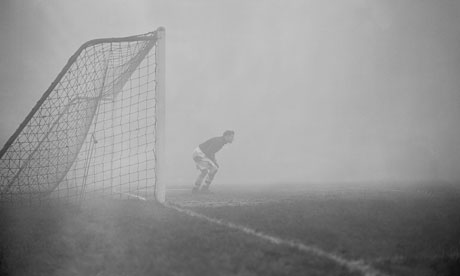
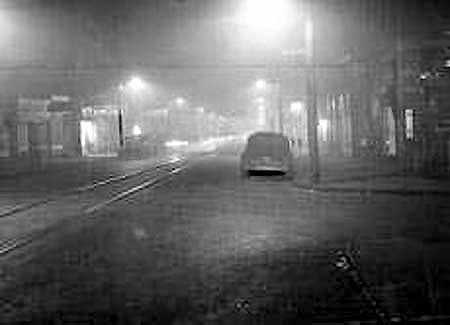
The caption to this
photo from The Guardian reads
"Arsenal goalkeeper Jack Kelsey peers into the
fog.
The 'smog' was so thick the game was eventually
stopped."
|
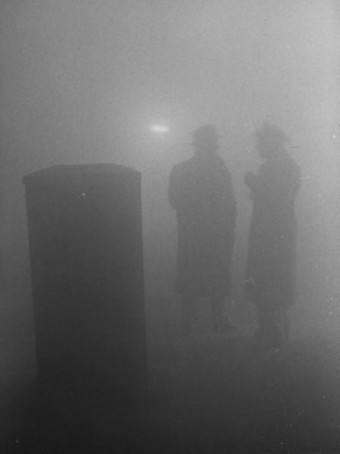
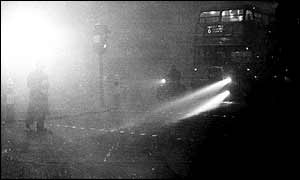
This is about the thickest smog I was able to
find. Visibility here is perhaps 10 or 20 feet.
(source
of this image)
|
|
|
|
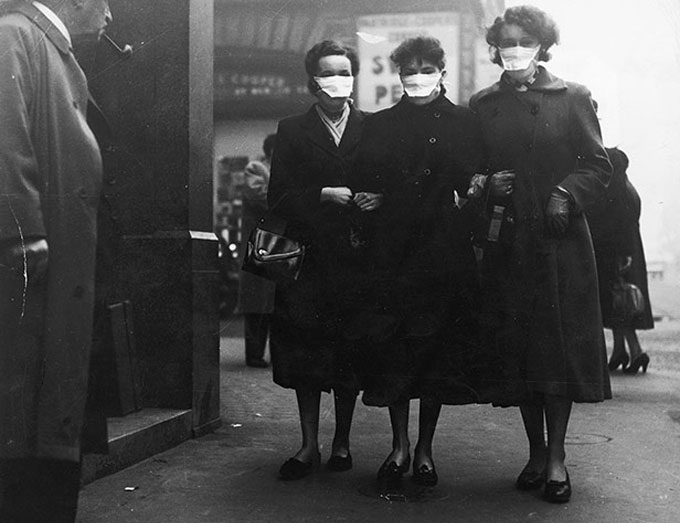
Smog masks from this
reference
The masks would filter out the smoke but not the
sulfur dioxide gas
|
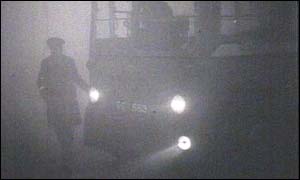
Here are some interesting photographs
of early and mid 20th century London.
The sulfur dioxide
didn't kill people directly. Rather
it would aggravate an existing condition of some
kind. The SO2 probably
also made people susceptible to bacterial
infections such as pneumonia. Here's
a link that discusses the
event and its health effects in more detail.
The Clean
Air Act of 1956 in England reduced smoke
pollution and emissions of sulfur dioxide.
However an
article in The Telegraph notes that London
air now exceeds recommended concentration limits
for nitrogen dioxide and particulates.
Air
pollution disasters involving sulfur dioxide have also
occurred in the US. One of the deadliest events was in
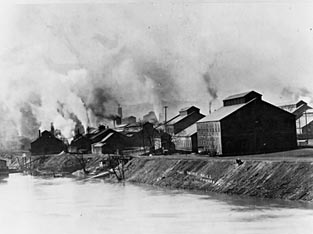
1948 in Donora, Pennsylvania.
The reference
material that contained this photographed clearly
stated "This eerie photograph was taken at noon on
Oct. 29, 1948 in Donora, PA as deadly smog enveloped the
town. 20 people were asphyxiated and more than 7,000
became seriously ill during this horrible event."
The photograph below shows some of the mills that
were operating in Donora at the time. Not only
where the factories adding pollutants to the air they
were undoubtedly adding hazardous chemicals to the water
in the nearby river.
from: http://www.eoearth.org/article/Donora,
Pennsylvania
The US passed its own
Clean Air Act in 1963. There have been several
major revisions since then. The EPA
began in late 1970 (following an executive order signed by
President Nixon)
"When Smoke Ran Like
Water," a book about air pollution is among
the books that you can check out, read, and
report on to fulfill part of the writing
requirements in this class (though I would
encourage you to do an experiment
instead). The author, Devra Davis,
lived in Donora Pennsylvania at the time of
the 1948 air pollution episode.
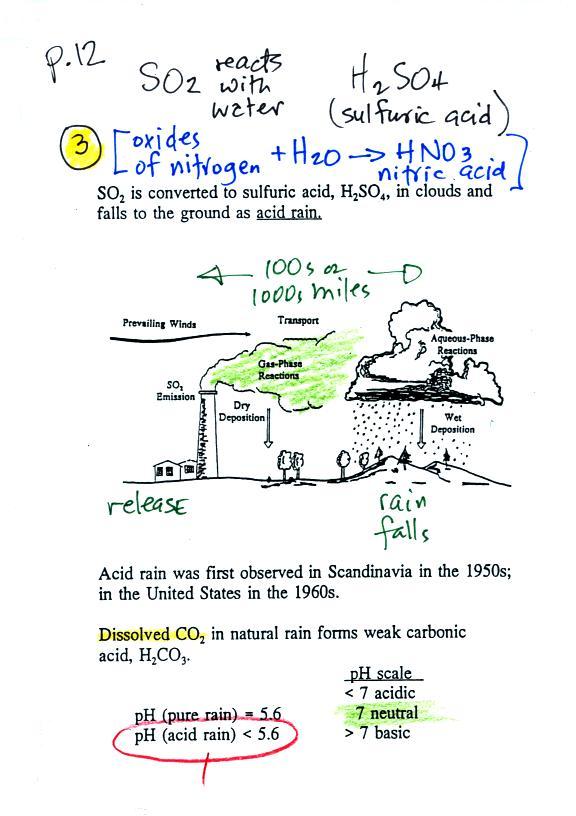
Acid rain
Sulfur dioxide is one of the pollutants
that can react with water in clouds to form acid
rain (some of the oxides of nitrogen can also
react with water to form nitric acid). The
formation and effects of acid rain are discussed
on p. 12 in the photocopied Class Notes.
Acid rain is often a problem in regions that are 100s even
1000s of miles from the source of the sulfur dioxide.
Acid rain in Canada could come from sources in the US, acid
rain in Scandinavia came from industrialized areas in other
parts of Europe.
Note at the bottom of the figure above that natural "pristine"
rain has a pH less than 7 and is slightly acidic. This
is because the rain contains dissolved carbon dioxide
gas. The acid rain demonstration described below and
done in class should make this point clearer.
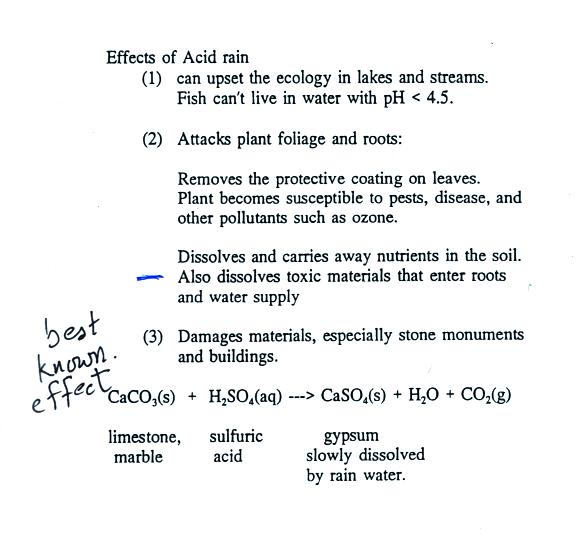
Some of the problems associated with acid rain are listed
above.
Click on this acid
rain demonstration link for a detailed
description of the demonstration done in class.
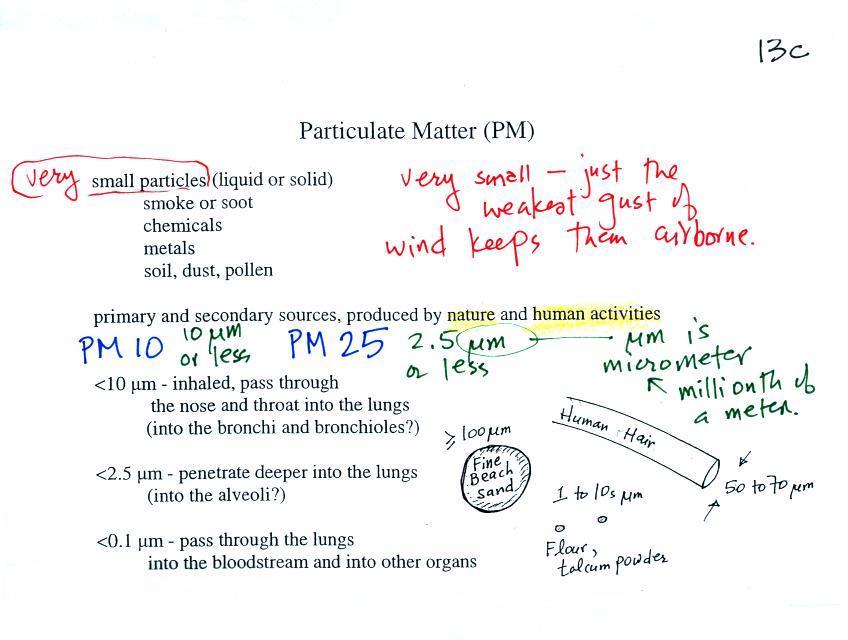
Particulate matter
The last pollutant that we will cover is Particulate Matter
(PM) - small solid particles or drops of liquid (but not gas)
that remain suspended in the air (particulates are sometimes
referred to as aerosols).
The designations PM10 and PM2.5 refer to particles with
diameters less than 10 micrometers and 2.5 micrometers,
respectively. A micrometer (µm) is one millionth
of a meter (10-6
m). You'll find some actual pictures of micrometer
sized objects and more information at this
interesting site. Red blood cells are 6-10 µm
in diameter.
A nanometer (nm) is 1000 times
smaller than a micrometer (10-9
m). An atom is apparently 0.1 to 0.3 nm across,
depending on the particular element.
Particulate matter can be
produced naturally (wind blown dust, clouds above volcanic
eruptions, smoke from lightning-caused forest and brush
fires). Human activities also produce
particulates. Gases sometimes react in the atmosphere
to make small drops or particles (this is what happened in
the photochemical smog demonstration). Just the
smallest, weakest gust of wind is enough to keep particles
this small suspended in the atmosphere.
One of the main concerns
with particulate pollution is that the small particles might
be a health hazard ( a health advisory is sometimes issued
during windy and dusty conditions in Tucson)
Particles with dimensions of 10 µm
and less can be inhaled into the lungs (larger particles get
caught in the nasal passages). These inhaled particles
may be poisonous, might cause cancer, damage lung tissue, or
aggravate existing respiratory diseases. The smallest
particles can pass through the lungs and get into the blood
stream (just as oxygen does) and damage other organs in the
body.
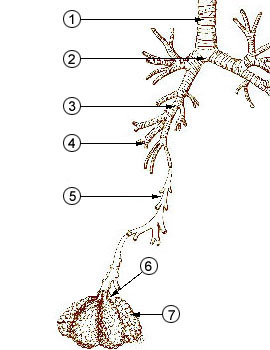
The figure below identifies some of the parts of the
human lung mentioned above.
The figures in this next section
weren't covered in class.
Note the PM10 annual National Ambient Air Quality Standard
(NAAQS) value of 50 micrograms/cubic meter (µg/m3)
at the bottom of p. 13c in the photocopied
ClassNotes.
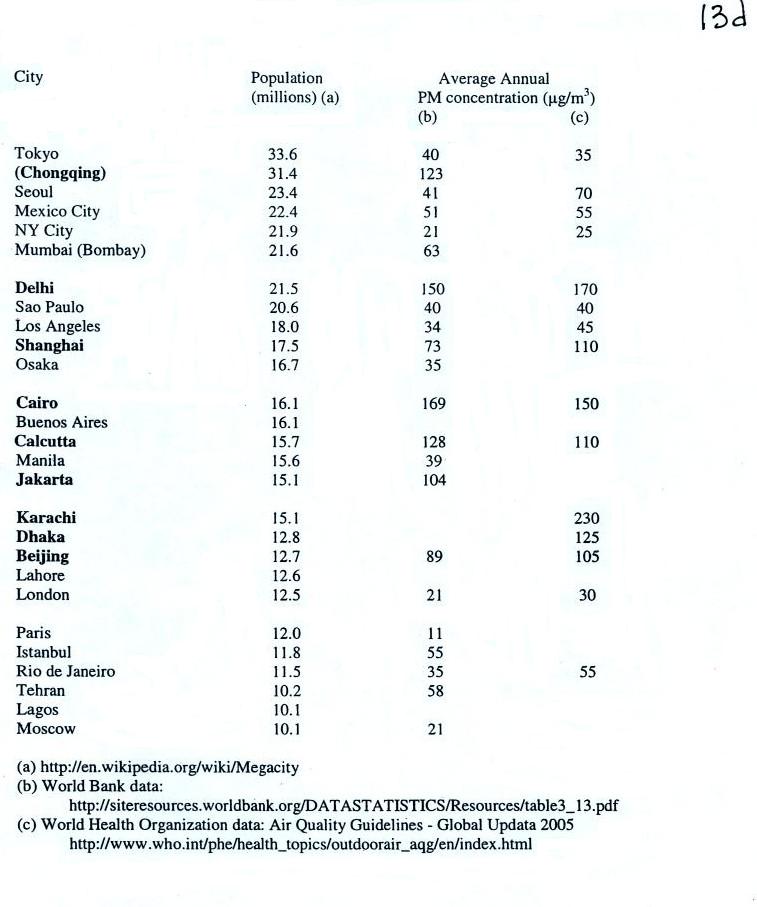
The following list (p. 13d in the ClassNotes) shows that
there are several cities around the world where PM
concentrations are 2 or 3 times higher than the NAAQS value.
The World Health Organization recommends that PM2.5
concentrations be kept below 25 µg/m3.
Particulate concentrations during an air pollution event
in Beijing in 2013 apparently reached several hundred µg/m3
at the US Embassy. Someone mentioned fireworks
in class today. The large fireworks displays
that sometimes occur in Beijing do produce a lot of
particulate pollution (reference).
Fireworks are illegal in Tucson because of the risk of
wildfires.
In 2008 the Summer Olympics were in Beijing and there
was some concern that the polluted air would affect
the athletes performance. Chinese authorities
restricted transportation and industrial activities
before and during the games in an attempt to reduce
pollutant concentrations. Rainy weather during
the games may have done the greatest amount of good.
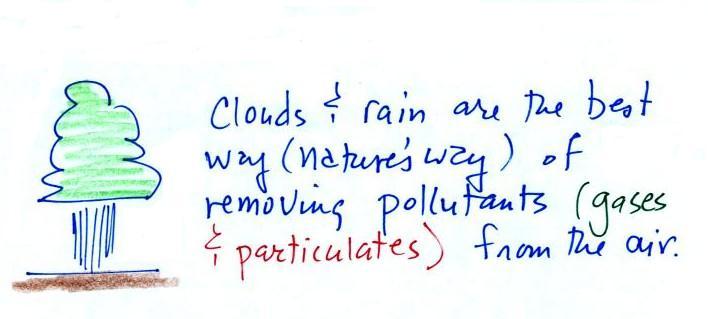
Clouds and precipitation are the best way of cleaning
pollutants from the air. We'll learn later in the
semester that cloud droplets form on small particles in the
air called condensation nuclei. The cloud droplets then
form raindrops and fall to the ground carrying the particles
with them.
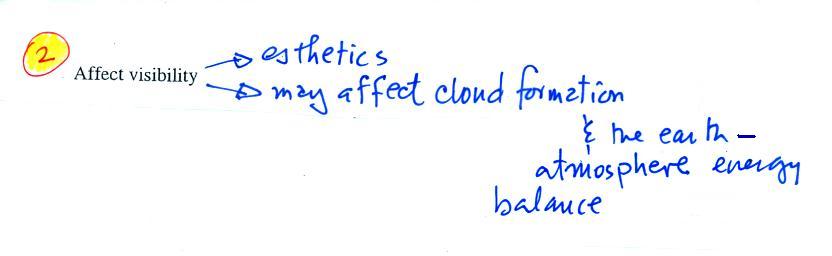
The second main concern with particulates is
the effect they may have on visibility (esthetics below
should actually be spelled aesthetics - i.e. qualities
that might make something appear beautiful or not).
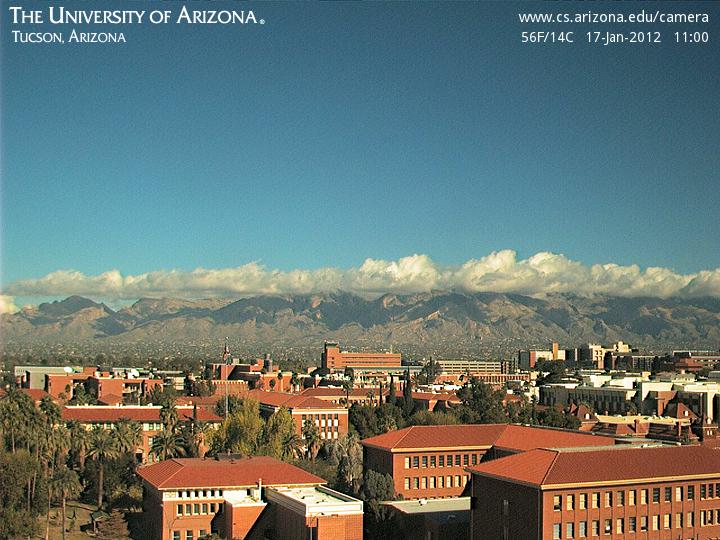
Here's a view of the Catalina mountains taken from the
Gould Simpson Building on the south side of campus.
Some rainy weather had occurred just a day to two earlier,
cleaned the air, and the visibility was very good.
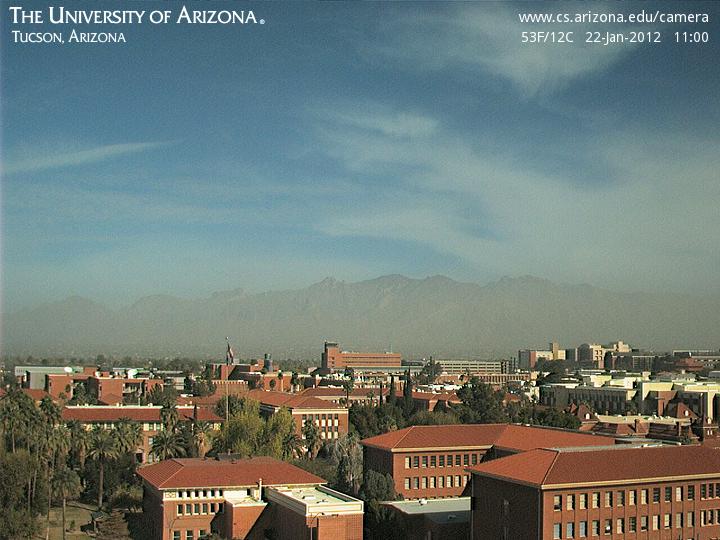
Windy weather a few days
later stirred up a lot of dust that was carried into
town.
This picture was taken the day after the windy
weather. There is still a lot of fine dust particles in
the air and the visibility is pretty bad.
You have probably heard of particularly bad episodes of air
pollution in China. Here are some photographs from Beijing
(January, 2013) and Harbin
(October, 2013). These were extreme cases, the
particulate concentrations were very high, and the visibility,
at times, was probably just a few tens of feet.

