Tuesday, Sep. 16, 2014
September 16 is Mexican
Independence Day (independence from Spain) so a little
Mariachi music from one of my favorite local groups: Calexico and
Mariachi Luz de Luna. And the sound was working today so you
heard: "World
Drifts In" (4:41), "Ballad of
Cable Hogue" (3:26), "Cancion del
Mariachi" (3:28), "Aires del
Mayab" (3:50).
Today was the first of two 1S1P
Assignment #1 due dates and reports were collected in class
today. It usually takes some time to get all these reports
read and graded. We'll get started on them and get them back
to you as soon as we can.
Also the first of this semester's Optional
Assignments is now available. This is the main way you
can earn extra credit in this class. The assignment is due
at the start of class next Tuesday (Sep. 23) and should be
completed before coming to class.
The Practice Quiz has been graded and was returned in class
today. The average score was 64%, a solid D. As you
can see below that is typical for the Practice Quiz.
Semester
|
8 am class
|
9:30 am class
|
2 pm class
|
F14
|
66
|
64
|
----
|
F13
|
63
|
67
|
-
|
F12
|
66
|
|
66
|
F11
|
65
|
|
65
|
F10
|
67
|
|
60
|
F09
|
68
|
|
66
|
F08
|
65
|
|
65
|
Tropical storm Odile
A few quick comments concerning Tropical Storm Odile which is
beginning to affect the weather in Tucson. The light
rain showers we were experiencing this morning came from the
outer rain bands from the storm.
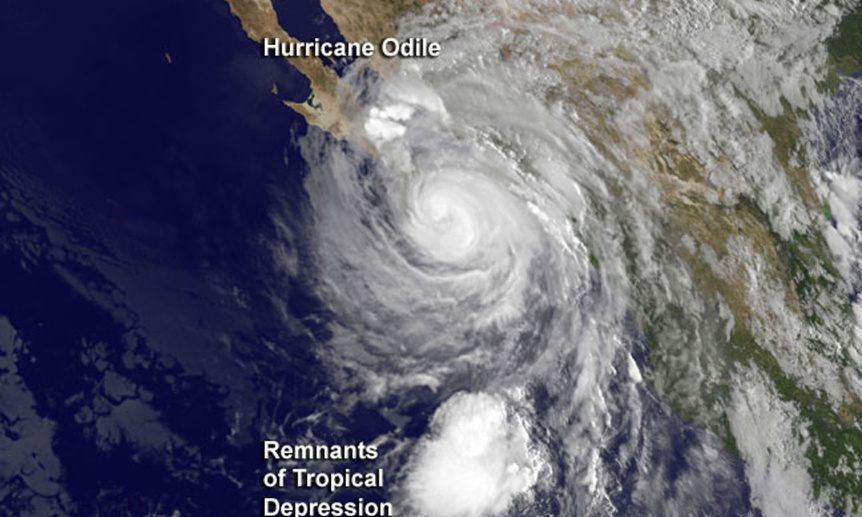
This photograph of Hurricane Odile was taken after it had made
landfall (source
of this is photo taken with the NOAA GOES West satellite that was
taken at 9:45 am EDT on Monday Sep. 15). The hurricane had
weakened and the eye is no longer apparent.
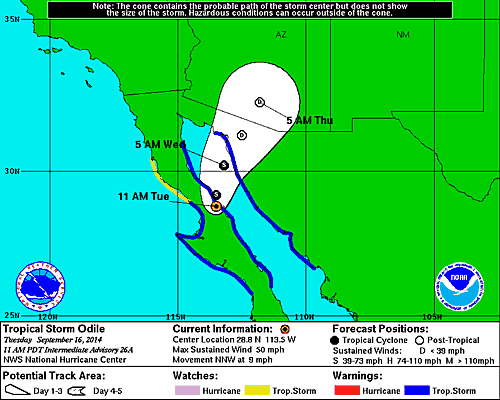
The figure above shows the predicted path of Odile (now a tropical
storm). This was issued by the National Hurricane Center
earlier this morning. Note the remnants of the storm will
pass very close to Tucson. A flash flood watch has been
issued for portions of much of Arizona as well as portions of New
Mexico, Nevada, and California. The actual path followed by
the storm and its moisture may depart significantly from what is
being forecast now, but it looks like we may be in for a rainy
next couple of days. It is not clear how much rain we will
get. Yesterday some of the computer models were predicting 3
to 4 inches of rain, today's model runs show somewhat less,
perhaps 1 to 2 inches. These amounts of rain can cause
serious flooding.
You can keep track of the latest forecasts at the Tucson office of the
National Weather Service.
Hurricane Odile seems to have caused serious damage in Baja
California. Here are reports from
the BBC, another
from USA Today, and a third from The
Weather Channel.
We've spent a lot of time (too much?) looking at air pressure and
how it changes with altitude. Today we'll consider air
density and air temperature.
1. Air density changes with altitude
How does air density change with increasing altitude? You
should know the answer to that question. You get
out of breath more easily at high altitude than at sea
level. Air gets thinner (less dense) at higher
altitude. A lungful of air at high altitude just doesn't
contain as many oxygen molecules as it does at lower altitude or
at sea level.
It would be nice to understand why air density decreases with
increasing altitude.
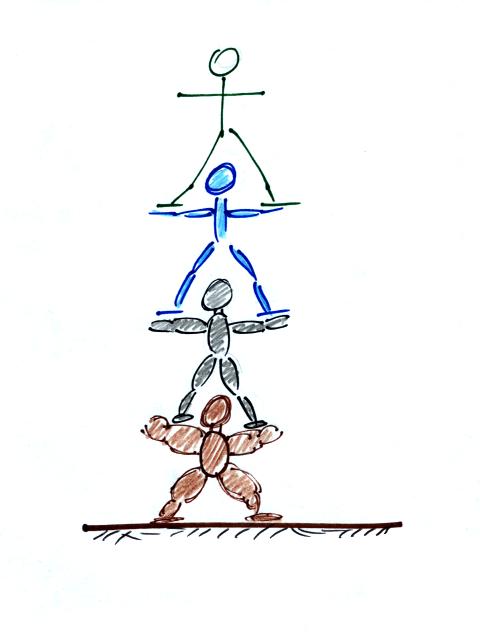
The people pyramid reminds you that there is more
weight, more pressure, at the bottom of the atmosphere than there
is higher up.
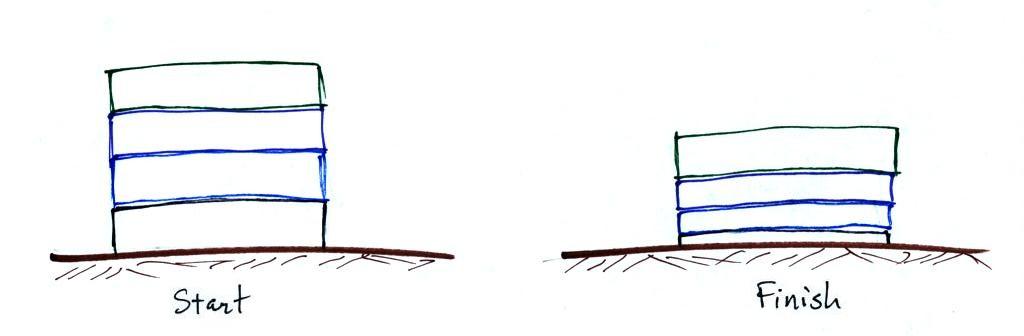
Layers of air are not solid and rigid like in a stack of
bricks. Layers of air are more like mattresses stacked on
top of each other. Mattresses are compressible,
bricks (and people) aren't. Mattresses are also reasonably
heavy, the mattress at the bottom of the pile would be squished by
the weight of the three mattresses above. This is shown at
right. The mattresses higher up aren't compressed as much
because there is less weight remaining above. The same is
true with layers of air in the atmosphere.
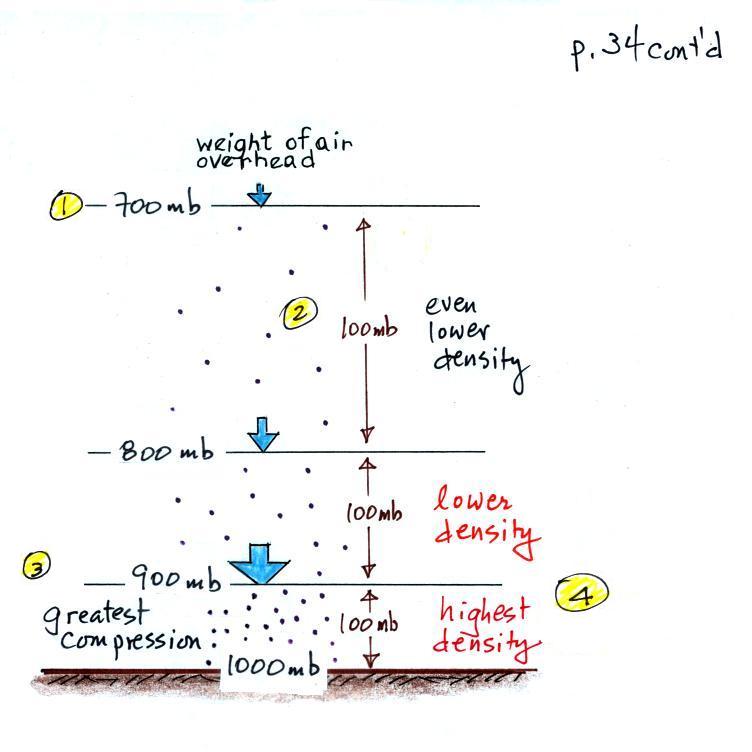
The statement above is at the top of p. 34 in the photocopied
ClassNotes. I've redrawn the figure found at the bottom of
p. 34 below.
There's a surprising amount of information in this figure and it
is worth spending a minute or two looking for it and thinking
about it.
1. You can first notice and remember that pressure decreases
with increasing altitude. 1000 mb at the bottom decreases to
700 mb at the top of the picture. You should be able to
explain why this happens.
2. Each layer of air contains the same amount (mass) of
air. This is a fairly subtle point. You can tell
because the pressure drops by 100 mb as you move upward through
each layer. Pressure depends on weight. So if all the
pressure changes are equal, the weights of each of the layers must
be the same. Each of the layers must contain the same amount
(mass) of air (each layer contains 10% of the air in the
atmosphere).
3. The densest air is found at the bottom of the picture.
The bottom layer is compressed the most because it is supporting
the weight of all of the rest of the atmosphere. It is the
thinnest layer in the picture and the layer with the smallest
volume. Since each layer has the same amount of air (same
mass) and the bottom layer has the smallest volume it must have
the highest density. The top layer has the same amount of
air but about twice the volume. It therefore has a lower
density (half the density of the air at sea level). Density
is decreasing with increasing altitude. That's the
main point in this figure.
4. Finally pressure is decreasing most rapidly with
increasing altitude in the densest air in the bottom layer.
This is something we covered a week or two ago and something we'll
use again 2 or 3 times later in the semester.
2. Principle of the mercury
barometer
One of the more impressive seesaws (teeter totters) that I've
seen (source
of this image). If you understand how this works
you'll be able to figure out how barometers function.
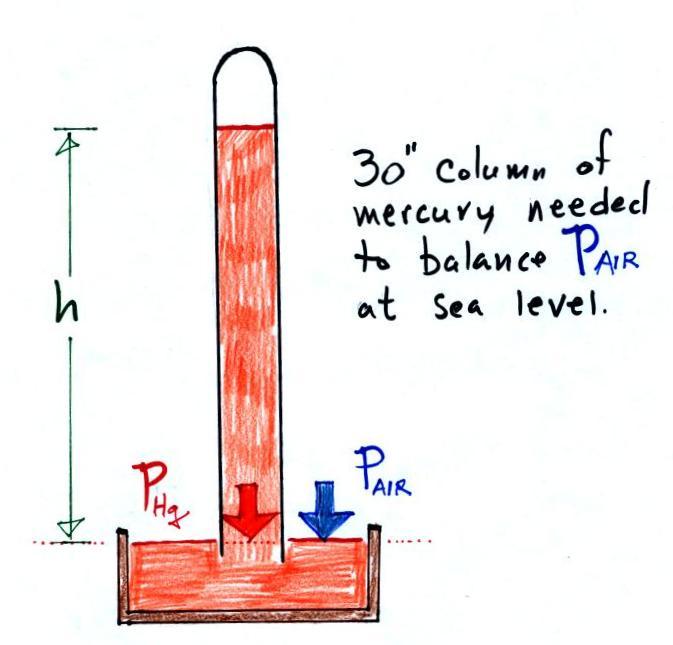
A mercury barometer is used to measure atmospheric
pressure and is really just a balance that can be used to weigh
the atmosphere.
 |
|
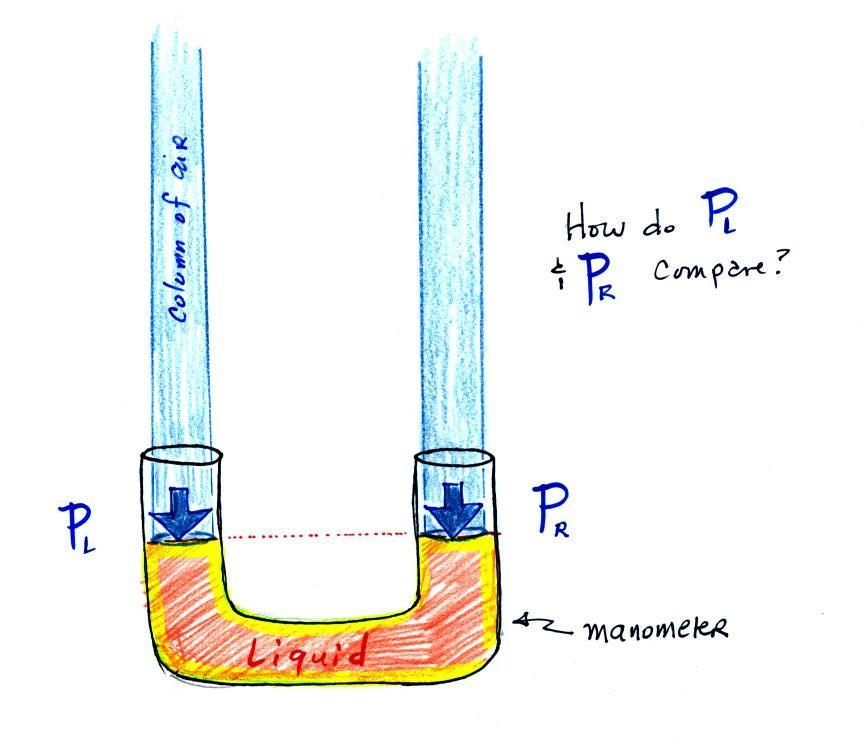
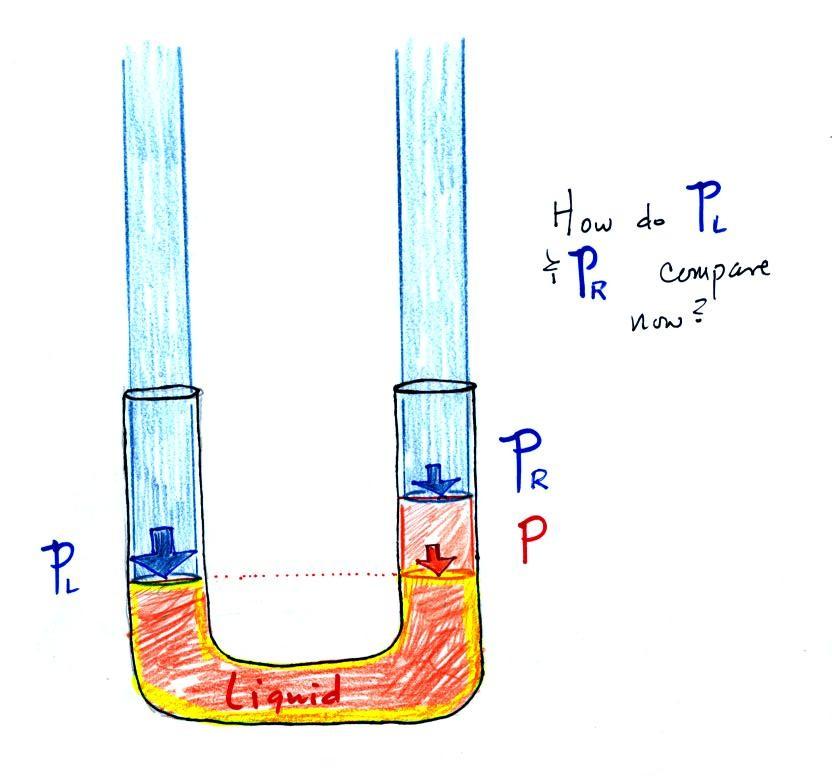
The instrument in the left
figure above ( a u-shaped glass tube filled with a liquid of
some kind) is actually called a manometer and can be used to
measure pressure difference.
The two ends of the tube are open so that air can get inside and
air pressure can press on the liquid. Given that the
liquid levels on the two sides of the manometer are equal,
what could you say about PL
and PR?
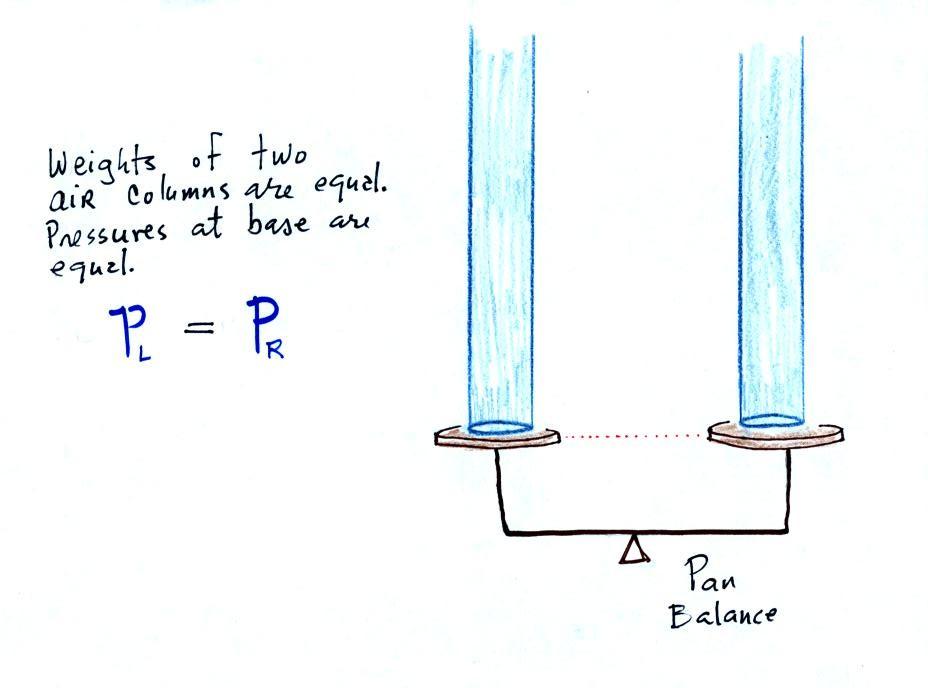
The liquid can slosh back and forth just like
the pans on a balance can move up and down. A manometer
really behaves just like a pan balance (pictured above at right)
or a teeter totter (seesaw).
Because the two pans are in balance, the two columns of air have
the same weight. PL and PR are equal (but note that
you don't really know what either pressure is, just that they
are equal).
 |
|
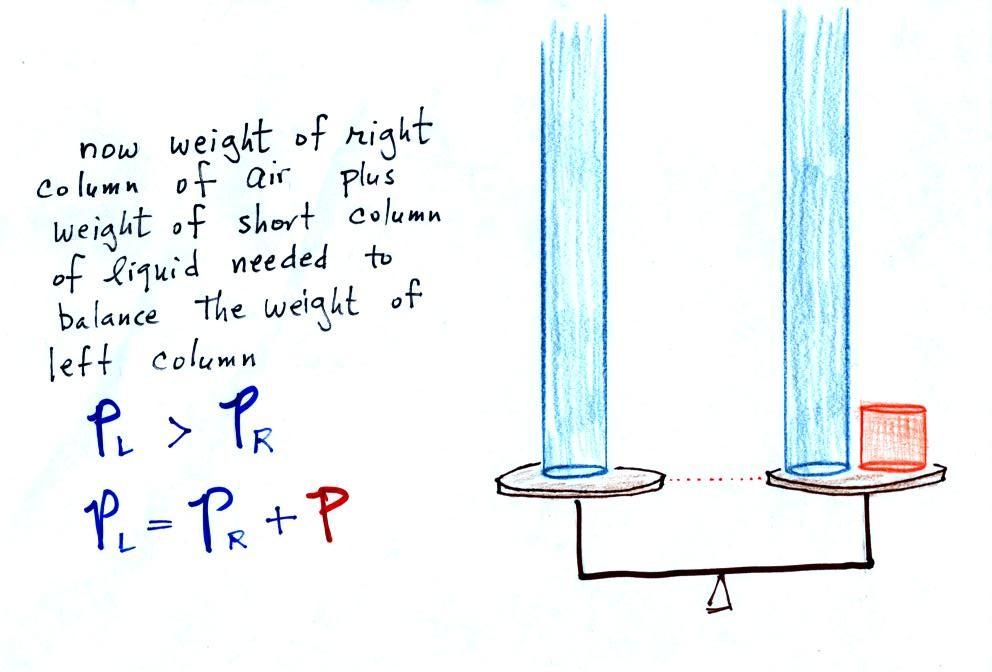
Now the situation is a little
different, the liquid levels are no longer equal. You
probably realize that the air pressure on the left, PL, is a little higher than
the air pressure on the right, PR.
PL is now being balanced
by PR + P acting together. P is the pressure produced by the
weight of the extra fluid on the right hand side of the
manometer (the fluid that lies above the dotted line). The
height of the column of extra liquid provides a measure of the
difference between PL and
PR.
Next we will just go and close off the right hand side of the
manometer.
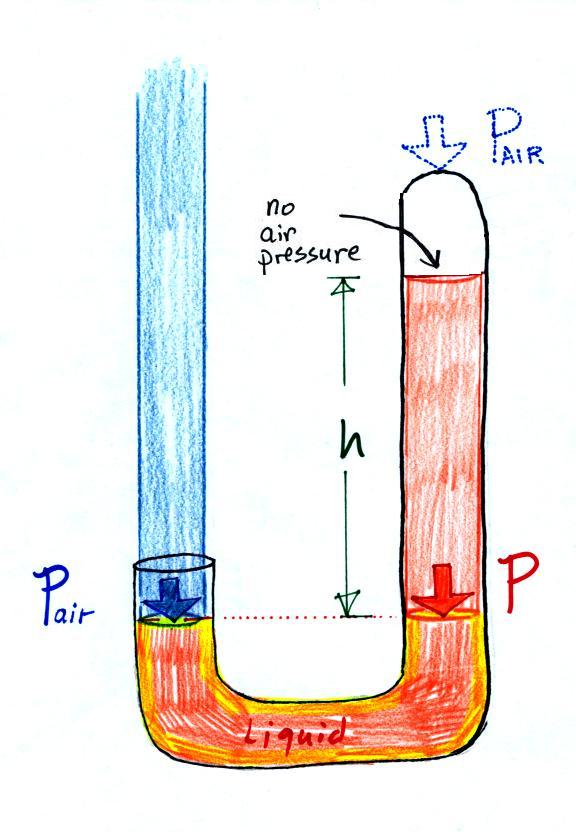
|
|
Air pressure can't get into
the right tube any more. Now at the level of the dotted
line the balance is between Pair
and P (pressure by the
extra liquid on the right). If Pair changes, the height of
the right column, h, will change. You now have a
barometer, an instrument that can measure and monitor the
atmospheric pressure.
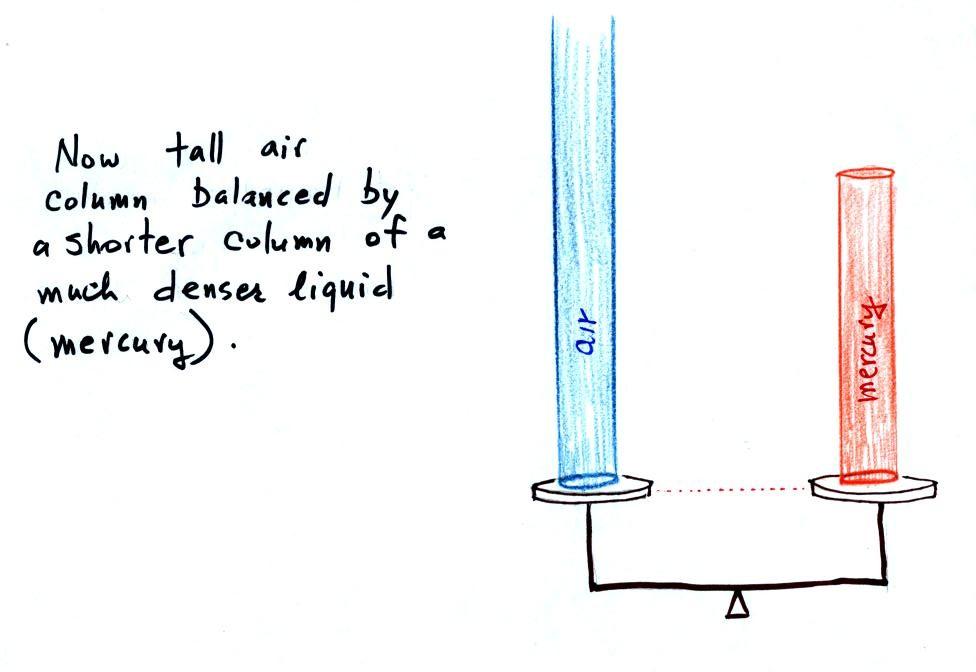
Barometers like this are usually filled with mercury.
Mercury is a liquid. You need a liquid that can slosh
back and forth in response to changes in air pressure.
Mercury is also very dense which means the barometer won't
need to be as tall as if you used something like water.
A water barometer would need to be over 30 feet tall.
With mercury you will need only a 30 inch tall column
to balance the weight of the atmosphere at sea level under
normal conditions (remember the 30 inches of mercury pressure
units mentioned earlier). Mercury also has a low rate of
evaporation so you don't have much mercury gas at the top of
the right tube (there's some gas, it doesn't produce much
pressure, but it would be hazardous you if you were to start
to breath it).
Here is a more conventional barometer design.
The bowl of mercury is usually covered in such a way that it
can sense changes in pressure but is sealed to keep poisonous
mercury vapor from filling a room.
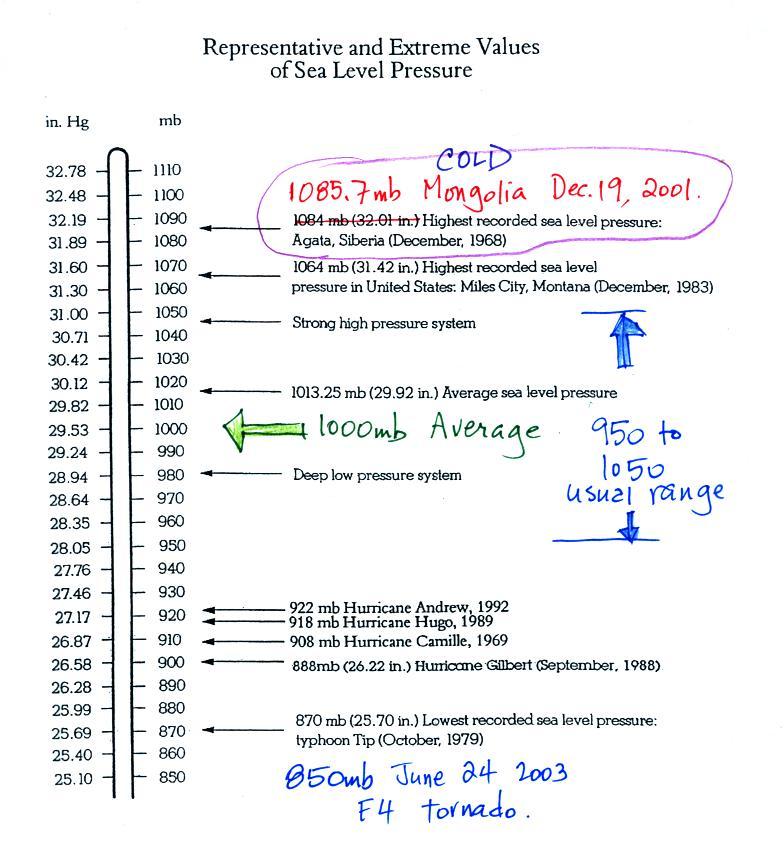
Average and extreme sea level pressure values
Average sea level atmospheric pressure is about 1000 mb. The
figure above (p. 30 in the photocopied Class Notes) gives 1013.25
mb but 1000 mb is close enough in this class. The actual
pressure can be higher or lower than this average value and
usually falls between 950 mb and 1050 mb.
The figure also includes record high and low pressure
values. Record high sea level pressure values
occur during cold weather. The TV weather
forecast will often associate hot weather with high
pressure. They are generally referring to upper level high
pressure (high pressure at some level above the ground) rather
than surface pressure. The
1085 mb pressure value measured in Mongolia wasn't shown in
class because there is some concern about its
accuracy. The problem is that the pressure was measured at
over 5000 feet altitude and a calculation was needed to figure out
what the pressure would have been if the location were at sea
level. That calculation can introduce uncertainty. But
you don't really need to be concerned with all that, I just wanted
to give you an idea of how high sea level pressure can get.
Most of the record low pressure values have all been set by
intense hurricanes. Hurricane Wilma in 2005 set a new
record low sea level pressure reading for the Atlantic, 882
mb. Hurricane Katrina had a pressure of 902 mb. The
following table lists some of the information on hurricane
strength from p. 146a in the photocopied ClassNotes. 2005
was a very unusual year, 3 of the 10 strongest N. Atlantic
hurricanes ever occurred in 2005.
Most
Intense North Atlantic Hurricanes
|
Most
Intense Hurricanes
to hit the US Mainland
|
Wilma
(2005) 882 mb
Gilbert (1988) 888 mb
1935 Labor Day 892 mb
Rita (2005) 895 mb
Allen (1980) 899
Katrina (2005) 902
|
1935
Labor Day 892 mb
Camille (1969) 909 mb
Katrina (2005) 920 mb
Andrew (1992) 922 mb
1886 Indianola (Tx) 925 mb |
The 850 mb sea level pressure wasn't
shown in class either. It was measured in
2003 inside a strong tornado in Manchester, South Dakota (F4
refers to the Fujita scale rating, F5 is the highest level on the
scale). This is very difficult (and very dangerous) thing to
try to do. Not only must the instruments be built to survive
a tornado but they must also be placed on the ground ahead of an
approaching tornado and the tornado must then pass over the
instruments (also the person placing the instrument needs to get
out of the way of the approaching tornado).
You can experience much lower pressure values than shown above
(roughly 700 mb) by just driving up to Mt. Lemmon. What
makes hurricanes so intense is the pressure gradient, i.e. how
quickly pressure changes with distance (horizontal
distance). Pressure can drop from near average values (1000
mb) at the edges of the storm to the low values shown above at the
center of the storm. This large pressure gradient is what
causes the strong winds found in a hurricane.
Here is the announcement from the National Hurricane Center when
Hurricane Odile had made landfall Sunday evening.
HURRICANE ODILE TROPICAL CYCLONE UPDATE
NWS NATIONAL HURRICANE CENTER MIAMI FL       EP152014
1000 PM PDT SUN SEP 14 2014

...ODILE MAKES LANDFALL NEAR CABO SAN LUCAS...

SATELLITE IMAGERY INDICATES THAT THE CENTER OF ODILE MADE LANDFALL
AT ABOUT 945 PM PDT...0445 UTC...NEAR CABO SAN LUCAS MEXICO. THE
ESTIMATED INTENSITY OF ODILE AT LANDFALL WAS 125 MPH...205 KM/H...
CATEGORY THREE ON THE SAFFIR-SIMPSON HURRICANE WIND SCALE.

AN AUTOMATED OBSERVING STATION NEAR CABO SAN LUCAS RECENTLY
REPORTED A SUSTAINED WIND OF 89 MPH...144 KM/H...WITH A GUST TO 116
MPH...187 KM/H.  THE STATION HAS ALSO REPORTED A MINIMUM PRESSURE OF
959 MB... 28.32 INCHES.

A WEATHER STATION NEAR SANTA ROSA MEXICO HAS RECENTLY REPORTED A
WIND GUST TO 87 MPH...140 KM/H.
earlier in the day on Sunday the center pressure in Odile had
dropped to as low as 922 mb and the sustained winds were 125 MPH.
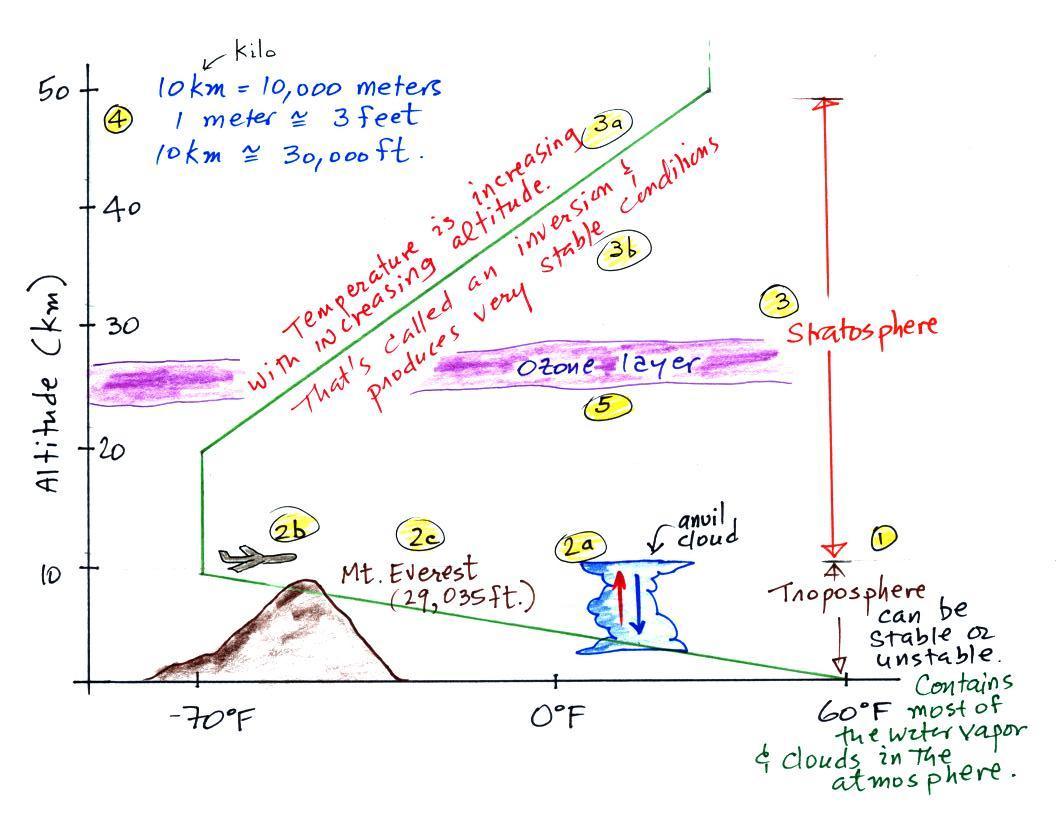
3. Air temperature changes with altitude, troposphere
& stratosphere
What happens to air temperature with increasing altitude.
Again our personal experience is that it decreases with increasing
altitude. It is colder at the top of Mt. Lemmon than it is
here in the Tucson valley.
That is true up to an altitude of about 10 km (about
30,000 ft.). People were very surprised in the early 1900s
when they used balloons to carry instruments above 10 km and found
that temperature stopped decreased and even began to increase with
increasing altitude.
Measurements of air temperature at high altitude in
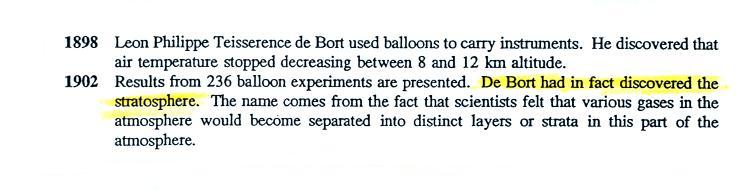
unmanned balloons lead to the discovery of the stratosphere in
about 1900 (the information above is on p. 31 in the ClassNotes).
The figures below are more clearly drawn versions of what was
done in class.
The atmosphere can be split into layers depending on whether
temperature is increasing or decreasing with increasing
altitude. The two lowest layers are shown in the figure
above. There are additional layers (the mesosphere and the
thermosphere) above 50 km but we won't worry about them in this
class.
1. We live in the troposphere. The troposphere is
found, on average, between 0 and about 10 km altitude, and is
where temperature usually decreases with increasing
altitude. [the troposphere is usually a little higher in the
tropics and lower at polar latitudes]
The troposphere can be stable or unstable (tropo means "to turn
over" and refers to the fact that air can move up and down in the
troposphere). The troposphere contains most of the water
vapor in the atmosphere (the water vapor comes from evaporation of
ocean water and then gets mixed throughout the troposphere by up
and down air motions) and is where most of the clouds and weather
occurs.
2a. The thunderstorm shown in the figure with its
strong updrafts and downdrafts indicates unstable
conditions. When the thunderstorm reaches the top of the
troposphere, it runs into the bottom of the stratosphere which is
a very stable layer. The air can't continue to rise into the
stratosphere so the cloud flattens out and forms an anvil (anvil
is the name given to the flat top of the
thunderstorm). The flat anvil top is something that
you can go outside and see and often marks the top of the
troposphere.
Here are several images of
thunderstorms and anvil clouds taken from above, from the
International Space Station (all
3 images courtesy of the Image Science and Analysis
Laboratory, NASA Johnson Space Flight Center,
www.eol.jsc.nasa.gov).
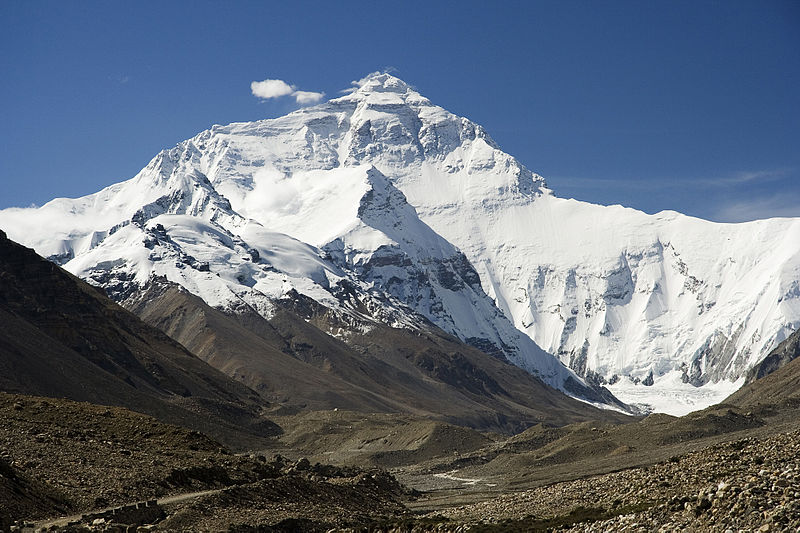
This photo of Mt. Everest was selected as
the Picture of the Day on Wikipedia for Dec. 22, 2007.
Photo credit: Luca Galluzi www.galluzi.it
2b. The summit of Mt. Everest is
a little over 29,000 ft. tall and is close to the average
height of the top of the troposphere.
2c. Cruising altitude in a passenger jet is
usually between 30,000 and 40,000, near or just above the
top of the troposphere, and at the bottom of the
stratosphere. The next time you're in an airplane
try to look up at the sky above. There's less air
and less scattering of light. As a result the sky is
a darker purple color not blue. If you get high
enough the sky would eventually become black.
3. Temperature remains constant between 10 and 20 km
and then increases with increasing altitude between 20 and
50 km. These two sections form the
stratosphere. The stratosphere is a very stable air
layer. Increasing temperature with increasing
altitude is called an inversion. This is what makes
the stratosphere so stable.
4. A
kilometer is one thousand meters. Since 1 meter is
about 3
feet, 10 km is about 30,000 feet. There are
5280 feet in a mile so this is about 6
miles (about is usually close enough in this
class).
5. The ozone layer is found in
the stratosphere. Peak ozone concentrations occur
near 25 km altitude.
Here's
the same picture drawn again (for clarity) with some
additional information. We need to explain why
when temperature decreases all the way up to the top
of the troposphere, it can start increasing again in
the stratosphere.
6. Sunlight is a mixture of ultraviolet (7%), visible
(44%, colored green in the picture above) and infrared light (49%,
colored red). We can see the visible light.
6a. On average about 50% of the sunlight
arriving at the top of the atmosphere passes through the
atmosphere and is absorbed at the ground (20% is absorbed by gases
in the air, 30% is reflected back into space). This warms
the ground. The air in contact with the ground is warmer
than air just above. As you get further and further from the
warm ground,
the air is colder and colder. This explains why air
temperature decreases with increasing altitude in the troposphere.
5b. How do you explain increasing temperature with
increasing altitude in the stratosphere?
Absorption of ultraviolet light by ozone
warms the air in the stratosphere and explains why the air can
warm (oxygen also absorbs UV light). The air in the
stratosphere is much less dense (thinner) than in the
troposphere. So even though there is not very much UV light
in sunlight, it doesn't take as much energy to warm this thin air
as it would to warm denser air closer to the ground.
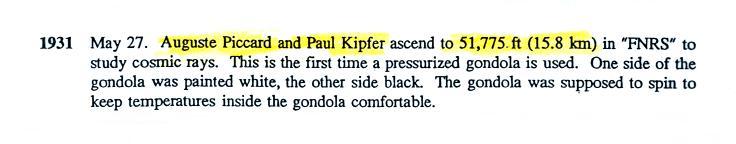
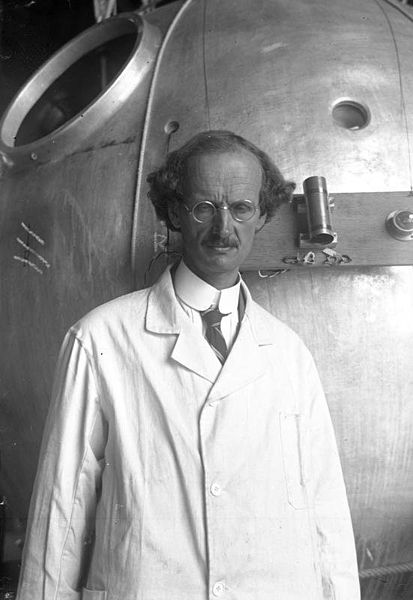
7. That's a manned balloon;
Auguste Piccard and Paul Kipfer are inside. They were the
first men to travel into the stratosphere (see pps 31 & 32 in
the photocopied Class Notes). It really was quite a daring
trip at the time, and they very nearly
didn't survive it.
4. The great age of
stratospheric exploration
Pages 31 and 32 in the ClassNotes list some of
the significant events in the early study and exploration
of the atmosphere. A few of them are included below.
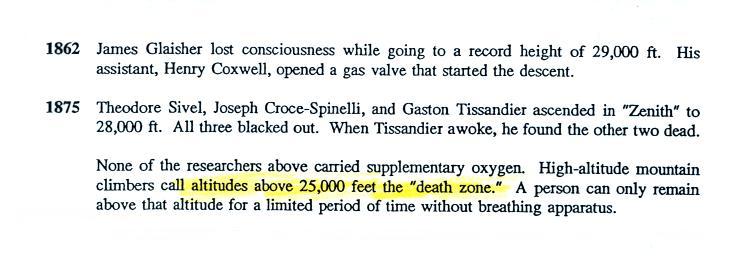
Note the mercury barometer was invented in 1643.
The earliest balloon trips into the upper
atmosphere were in unheated and unpressurized gondolas.
Climbers have made it to the summit of Mt. Everest without
carrying supplementary oxygen but it is difficult and requires
acclimation. You can't acclimate to conditions above
25,000 ft and can't remain up there very long - it's referred
to as the "death zone." (Read "Into Thin
Air" by Jon Krakauer if you'd like to get some idea of
what it's like trying to climb Mt. Everest)
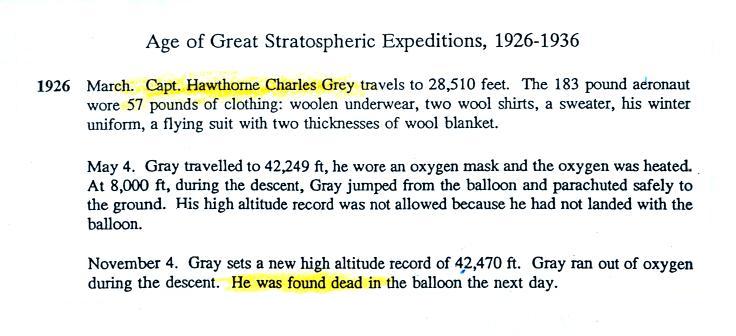
Note the clothing that Capt. Grey had to
wear to try to stay warm. All of his trips were in an
open, unpressurized gondola.
Source
of the image below
|
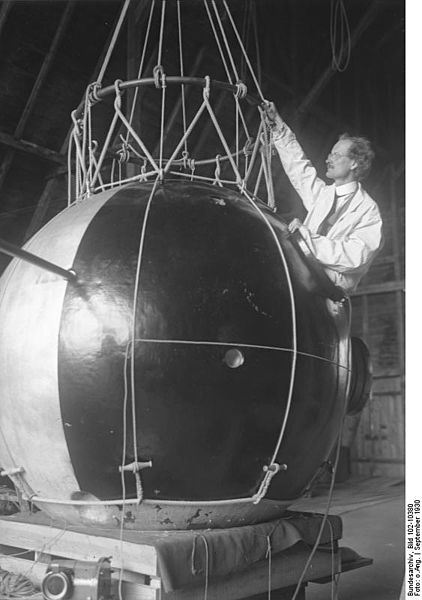
I believe this is the gondola flown into the
stratosphere by Auguste Piccard and Paul Kipfer is shown
above (source).
The figure caption is in German so I am not sure that is
the case.
|
Auguste
Piccard is shown in the figure at left. The
gondola he took into the stratosphere is shown at
right. Note how one side is black and the other
white. By turning the gondola they could control the
temperature inside (pointing the black side toward the sun
would warm the gondola, turning the white side would allow
the gondola to cool off).
We watched about 10 minutes of video describing
Piccard's first trip into the stratosphere (they very
nearly didn't make it back down alive).
You
might have heard about Felix
Baumgartner and the Red Bull Stratos balloon (or
seen the GoPro commercial during a recent Super
Bowl). On Oct. 14, 2012 he reached an altitude of
nearly 128,000 feet (39 km or 24 miles) and then
jumped. He reached a speed of 843 MPH on the way
down (Mach 1.25 or 1.25 times the speed of sound).
Here's a short
video (1:25) that''s the one I showed in class. It
shows portions of his jump. If you have time you should
really watch the longer
version (9:32). Baumgartner began to
spin during the descent but was able get out of it. He
came very close to blacking out.
That
was about all the time we had today. I
have a couple more videos that I would like to show at
some point.
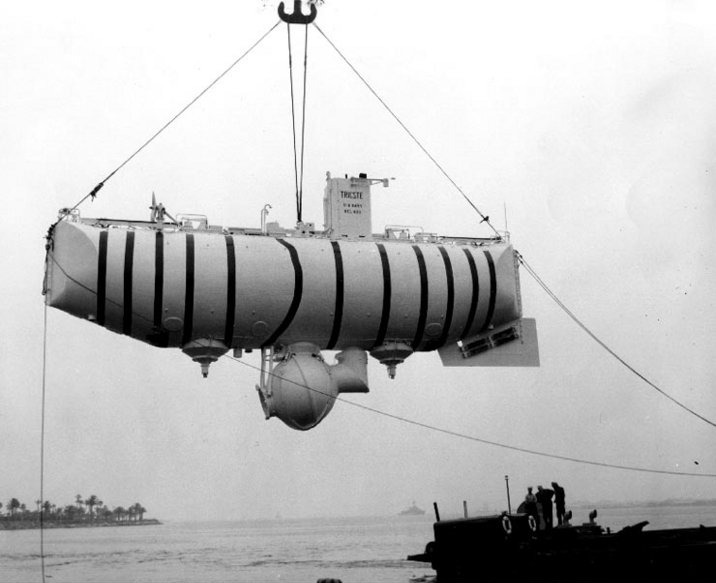
Jacques
Piccard, Auguste's son,
would later travel with Lt. Don
Walsh of the US Navy to a depth of
about 35,800 feet in the ocean in
the Mariana Trench (Auguste
participated in some of the test
descents to 10,000 ft). They
did that in the Bathyscaph Trieste
(shown below) on Jan. 23, 1960
(source
of the image).
I'll try to show a short video of one of their test dives
(to 10,000 ft.)
Here's a National
Geographic video describing film director James
Cameron's much more recent dive to the Challenger Deep
in the Mariana Trench on Mar. 12, 2012 (2:16).
(note mention of the 16,000 psi
pressure on the submersible at the bottom of the ocean)
Bertrand
Piccard, Jacques' son (Auguste's grandson) was
part of the first two man team to circle the globe
non-stop in the Breitling Orbiter 3 balloon (Mar. 20,
1999). Brian Jones was the second team member
(source
of the left image above,
source
of the right image
). I've
got a pretty good video summary of their trip. Here
are three online videos of the event: short
summary (1:40),
longer
summary (6:15 with music only, no commentary)


