Thursday Oct. 22, 2015
Rodrigo y Gabriela "The
Soundmaker", Tesoro "Malaguena",
Beth Daunis & Domingo DeGrazia "I'm not sure
what the title is". The latter two groups are local
groups.
The Experiment #2 reports were returned in class today. You
are allowed to revise those reports if you want to, it's not
required. The due date for revised reports is Thu., Nov.
5. You only need to rework sections where you want to earn
additional credit but please return the original report with your
revised report.
"Midterm" grade summaries were also distributed today. More
about them at the end of today's notes.
My goal now is to have the Causes of the Seasons and the revised
Expt. #1 reports graded by this time next week.
A new Optional
Assignment was handed out in class. The assignment is
due at the start of class next Tuesday (Oct. 27) (you should have
the assignment done before coming to class).
We worked through three humidity variable example problems in
class today. A 4th problem has been inserted into these
online notes. The goal here is for you to become a little
more familiar with the humidity variables and see what causes them
to change value.
Humidity example problem #1
There are 4 humidity variables
(mixing ratio, saturation mixing ratio, relative
humidity, and dew point temperature). Generally
I'll give you values for two of them and you'll need
to figure out values for the other two.
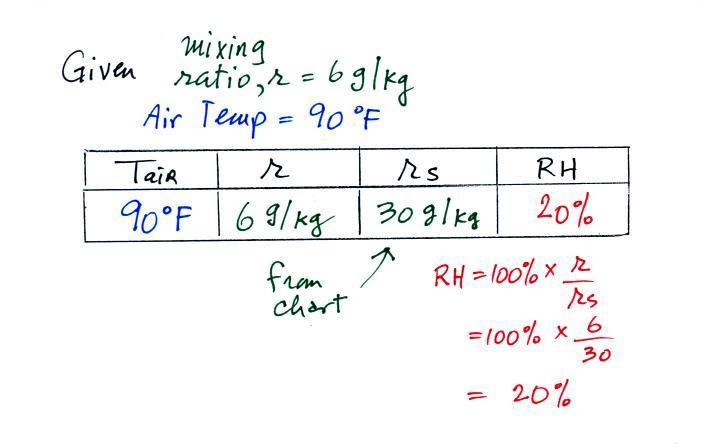
Here are the starting conditions for this first problem
Tair = 90 F
|
r = 6 g/kg
|
RH = ?
|
Td = ?
|
We start by entering the
data we were given
Anytime you know the air's temperature you
can look up the saturation mixing ratio value on a chart (such
as the one on p. 86 in the ClassNotes); the saturation mixing
ratio is 30 g/kg for 90 F air. 90 F air could potentially
hold 30 grams of water vapor per kilogram of dry air (it
actually contains 6 grams per kilogram in this example).
Once you know mixing ratio and saturation mixing ratio you
can calculate the relative humidity (you divide the mixing ratio
by the saturation mixing ratio, 6/30, and multiply the result by
100%). You ought to be able to work out the ratio 6/30 in
your head (6/30 = 1/5 = 0.2). The RH is 20%.
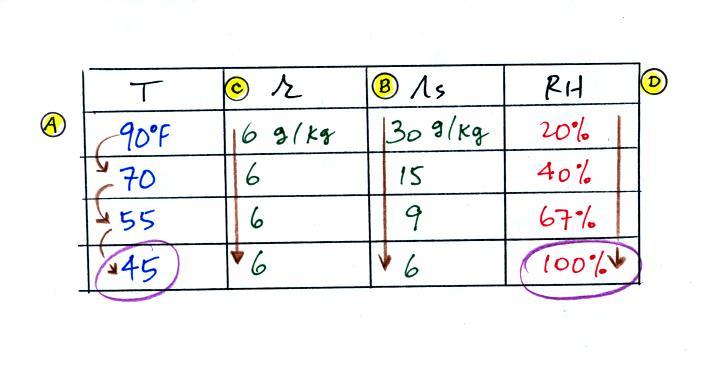
The numbers we just figured out are shown on
the top line above.
(A) We imagined cooling the air from 90F to 70F, then to
55F, and finally to 45F.
(B) At each step we looked up the saturation mixing ratio
and entered it on the chart. Note that the saturation
mixing ratio values decrease
as the air is cooling.
(C) The mixing
ratio (r) doesn't change as we cool the air. The
only thing that changes r is adding or removing water vapor and
we aren't doing either. This is probably the most
difficult concept to grasp.
(D) Note how the relative humidity is increasing as we cool
the air. The air still contains the same amount of water
vapor it is just that the air's capacity is decreasing.
Finally at 45 F the RH becomes 100%. This is the dew
point. The dew point temperature is 45 F
What would happen if we cooled the air further
still, below the dew point temperature?
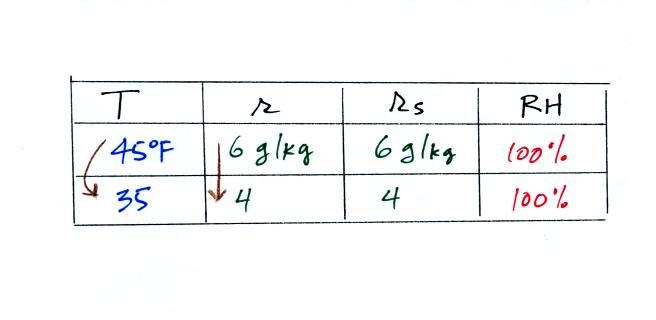
35 F air can't hold the 6 grams of water
vapor that 45 F air can. You can only "fit" 4 grams of
water vapor into the 35 F air. The remaining 2 grams would
condense. If this happened at ground level the ground
would get wet with dew. If it happens above the ground,
the water vapor condenses onto small particles in the air and
forms fog or a cloud. Because water vapor is being taken
out of the air (the water vapor is turning into water), the
mixing ratio will decrease from 6 g/kg to 4 g/kg. As you
cool air below the dew point, the RH stays constant at 100% and
the mixing ratio decreases.
In many ways cooling moist air is liking
squeezing a moist sponge
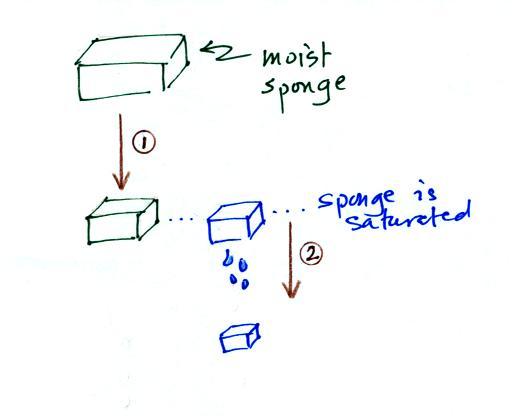
Squeezing the sponge and reducing its volume
is like cooling moist air and reducing the saturation mixing
ratio. At first (Path 1 in the figure) when you squeeze
the sponge nothing happens, no water drips out. Eventually
you get to a point where the sponge is saturated. This is
like reaching the dew point. If you squeeze the sponge any
further (Path 2) water will begin to drip out of the sponge
(water vapor will condense from the air).
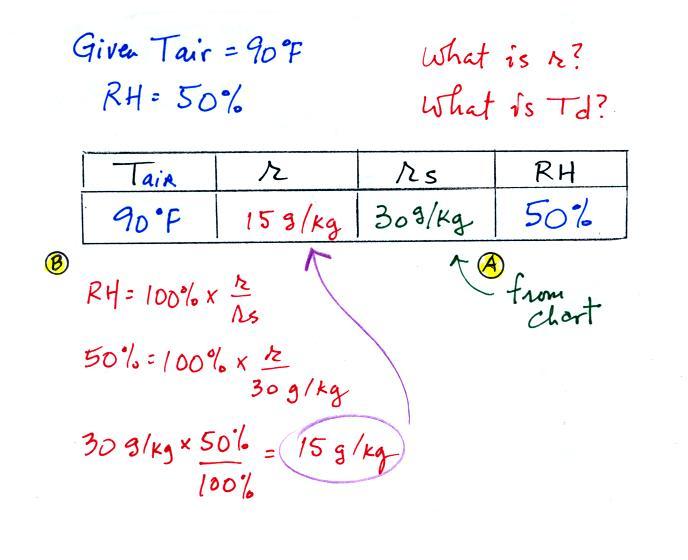
Humidity example problem #2
Tair = 90 F
|
r = ?
|
| RH = 50% |
Td = ?
|
The problem is worked out in detail below
First you fill in the air temperature and the RH data that
you are given.
(A) since you know the air's temperature you can look up the
saturation mixing ratio (30 g/kg).
(B) Then you might be able to figure out the mixing
ratio in your head. Air that could hold up to 30 g/kg of
water vapor is filled to 50% of its capacity. Half of 30
is 15, that is the mixing ratio. Or you can substitute
into the relative humidity formula and solve for the mixing
ratio. The details of that calculation are shown above
at B.
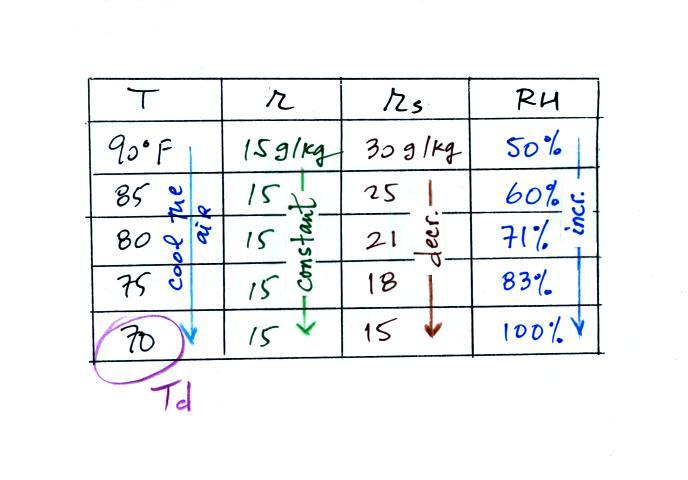
Finally you imagine cooling the air (I
added more intermediate temperatures in the table above
than we did in class). Notice how the
saturation mixing ratio decreases, the mixing ratio stays
constant, and the relative humidity increases as the air is
cooled. In this example the RH reached 100% when
the air had cooled to 70 F. That is the dew point
temperature.
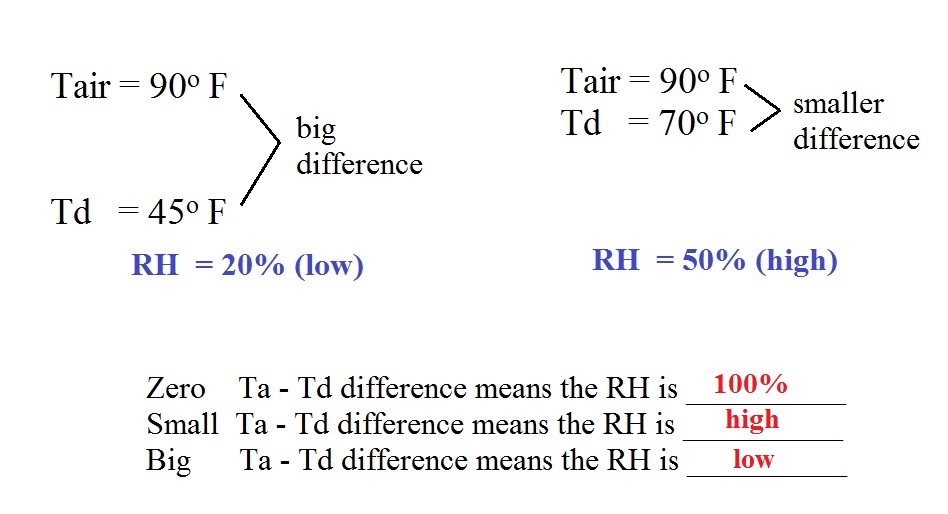
What does
the difference Tair - Td tell you about the
relative humidity?
We
can use results from humidity problems #1 and
#2 to learn and understand a useful
rule.
In the first example the difference between the air and dew
point temperatures was large (45 F) and the RH was low (20%).
In the 2nd problem the difference between the air and dew
point temperatures was smaller (20 F) and the RH was higher
(50%).
The easiest way to remember this rule might be to remember the
case where there is no difference between the air and dew
point temperatures.
The RH then would be 100%.
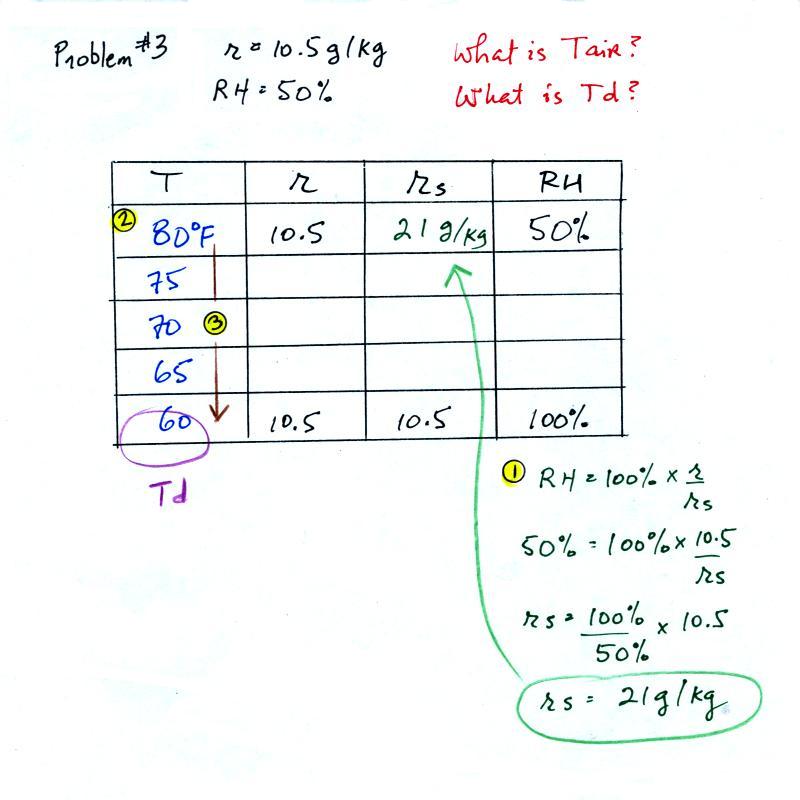
Humidity example problem #3
Tair = ?
|
r = 10.5 g/kg
|
| RH = 50% |
Td = ?
|
We skipped this problem in
class. But I've included all the details
below just in case you want to try to solve the problem on
your own.
You're given the the mixing ratio = 10.5 g/kg and a
relative humidity of 50%. You
need to figure out the air temperature and the dew point
temperature. Here's the play by play solution
to the question:
(1) The air contains 10.5 g/kg of water vapor. This is
50% (half) of what the air could potentially hold. So
the air's capacity, the saturation mixing ratio must be 21
g/kg (you can either do this in your head or use the RH
equation following the steps shown above).
(2) Once you know the saturation mixing ratio you can look up
the air temperature in a table (80 F air has a saturation
mixing ratio of 21 g/kg)
(3) Then you imagine cooling the air until the RH becomes
100%. This occurs at 60 F. The dew point is 60 F
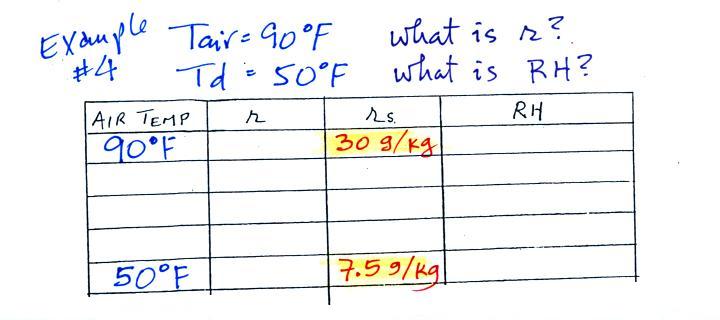
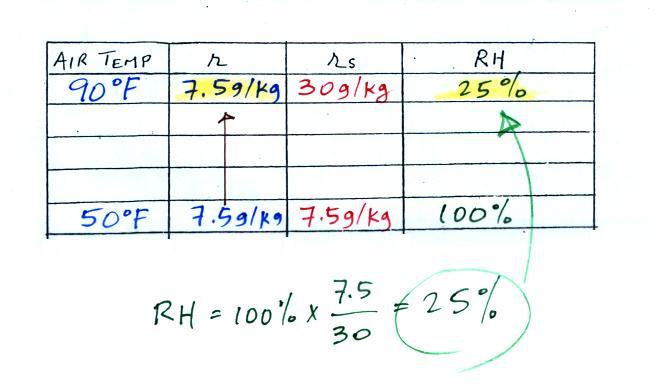
Humidity example problem #4
Tair = 90 F
|
r = ?
|
RH = ?
|
Td = 50 F
|
One of the dew
point's jobs is the same as the mixing ratio - it
gives you an idea of the actual amount of water vapor
in the air. This problem will show that if you
know the dew point, you can quickly figure out the
mixing ratio and vice versa. Knowing the dew
point is equivalent to knowing the mixing ratio.
We enter the two temperatures given on a chart and look up the
saturation mixing ratio for each.
We ignore the fact that we don't know the mixing ratio.
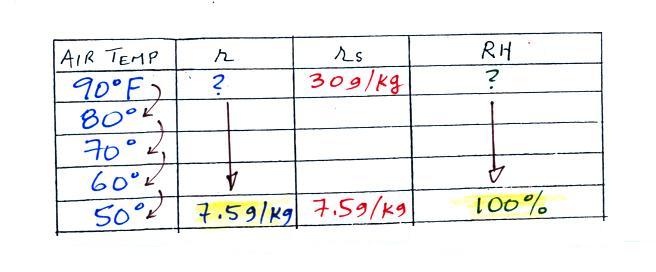
We do know that if we cool the 90 F air to 50 F the RH will
become 100%. So on the 50 F row, we can set the mixing
ratio equal to the value of the saturation mixing ratio at 50
F, 7.5 g/kg. The two have to be equal in order for the
RH to be 100%.
Remember back to the three earlier examples.
When we cooled air to the the dew point, the mixing ratio
didn't change. So the mixing ratio must have been 7.5
all along. Once we know the mixing ratio in the 90
F air it is a simple matter to calculate the relative
humidity, 25%.
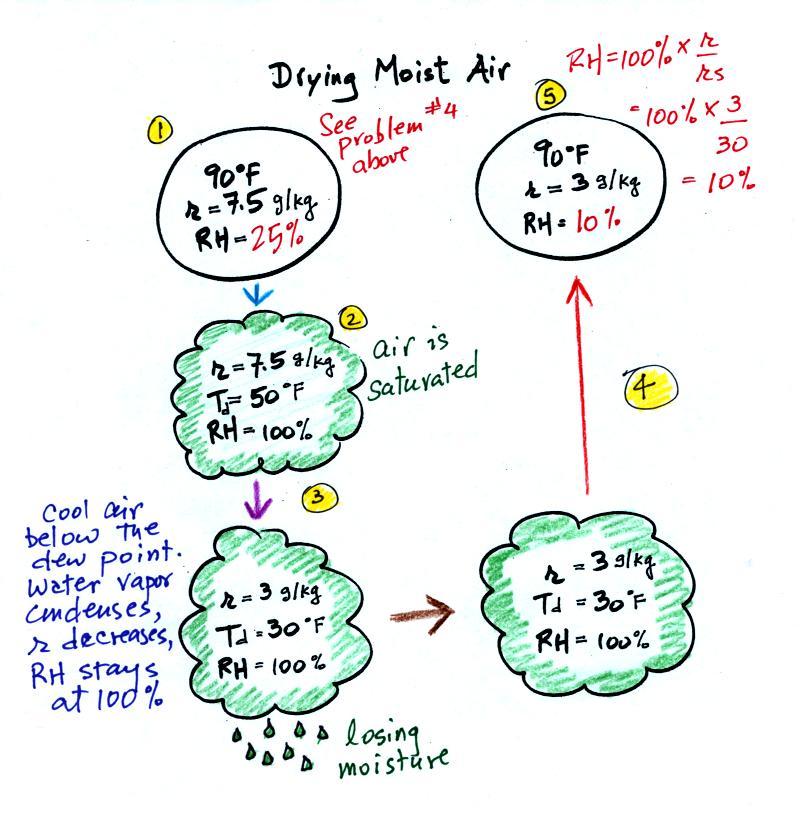
Drying moist air
The figure below is on p. 87 in the photocopied ClassNotes.
It
explains how you can dry moist air.
At Point 1 we start with some 90 F air with a relative
humidity of 25%, fairly dry air. These are the same
numbers that we had in Example Problem #4. We imagine
cooling this air to the dew point temperature, 50 F.
While doing that the mixing ratio, r, would stay
constant. Relative humidity would increase and
eventually reach 100%. A cloud would form (Pt. 2 in the
figure above).
Then we continue to cool the air below the dew point, to 30
F. Air that is cooled below the dew point finds itself
with more water vapor than it can contain. The excess
moisture must condense (we will assume it falls out of the air
as rain or snow). Mixing ratio will decrease, the
relative humidity will remain 100%. When air reaches 30
F it contains 3 g/kg, less than half the moisture that it
originally did (7.5 g/kg).
The air is being warmed back up to 90 F along Path 4. As
it warms the mixing ratio remains constant. Cooling
moist air raises the RH. Warming moist air, as is being
down here, lowers the RH. Once back at the starting
temperature, Point 5, the air now has a RH of only 10%.
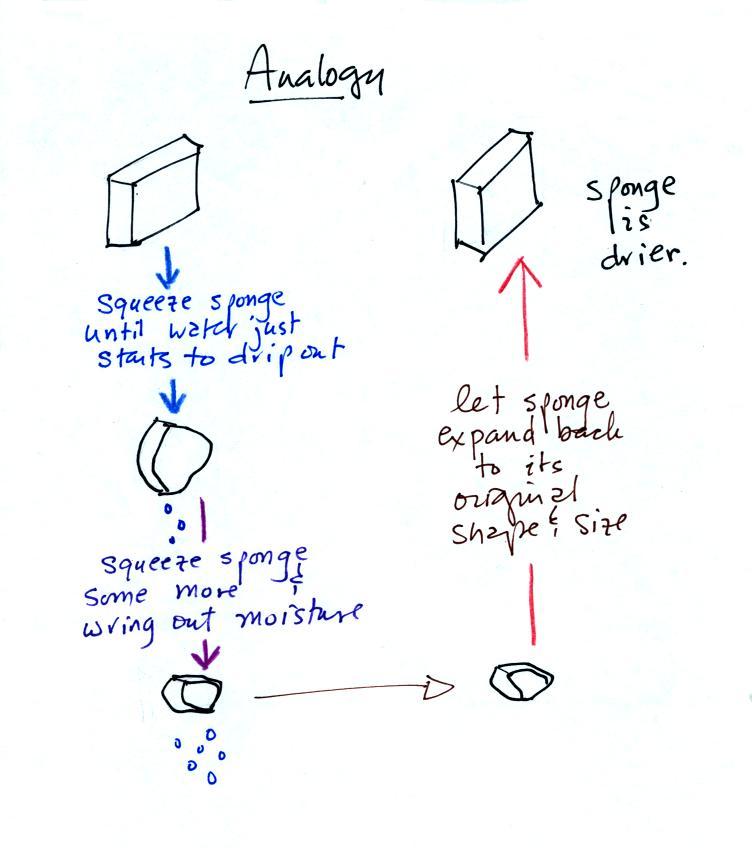
Drying moist air is basically wringing moisture from a wet
sponge.
You start to squeeze the sponge and it gets
smaller. That's like cooling the air and reducing the
saturation mixing ratio, the air's capacity for water
vapor. At first squeezing the sponge doesn't cause
anything to happen (that's like cooling the air, the mixing
ratio stays constant as long as the air doesn't lose any water
vapor). Eventually water will start to drop from the
sponge (with air this is what happens when you reach the dew
point and continue to cool the air below the dew point).
Then you let go of the sponge and let it expand back to its
original shape and size (the air warms back to its original
temperature). The sponge (and the air) will be drier
than when you started.
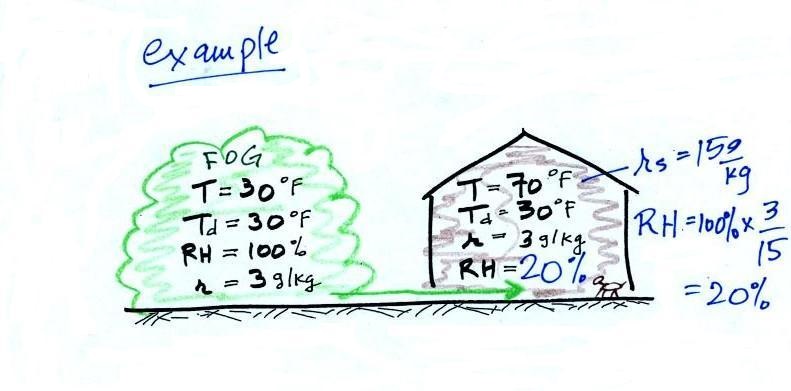
Dry air indoors in the winter
The air indoors in the winter is often quite
dry.
In the winter, cold air is brought inside your
house or apartment and warmed. Imagine foggy 30 F air
(with a RH of 100% this is a best case scenario, the cold air
outdoors usually has a relative humidity less than 100% and is
drier). Bringing the air inside and warming it will cause the
RH to drop from 100% to 20%.. This can cause chapped
skin, can irritate nasal passages, and causes cat's fur to
become charged with static electricity.
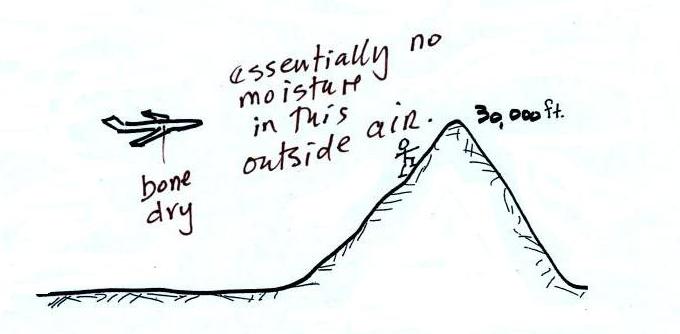
The air in an airplane comes from
outside the plane. The air outside the plane can
be very cold (-60 F perhaps) and contains very little
water vapor (even if the -60 F air is saturated it
would contain essentially no water vapor). When
brought inside and warmed to a comfortable
temperature, the RH of the air in the plane would be
essentially 0%. The RH doesn't get this low
because the airplane adds moisture to the air to make
to make the cabin environment tolerable. Still
the RH of the air inside the plane is pretty low and
passengers often complain of dehydration
on long airplane flights. This
may increase the risk of catching a cold (ref)
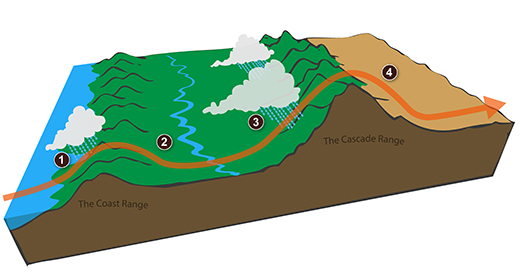
The rain-shadow effect
Next a much more important example of drying moist
air (see p. 88 in the photocopied ClassNotes).

We start with some moist but unsaturated air (the
RH is about 50%) at Point 1 (the air and dew point
temperatures would need to be equal in order for the air
to be saturated).
As it is moving toward the right the air runs into a
mountain and starts to rise*
(see below).
Rising air expands and cools. Unsaturated air cools
10 C for every kilometer of altitude gain (this is known
as the dry adiabatic lapse rate but isn't something you
need to remember). So after rising 1 km the air will
cool to 10 C which is the dew point.
The air becomes saturated at Point 2 (the air temperature
and the dew point are both 10 C). Would you be able
to tell if you were outdoors looking at the
mountain? Yes, you would see a cloud appear.
Now that the RH = 100%, the saturated air cools at a
slower rate than unsaturated air (condensation of water
vapor releases latent heat energy inside the rising volume
of air, this warming partly offsets the cooling caused by
expansion). We'll use a value of 6 C/km (an average
value). The air cools from 10 C to 4 C in next
kilometer up to the top of the mountain. Because the
air is being cooled below its dew point at Point 3, some
of the water vapor will condense and fall to the ground as
rain. Moisture is being removed from the air and the
value of the mixing ratio (and the dew point temperature)
decreases.
At Point 4 the air starts back down the right side of the
mountain. Sinking air is compressed and warms.
As soon as the air starts to sink and warm, the relative
humidity drops below 100% and the cloud disappears.
The sinking unsaturated air will warm at the 10 C/km
rate.
At Point 5 the air ends up warmer (24 C vs 20 C) and drier
(Td = 4 C vs Td = 10 C) than when it started out.
The downwind side of the mountain is referred to as a
"rain shadow" because rain is less likely there than on
the upwind side of the mountain. Rain is less likely
because the air is sinking and because the air on the
downwind side is drier than it was on the upslope side.
*This is
topographic lifting, the 4th of 4 processes that can cause
air to rise. The other three were: convergence
(surface winds spiraling inward toward a low pressure
center will rise), fronts (both warm and cold fronts cause
air to rise), and convection (warm air rises).
|
 |
We can see the effects of a rain shadow
illustrated well in the state of Oregon. The figure
above at left shows the topography (here's the source
of that map). Winds generally blow from
west to east across the state.
Coming off the Pacific Ocean the winds first encounter a
coastal range of mountains. On the precipitation map
above at right (source)
you see a lot of greens and blue on the western sides of
the coastal range. These colors indicate yearly
rainfall totals that range from about 50 to more than 180
inches of rain per year. Temperate rainforests are
found in some of these coastal locations. The line
separating the green and yellow on the left side of the
precipitation map is the summit, the ridgeline, of the
coastal mountain range.
That's the Willamette River valley, I think, in between
the coastal range and the Cascades. This valley is
somewhat drier than the coast because air moving off the
Pacific has lost some of its moisture moving over the
coastal range.
What moisture does remain in the air is removed as the
winds move up and over the taller Cascades. The
boundary between yellow/green and the red is the
ridgeline of the Cascade Mountains.
Yearly rainfall is generally less than 20 inches per year
on the eastern side, the rain shadow side, of the
Cascades. That's not too much more than
Tucson which averages about 12 inches of rain a year.
Death valley is
found on the downwind side of the Sierra Nevada
mountains (source of
left image).
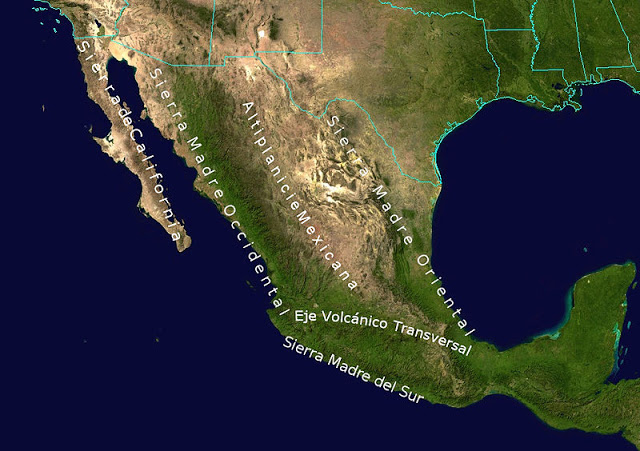
The Chihuahuan desert and the
Sonoran desert are found downwind of the Sierra Madre
mountains in Mexico (source
of the right image).
Mexico might
be a little harder to figure out because moist air can move
into the interior of the country from the east and west.
But there are mountains along both coasts, so some of that
moisture will be removed before arriving in the center of the
county.
Most of the year, the air that arrives in
Arizona comes from the west, from the Pacific Ocean (this
changes in the summer). It usually isn't very moist
by the time it reaches Arizona because it has traveled up
and over the Sierra Nevada mountains in California and the
Sierra Madre mountains further south in Mexico. The
air loses much of its moisture on the western slopes of
those mountains. Beginning in early July in
southern Arizona we start to get air coming from the south
or southeast. This air can be much moister and leads
to development of our summer thunderstorms.
Just as some of the world's driest regions are
found on the downwind side (the rain shadow side) of
mountain ranges, some of the wettest locations on earth
are on the upwind sides of mountains. There seems to
be some debate whether Mt.
Wai'ale'ale in Hawaii or Cherrapunji
India gets the most rain per year. Both get
between 450 and 500 inches of rain per year.
Measuring humidity with a sling psychrometer
Next in today's potpourri of topics was a short discussion
of how you might measure humidity. One of the ways is to
use a sling (swing might be more descriptive) psychrometer.
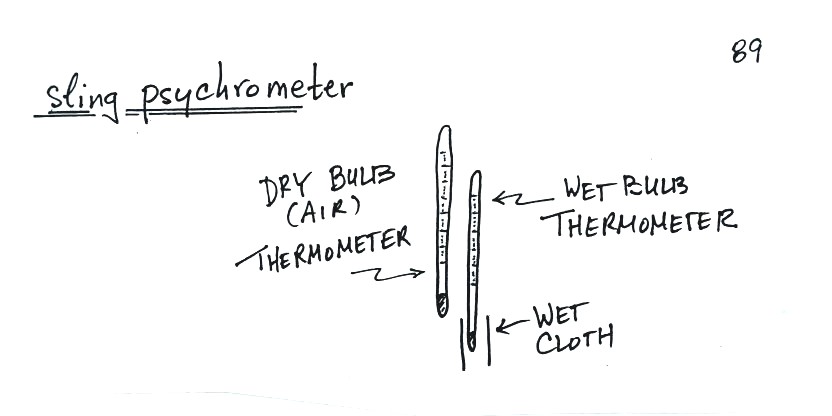
A sling
psychrometer consists of two thermometers
mounted side by side. One is an
ordinary thermometer, the other is covered
with a wet piece of cloth. To make a
humidity measurement you swing the
psychrometer around for a minute or two and
then read the temperatures from the two
thermometers. The dry thermometer
measures the air temperature.
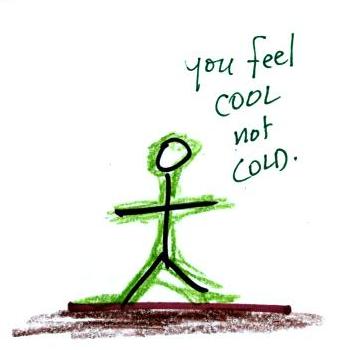
Would the wet thermometer be warmer or
colder or the same as the dry
thermometer? You can check it
out for yourself - go get one of your hands
wet. Does it feel the same as the dry
hand? You might blow on both hands to
increase the evaporation from the wet
hand. I think you'll find the wet hand
feels colder. That's what happens with
the wet bulb thermometer.
|
|
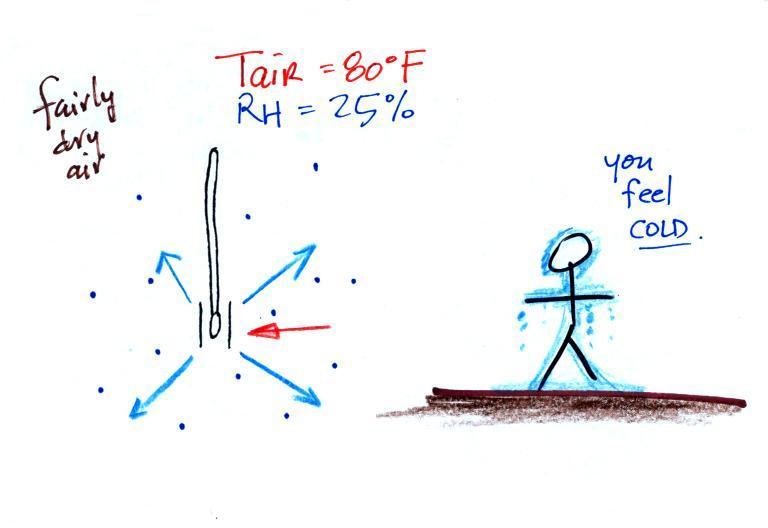
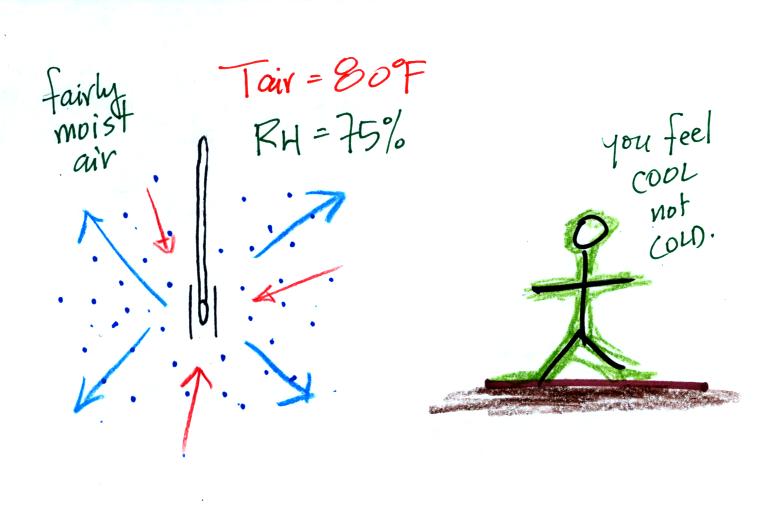
What could you say about the relative
humidity in these two situations (you can
assume the air temperature is the same in both pictures).
You would feel coldest on a dry day (the left
picture indicates dry air). The evaporative
coolers that many people use in Tucson in the summer
work much better (more cooling) early in the summer when
the air is dry. Once the thunderstorm season
begins in July and the air is more humid it is hard to
cool your house below 80 F.
Here are a bunch of details that you can read through if
you're so inclined. My goal is that you understand the
basic principle behind a sling psychrometer. For that
I think you can just skip to the summary a few pictures
further on.
Here's the situation on a day with low relative humidity.
The figure shows what will happen
as you start to swing the wet bulb
thermometer. Water will begin to evaporate
from the wet piece of cloth. The
amount or rate of evaporation will depend on
the water temperature
Warm water evaporates at a higher rate than cool
water (think of a steaming cup of hot tea and a
glass of ice tea).
The evaporation is shown as blue arrows because
this will cool the thermometer. The
water on the wet thermometer starts out at 80 F
and evaporates fairly rapidly.
The figure at upper left also shows one arrow of
condensation. The amount
or rate of condensation depends on how much
water vapor is in the air surrounding
the thermometer. In this case (low
relative humidity) there isn't much water
vapor. The condensation arrow is orange
because the condensation will release latent
heat and warm the thermometer.
Because
there is more evaporation (4 arrows)
than condensation (1 arrow) the wet bulb
thermometer will drop. As the
thermometer cools the rate of
evaporation will decrease. The
thermometer will continue to cool until
the evaporation has decreased enough
that it balances the condensation.
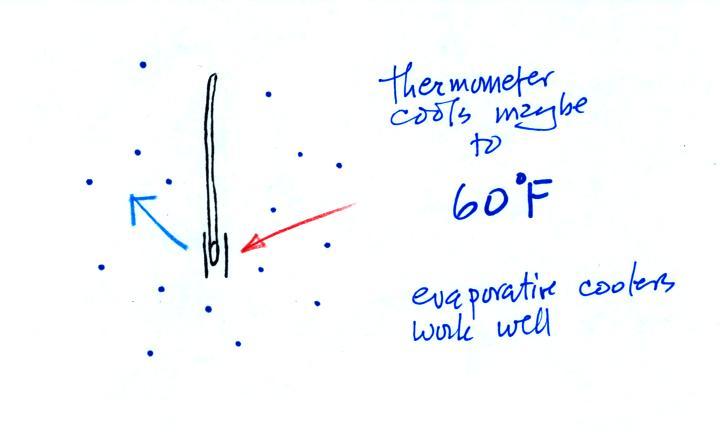
The
rates of
evaporation
and
condensation
are
equal.
The
temperature
will now
remain
constant.
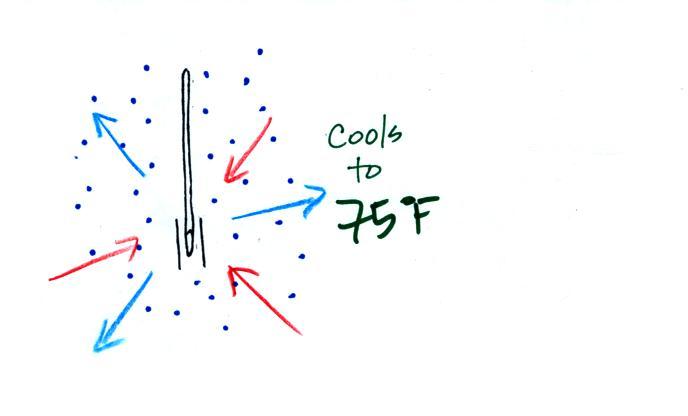
The
figure below
shows the
situation on a
day with
higher
relative
humidity.
There's
enough
moisture in
the air to
provide 3
arrows of
condensation.
The rate of evaporation stays the same, the
rate of condensation is higher. The rate of
evaporation is still higher than condensation but not by
much.
There'll
only be a little cooling before the
evaporation is reduced enough to be in
balance with condensation.
Here's a visual summary
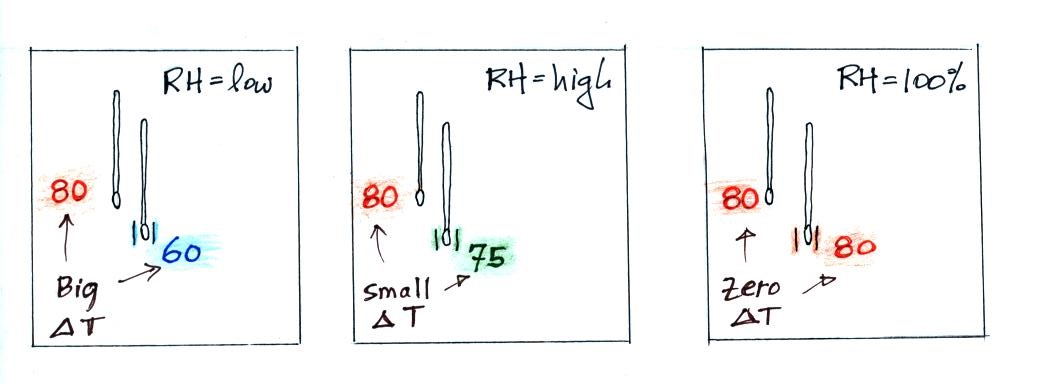
We saw the same kind of relationship between RH and
the difference between air and dew point temperature.
We didn't cover this next section in class.
Wind chill and heat index
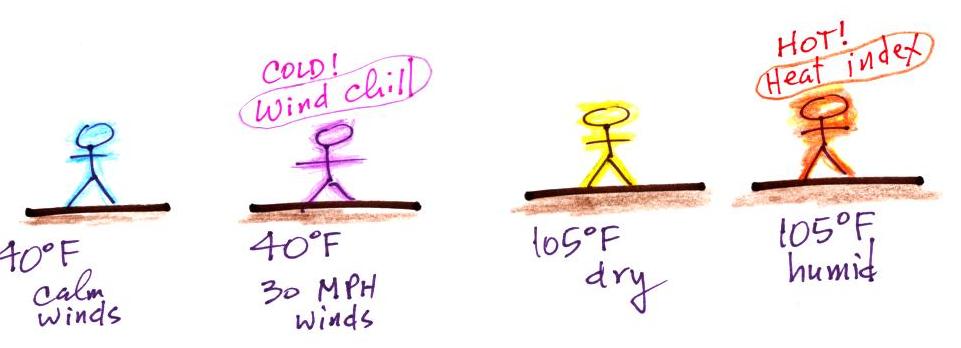
Cold temperatures and wind make it
feel colder than it really is. The wind
chill temperature tells you how much colder it
will feel ( a thermometer would measure the same
temperature on both the calm and the windy day).
If your body isn't able to keep up with the heat loss,
you can get hypothermia
and die.
There's something like that
involving heat and humidity. Your body tries to
stay cool by perspiring. You would feel hot on a
dry 105 F day. You'll feel even hotter on a 105 F
day with high relative humidity because your
sweat won't evaporate as quickly.
The heat
index measures how much hotter you'd feel. The
combination of heat and high humidity is a serious,
potentially deadly, weather hazard because it can cause
heatstroke
(hyperthermia).
Example grade summary
__________
Doe_J
quiz1 -42.0 (170 pts possible) 75.3%
quiz2 -51.0 (175 pts possible)
72.9%
writing scores: 0.0 (expt/book report) + 19.5
(1S1P pts)
writing percentage grade: 94.8%
average (no quiz scores dropped): 78.3% + 0.0 =
78.3%
average (lowest quiz score dropped): 80.2% + 0.0
= 80.2%
*because you haven't completed the experiment or book
report yet
(or your report hasn't been graded yet) an average score
of 32
was used to compute your writing grade.
__________
The grades shown here are
averages for this class.
The first two items are your scores on the
quizzes. If you did the Upper Level Charts
Optional Assignment and chose to have points added
to your Quiz #2 score they are included here.
There are two more quizzes left this semester.
The next line would ordinarily show the number of
extra credit points that you have earned so far this
semester. I haven't included extra credit
points in this grade summary. I forgot to mention that in
class. I was in a hurry
to get these summaries done in time for today's
class and there haven't been very many opportunities
to earn extra credit so far this
semester. Extra credit will be included in
future grade summaries.
Your writing score and writing percentage grade are
next. This is made up of your experiment
report grade (up to 40 pts) and the number of 1S1P
pts you've earned so far (this should be 45 pts by
the end of the semester). If you turned in an
Expt. #1 or Expt. #2 report the grade summary will
show the grade you received (the revised Expt. #1
reports haven't been graded yet). A score of 0
is shown for everyone else. If you haven't
received credit for an experiment report yet, the
computer has assumed an average score of 32 out of
40 points just to show you the effect that your
writing grade will have on your overall grade.
The computer has also taken into account the fact
that most students haven't earned 45 1S1P pts at
this point in the semester (the average student has
earned 19.5 points so far). The writing
percentage grade has the same weight as a
quiz. You should end up with a writing
percentage grade near 100% by the end of the
semester.
Finally two overall averages are computed:
(i) the first doesn't drop any quiz scores.
This is the score that must be 90.0 or above at the
end of the semester in order to be exempt from the
Final Exam.
(ii) the lowest quiz score is dropped when computing
the 2nd average. If you do have to take the
Final Exam, this is the grade you would have going
into the Final Exam. Your overall grade for
the class would be based on this average and the
score you receive on the Final Exam.
These grade estimates attempt to predict the grade
you will end up with at the end of the semester if
you keep on doing as you have done so far. If
you're happy with your overall average, you need to
keep up the quality of work you have done so
far. If your score is lower than you'd like
there is still plenty of time for improvement.
Finally be sure to check that all of the information
on your grade summary is correct.

