Friday Apr. 14, 2006
Today was the deadline for submission of 1st drafts of
experiment/scientific paper/book reports from anyone that has not
already turned in a report. Those reports will be graded quickly
and returned to you so that you will have sufficient time to revise
your report before the end of the semester.
A handout (real world features predicted by the 3-cell model and effect
of movement of the Pacific high on Tucson climate) was distributed in
class. You'll find some discussion of this handout at the end of
the Apr. 12 class online notes. Also inserted somewhere in the
Apr. 12 online notes is a link to a hidden 1S1P assignment.
We had a
last look back at the question of whether sinks drain one way in the
northern hemisphere and in the opposite direction in the southern
hemisphere.
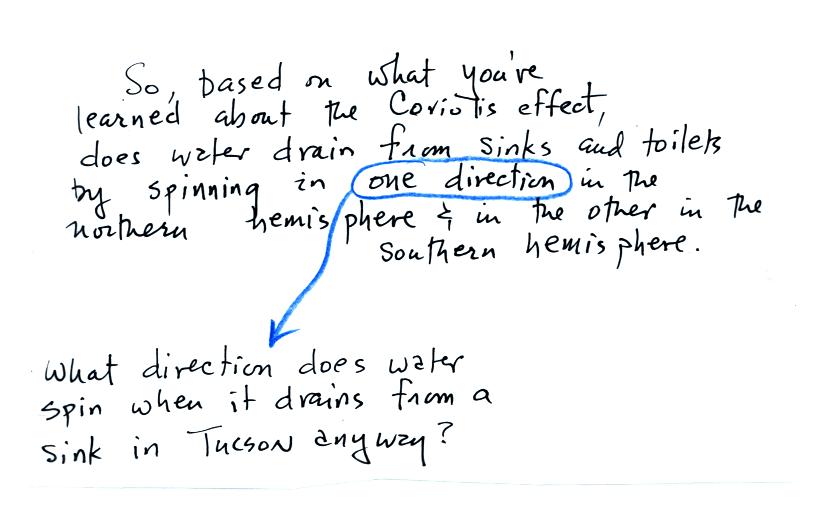
When asked, the general consensus among students in the class was
that sinks do drain in one
direction in the northern hemisphere (unsure what direction that would
be) and in the other direction in the southern hemisphere.
Unfortunately that isn't true.
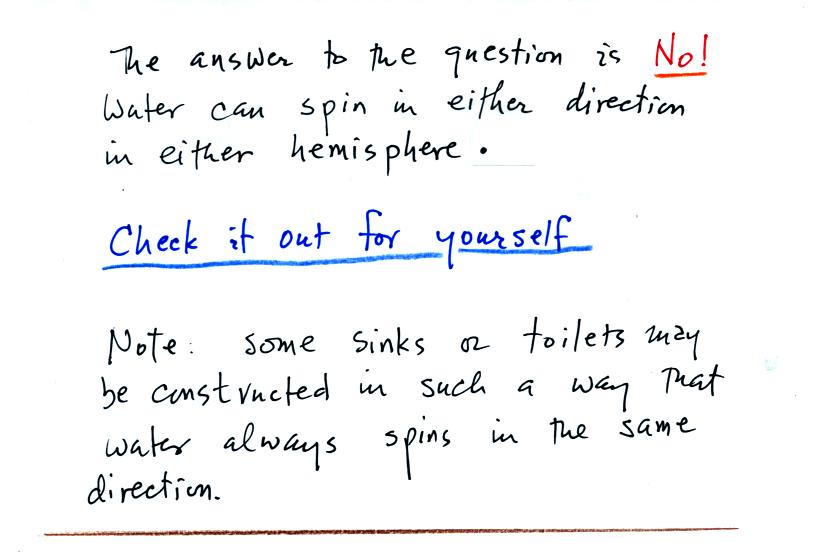
Fill a sink with water, stir the water in one direction or the other
with your finger, and then pull the plug. Then refill the sink
with water, stir it in the other direction, and let the water
drain. You'll see that you can get water to drain while
spinning in either direction.
In the case of
water
draining from a sink, the Coriolis force is much
weaker than the other forces that are present. You can ignore the
Coriolis force, water can spin in either
direction when draining
from a
sink.

We watched a short video. A gentleman would walk to one
side of
the equator (which passed right through the village in Kenya
(east coast of Africa)
where he lived) and watch as water drained from a
bucket. Then he would walk to the other side of the equator and
drain the bucket again. The water would spin in the other
direction as it drained. Then he drained the bucket right on the
equator and showed that
the water didn't spin at all.
So this seemed like clear proof that sinks do drain one way in the
northern hemisphere and another way in the southern hemisphere but, you
can't believe everything you see.
The bottom line is that the gentleman in Kenya (who had been
doing this demonstration every day for the past 6 years) could have
caused the
water to spin in either direction as it drained from the bucket.
He could have done this when he was north of the equator, south of the
equator, or right on the equator. The Coriolis force doesn't play
any role in determining
how water will drain from a bucket.
I'm sorry about any confusion this back and forth discussion might have
caused. I also hope
you weren't planning to go to the southern
hemisphere just to see this phenomenon. If so, there are still
plenty of other interesting things to see there.
Now we'll move onto Chapter 10 which is about Thunderstorms, Tornadoes,
and Lightning. The following figure is on the front side of a
second handout distributed in class.
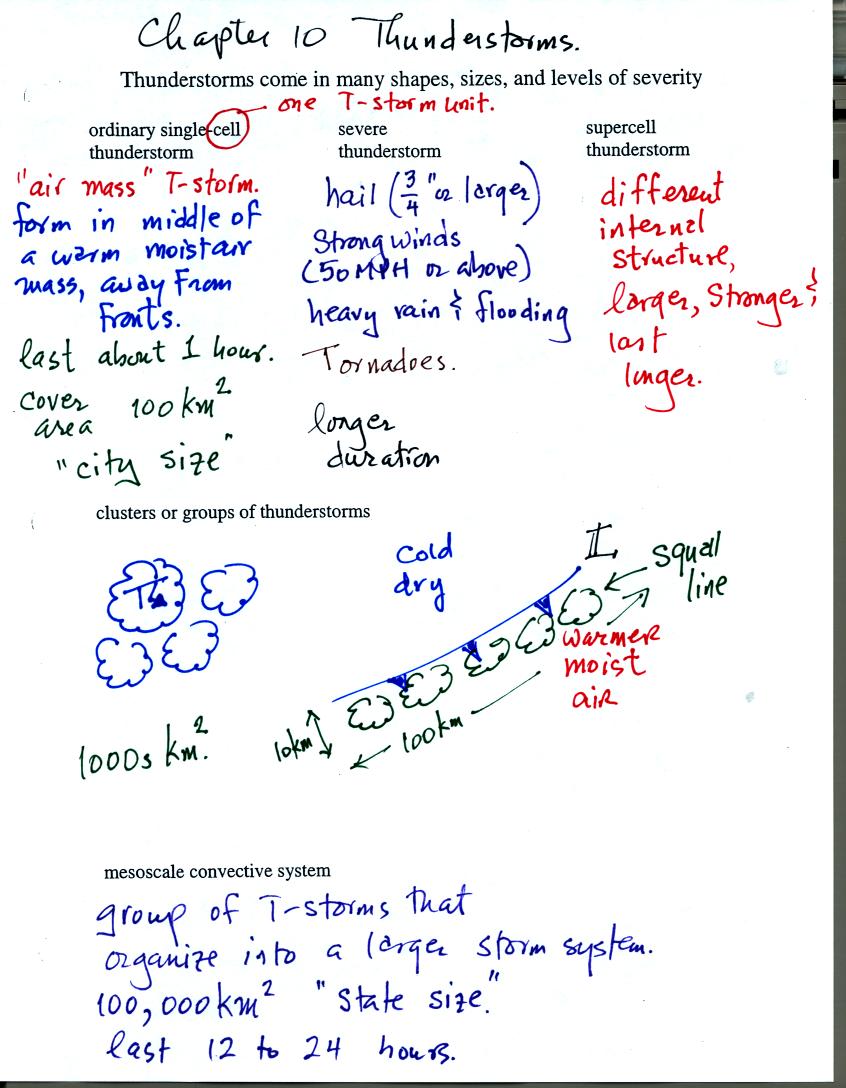
Some general information on different types of
thunderstorms. We will mostly be concerned with ordinary
single-cell thunderstorms
(also referred to as air mass thunderstorms).
The next figure is on the back side of the handout. It is a
little involved. The reason for going through this figure was to
prepare you for what you would see in a time lapse video of a
developing thunderstorm.

Refer back and forth between the lettered points in the figure
above and the commentary below.
The numbers in Column A
show the temperature of the air in the atmosphere at various altitudes
above the ground (note the altitude scale on the right edge of the
figure). On this particular day the air temperature was
decreasing at a rate of 8 C per kilometer. This rate of decrease
is referred to as the environmental lapse rate.
At Point B, some of
the surface air is put into an imaginary container, a parcel.
Then some meterological process of some kind lifts the air to 1 km
altitude. The rising air will expand and cool as it is
rising. Unsaturated (RH<100%) air cools at a rate of 10 C per
kilometer. So the 15 C surface air will have a temperature of 5 C
when it arrives at 1 km altitude. We assume that energy doesn't
flow back and forth between the air inside and outside the parcel (an
adiabatic process).
At Point C note that
the air inside the parcel is slightly colder than the air outside (5 C
inside versus 7 C outside). The air inside the parcel will be
denser than the air outside and the parcel will sink back to the
ground.
By 10:30 am the parcel is being lifted to 2 km as shown at Point D. It is still
cooling 10 C for every kilometer of altitude gain. At 2 km, at Point E the
air has cooled to its dew point temperature and a cloud has
formed. Notice at Point
F, the air in the parcel or in the cloud (-5 C) is still colder
and denser than the surrounding air (-1 C), so the air will sink back
to the ground and the cloud will disappear. Still no thunderstorm
at this point.
At noon, the air is lifted to 3 km. Notice Point G which shows that
the rising saturated air is cooling more slowly (6 C drop between 2 and
3 km altitude) than the unsaturated air did (release of latent heat
during condensation offsets some of the colling due to
expansion). The air that arrives at 3km is still colder than the
surrounding air and will sink back down to the surface Point H.
By 1:30 pm the air is getting high enough that it becomes neutrally
bouyant, it has the same temperature and density as the air around it
(-17 C inside and -17 C outside). This is called the level of
free convection.
If you can somehow or another lift air above the level of free
convection it will find itself warmer and less dense than the
surrounding air as shown at Point J and will float upward to the top of
the troposphere on its own.
This behavior was demonsrated in a time lapse video of a developing
thunderstorm. Convective air motions were visible on the tape as
early as 10 am and continued throughout the day. The developing
cloud would rise stop and sink. A little later it would get
higher but stop and sink. Finally around mid afternoon it crossed
the level of free convection, continued to move upward and a
thundersorm quickly developed.