Thursday April 13, 2006
Friday this week (April 14) is the
deadline for first drafts of experiment, scientific paper, and book
reports.
Today was the first due date for 1S1P Assignment
#3 reports. You
could turn in one or two reports today. If you didn't turn in two
reports today, you can turn in one report next Thursday (Apr. 20).
The optional assignment from Tuesday's class was
also
due
today. The in-class assignments turned in on Tuesday have been
graded (every question) and were returned today.
The reading assignments link has been updated.
Look through these notes carefully, there
is a
hidden 1S1P assignment in them somewhere. There are also many
short segments of text that have been turned blue to make it slightly more
difficult to find the link to the assignment.
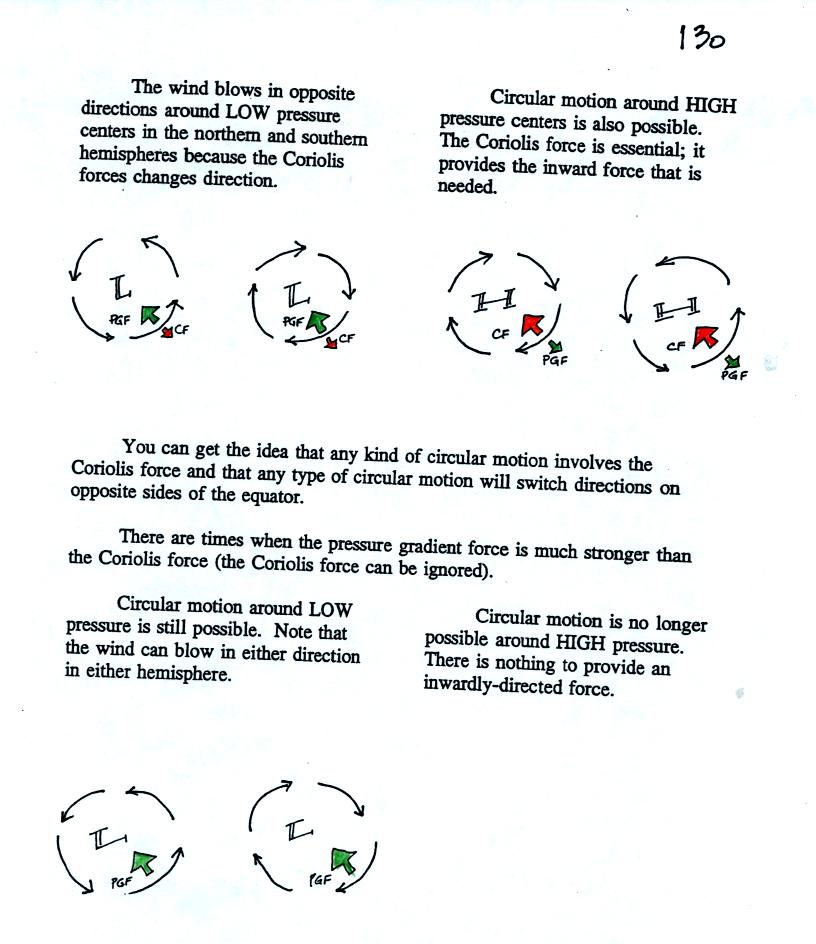
We need to
finish up the material on surface winds.
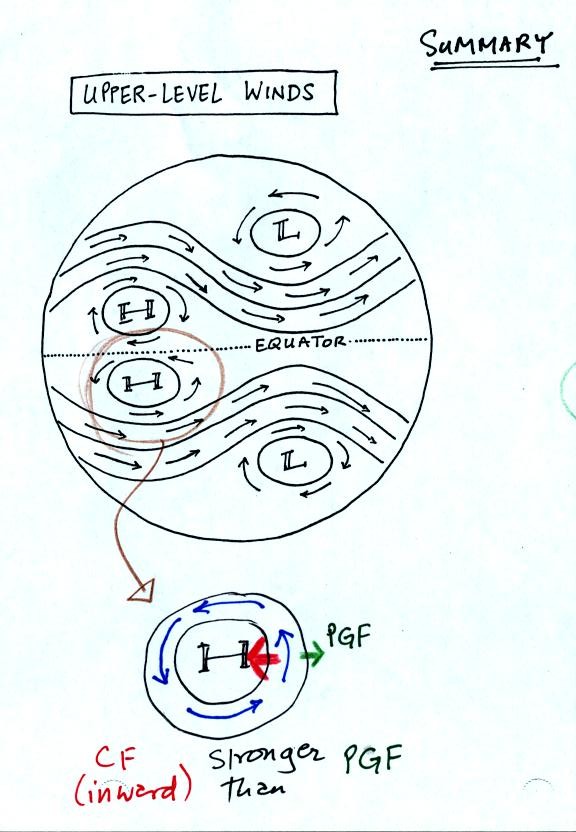
This summarizes what we have learned about upper level winds.
This is on p. 129 in the
photocopied notes. You should be able to
pick one of the Low or High pressure centers in the Northern or
Southern hemisphere (as has been done at the bottom of the picture
above) and draw in the
directions of the PGF and CF.
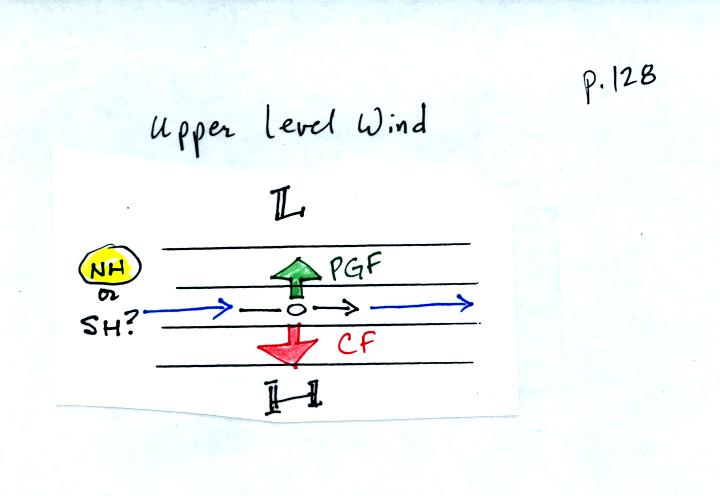
This figure shows
upper level winds (you can tell because
the winds blow parallel to the contour lines and there are only two
forces shown: PGF and CF). You can draw in the direction of the
PGF (always perpendicular to the contour lines and points toward
low). Then you can draw in the CF pointing in the opposite
direction and with equal strength. You can then see that the CF
is to the right of the wind, that is what tells you this is a northern
hemisphere map. The CF has to cancel out the PGF so that the net force
is zero. A zero net force is needed because the winds are blowing
in a straight line at constant speed.
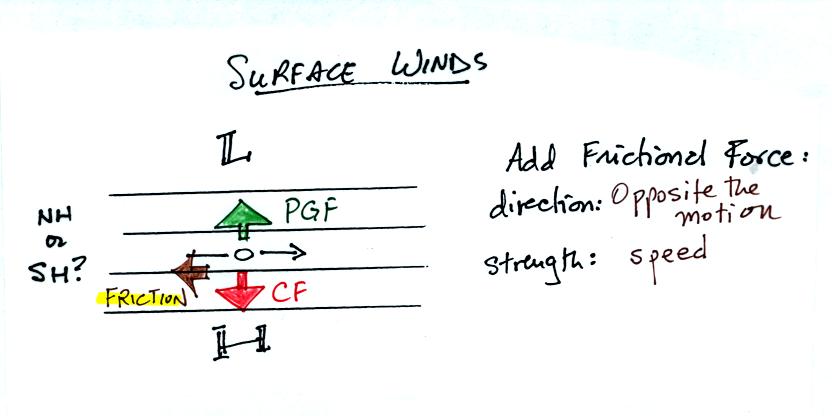
Now we add the
frictional force. Friction will always
try to slow
down a moving object. The strength of the frictional force
depends on speed. If the wind isn't blowing at all (speed is
zero), the frictional force is also zero.
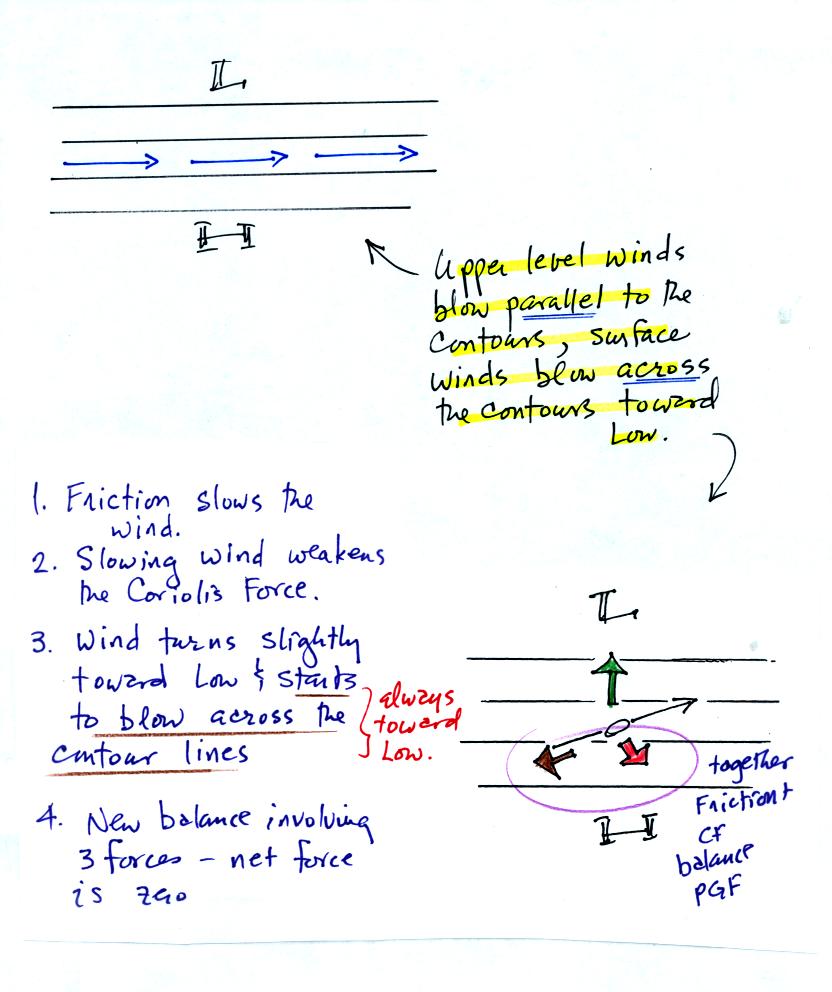
The effect of
friction is to slow down surface winds and to
cause them
to blow across the contour lines toward Low. In the example above
the PGF is balanced by the Friction and CF working together. The
net force is zero, the wind will blow in a straight line at constant
speed across the contour lines as
shown.
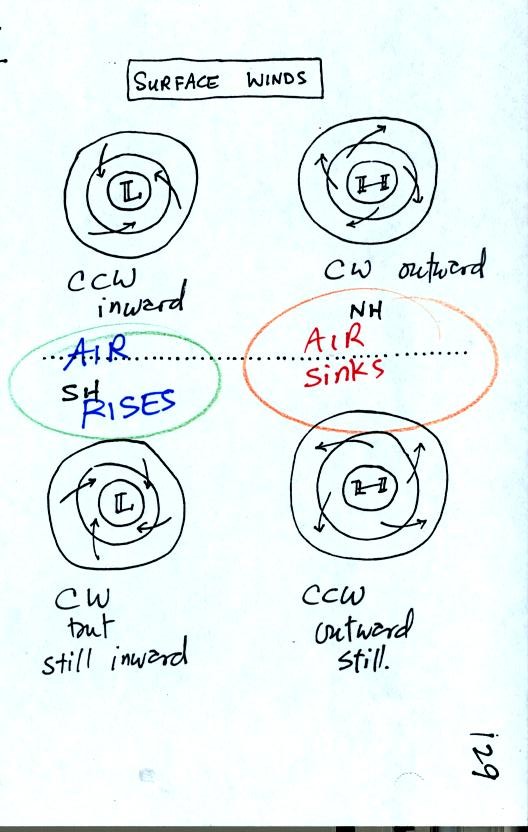
Here's the other half
of the summary on p. 129 in the photocopied
notes. This shows how the surface winds blow around Highs and
Lows in the N and S hemispheres. Air spirals inward toward the
center of low pressure in both hemispheres. This convergence
causes rising air which can lead to clouds. Thus you find cloudy
weather associated with low pressure in both hemispheres. You
find clear skies associated with high pressure.
Next we
took a little detour.
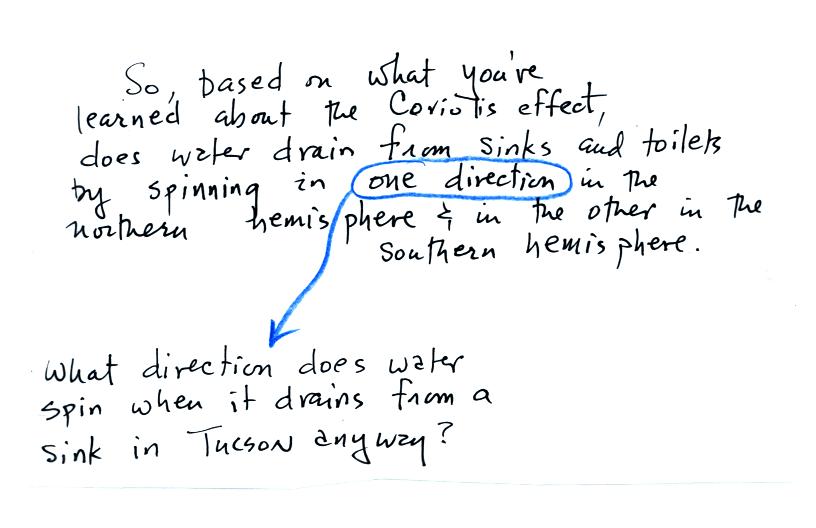
When asked, the general consensus was that sinks do drain in one
direction in the northern hemisphere (unsure what direction that would
be) and in the other direction in the southern hemisphere.
Unfortunately that isn't true.
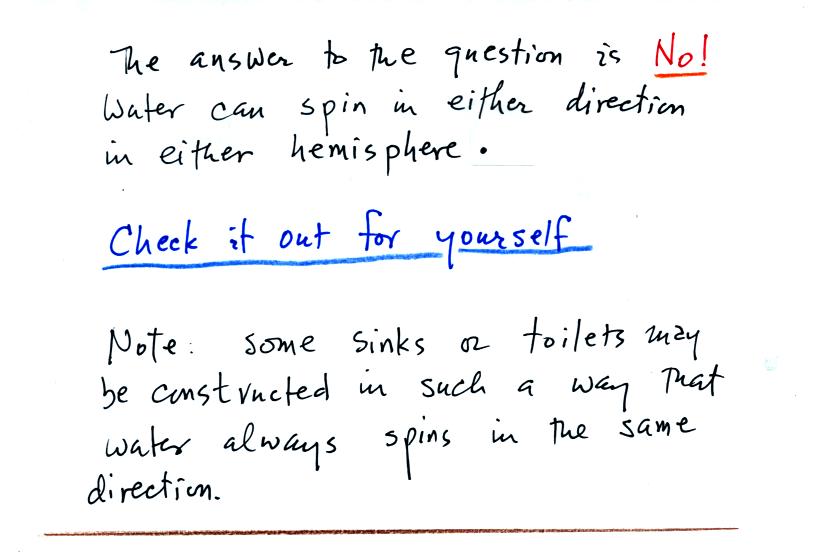
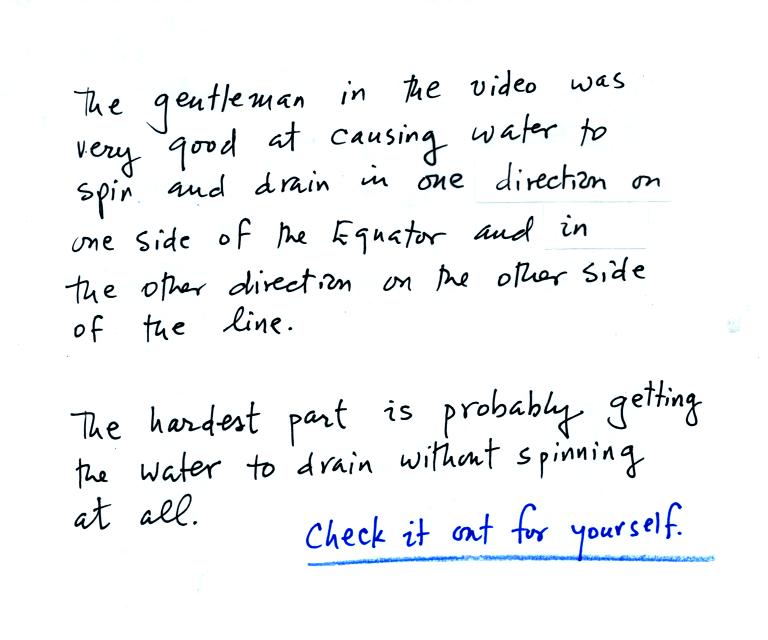
Fill a sink with water, stir the water in one direction or the other
with your finger, and then pull the plug. Then refill the sink
with water, stir it in the other direction, and let the water
drain. You'll see that you can get water to drain while
spinning in either direction.
In the case of water
draining from a sink, the Coriolis force is much
weaker than the other forces that are present. You can ignore the
Coriolis force, water can spin in either direction when draining
from a
sink.
We watched a short video. A gentleman would walk to one side of
the equator (which passed right through the village in Kenya
where he lived) and watch as water drained from a
bucket. Then he would walk to the other side of the equator and
drain the bucket again. The water would spin in the other
direction as it drained. Then he drained the bucket right on the
equator and showed that
the water didn't spin at all.
So this seemed like clear proof that sinks do drain one way
in the
northern hemisphere and another way in the southern hemisphere but, you
can't believe everything you see.
The bottom line is that the gentleman in Kenya could have caused the
water to spin in either direction as it drained from the bucket.
He could have done this when he was north of the equator, south of the
equator, or right on the equator. The Coriolis force doesn't play
any role in determining
how water will drain from a bucket.
I'm sorry about any confusion this back and forth discussion might have
caused. I also hope
you weren't planning to go to the southern
hemisphere just to see this phenomenon. If so there are still
plenty of other interesting things to see there.
We are
mostly finished with the material
on Coriolis force and other forces
that cause horizontal winds.
Differences in temperature such as might develop between a coast
and
the ocean or between a city and the surrounding country side can create
horizontal pressure differences. The horizontal pressure gradient can
then produce a wind flow pattern known as a thermal circulation.
These are generally relatively small scale circulations and the
pressure gradient is so much stronger than the Coriolis force that the
Coriolis force can be ignored. We will learn how thermal
circulations develop and then apply to concept to the earth as a whole
in order to understand large global scale pressure and wind
patterns. You can also refer to p. 131 in the photocopied notes.
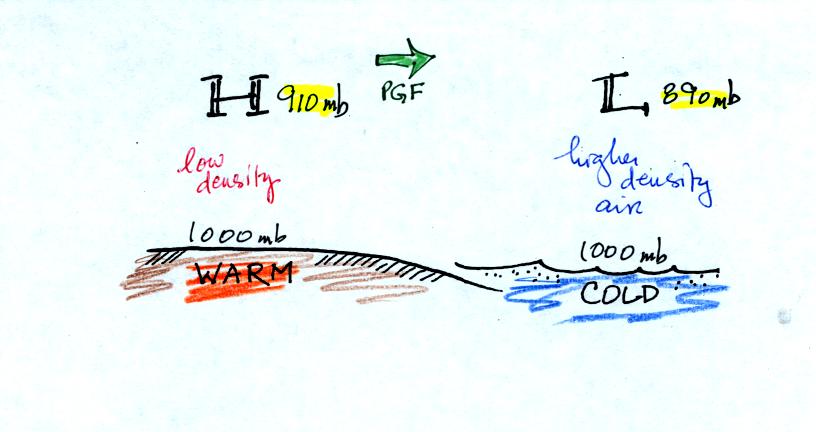
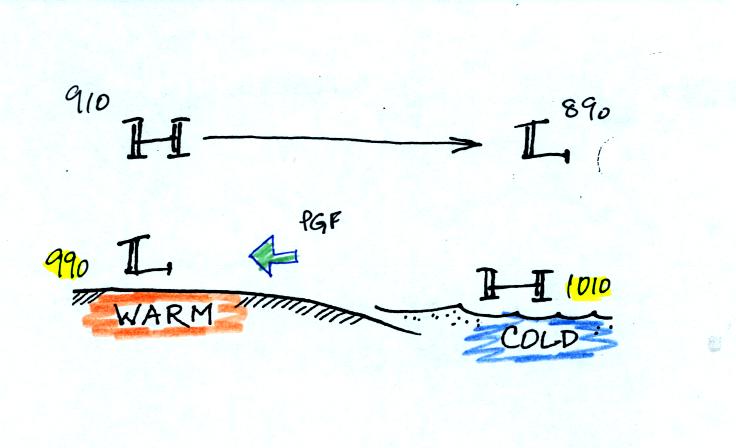
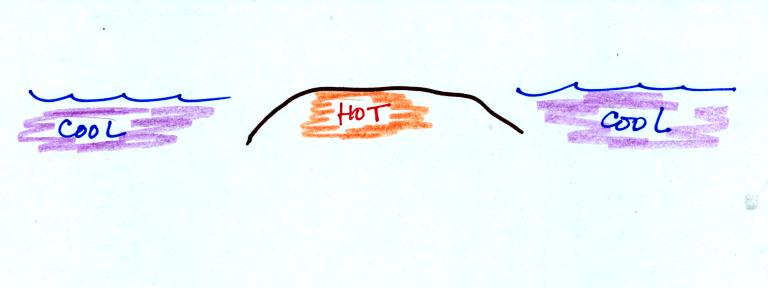
A beach will often become much warmer than the nearby ocean during
the day (the sand gets hot
enough that it is painful to walk across in
barefeet). Pressure will decrease more slowly with increasing
altitude in the warm low density air than in the cold higher density
air above the ocean. Even when the sea level pressures are the
same over the land and water (1000 mb above) an upper level pressure
gradient can be created.
The upper level pressure gradient force will cause upper
level winds to
blow from H (910 mb) toward L (890 mb).
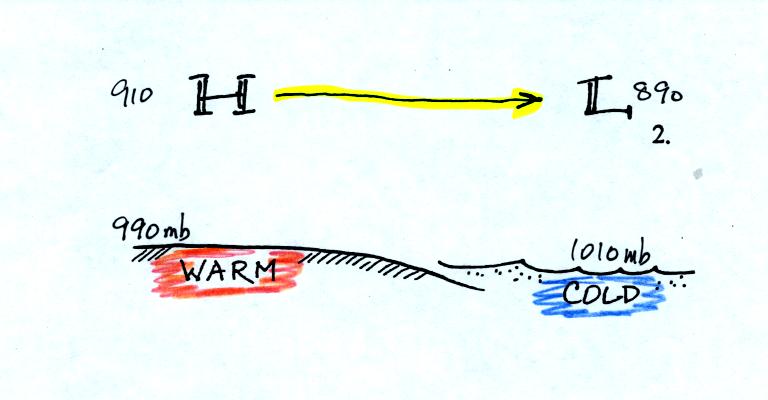
The movement of air above the ground can affect the surface
pressures. As air above the ground begins to move from left to
right, the surface pressure at left will decrease (from 1000 mb to 990
mb
in the picture above). Adding
air at right will increase the
surface pressure there (from 1000 to 1010 mb). This creates a
surface
pressure gradient and surface winds begin to blow from right to left
(the opposite of what is going on above the ground).
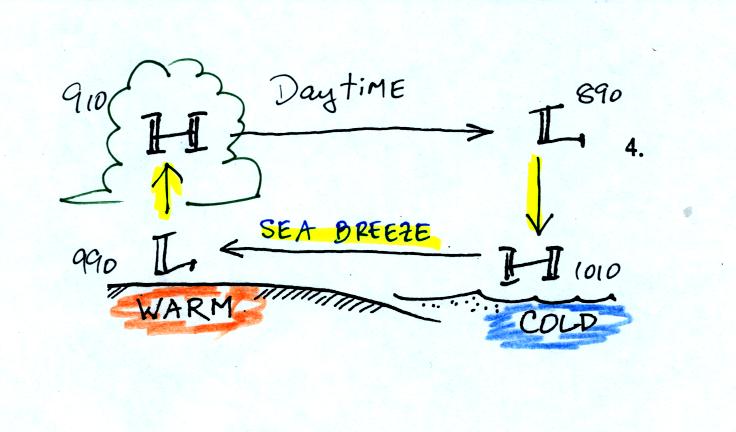
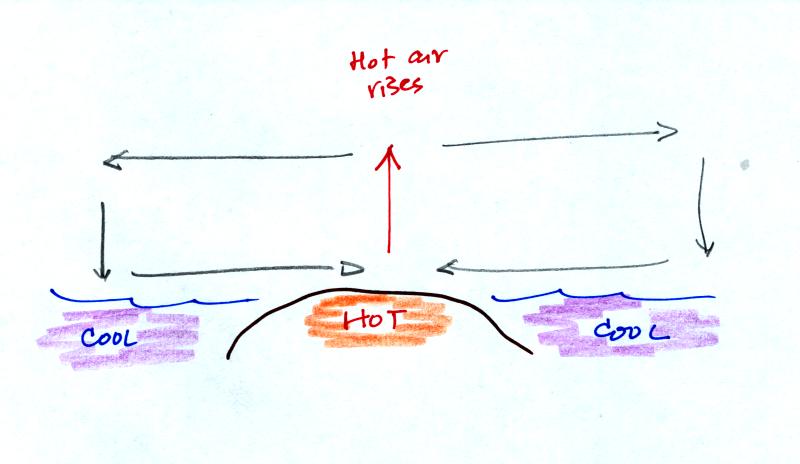
You can
complete the picture by adding rising air above the
surface low
and sinking air above the surface high. Because the surface winds
come from the ocean they are referred to as a sea breeze. These
winds would probably be pretty moist so clouds would be likely over
land above the surface low.
At some point during the night, the ocean often ends up warmer than the
land. The thermal
circulation reverses direction. The
surface winds are then called a land breeze and clouds and rain form
out over the ocean.
Here are a
couple of sample thermal circulation questions (borrowed from the MWF
class's notes, where they were more clearly drawn)
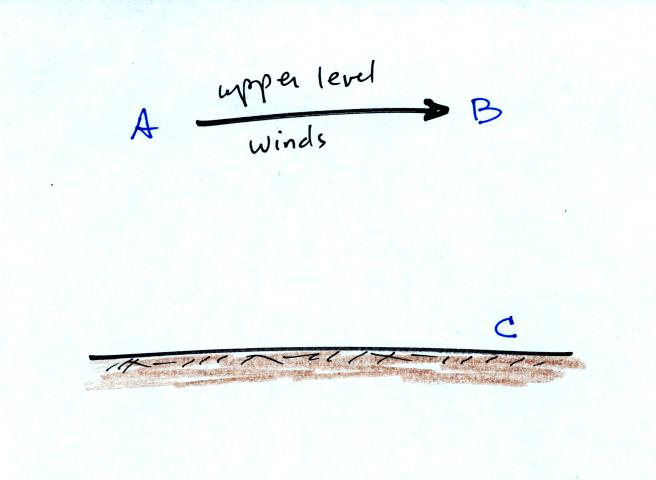
Based on the upper level wind direction in the figure answer
the
following questions.
Is the pressure at Point A GREATER LESS EQUAL
than(to) the pressure at Point B?
Is the pressure at Point B GREATER LESS EQUAL
than(to) the pressure at Point C?
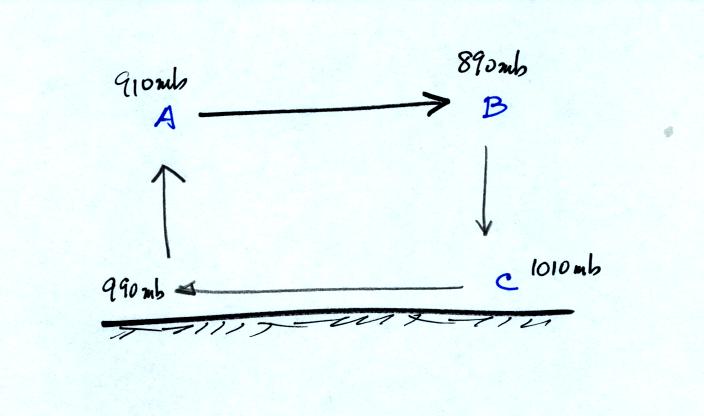
Answering the first half of the question should be easy if
you remember
the upper level wind is created by a horizontal pressure gradient
force. The pressure gradient force always points from high toward
low. Thus the pressure
at Point A is GREATER than the pressure at Point B.
Answering the second half should also be easy if you remember that
pressure always decreases with increasing altitude in the atmosphere,
so the pressure at Point B
is LESS than the pressure at Point C. You might be
tempted to say high pressure at Point B is pushing the wind toward
lower pressure at Point C, but that wouldn't be correct. What
does cause the wind to sink from Point B toward Point C? The
answer is gravity.
--------
Your job here is to draw the thermal circulation that would
develop in
the vicinity of an island surrounded by cooler ocean water. To
answer a question like this you don't want to go through the 4 or 5
steps in the development of a thermal circulation like we did at the
beginning of class. You want something simple that can get you
started, something that you
can remember; something like "hot air
rises."
Here are
some additional examples of wind patterns that resemble thermal
circulations. These
examples weren't shown or discussed in class.
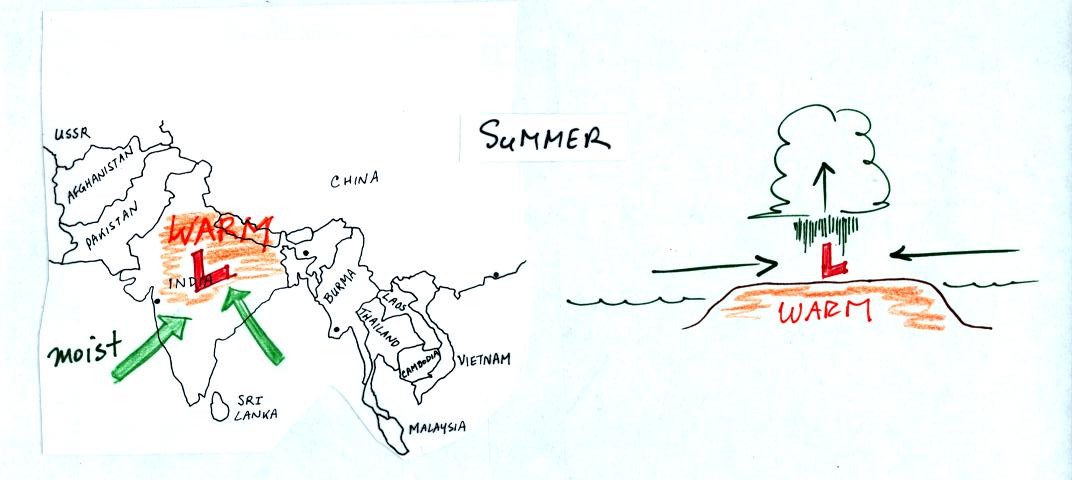
In the summer India and SE Asia become warmer than
the oceans
nearby. Surface low pressure forms over the land, moist winds
blow from the ocean onshore, and very large amounts of rain can follow.
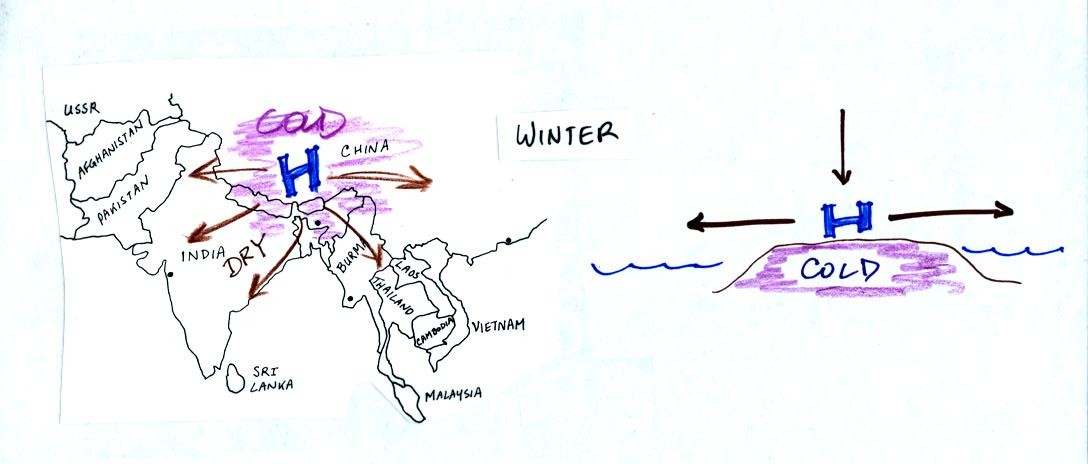
In the winter, high pressure forms over the land, and dry
winds blow
from land out over the ocean.
This is an example of a monsoon wind system, a situation where the
prevailing winds change directions with the seasons.
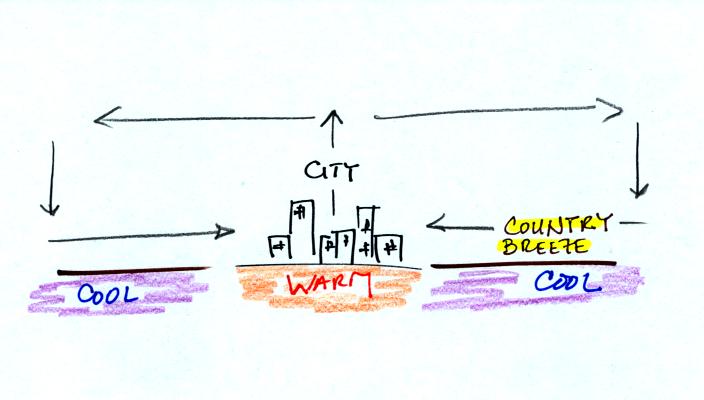
Cities will sometimes become warmer than the surrounding countryside,
especially at night.
This difference in temperature can create a
"country breeze."
Now we'll
apply the thermal circulation concept to the earth as a whole and learn
about the "one-cell model" of the earth's global pressure and wind
circulation pattern. You'll learn what the "one-cell" refers to
shortly. A model is
just a simplified depiction
or representation of the earth's global
scale circulation.
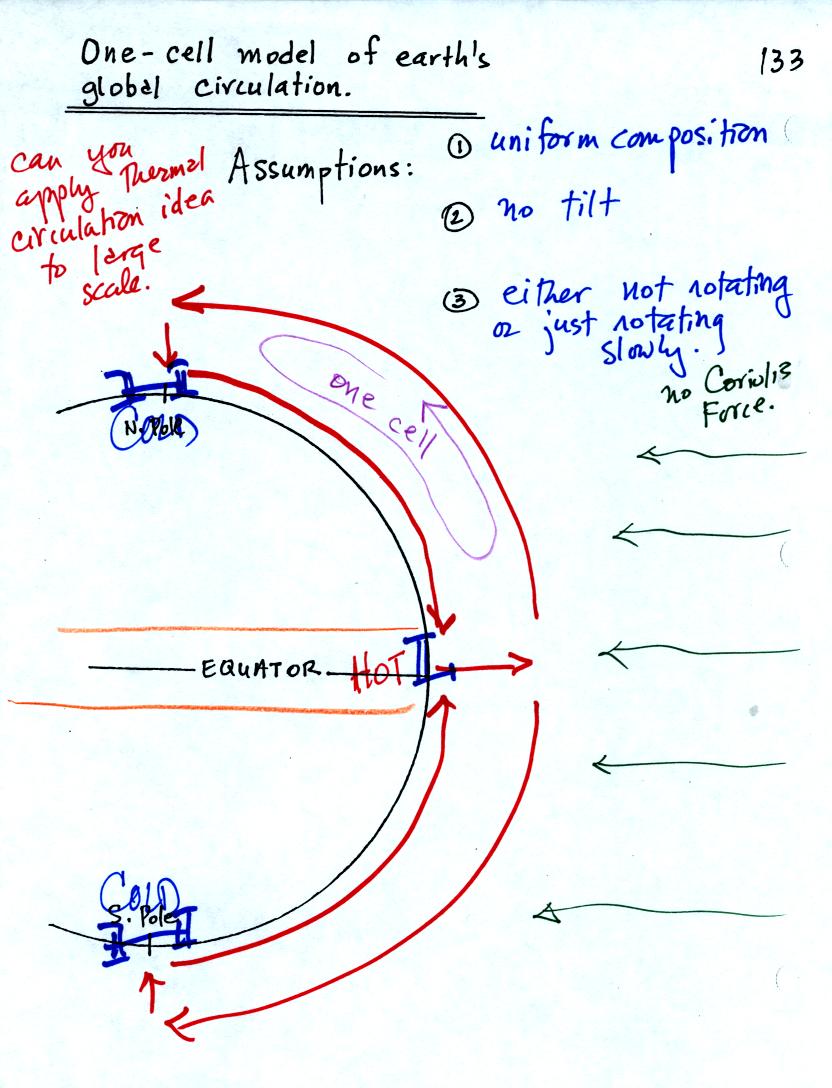
The incoming sunlight shines on the earth most directly at
the
equator. The equator will become hotter than the poles. By
allowing the earth to rotate slowly we spread this warmth out along the
entire length of the equator rather than concentrating it in a spot on
the side of the earth facing the sun.
You can see the wind circulation pattern that would develop (really
just the same situation as the second sample problem studied
earlier). The term one cell just means there is one complete loop
in the northern hemisphere and another in the southern hemisphere.
Next we will remove the assumption concerning the rotation of the
earth. We won't be able to ignore the Coriolis force now.
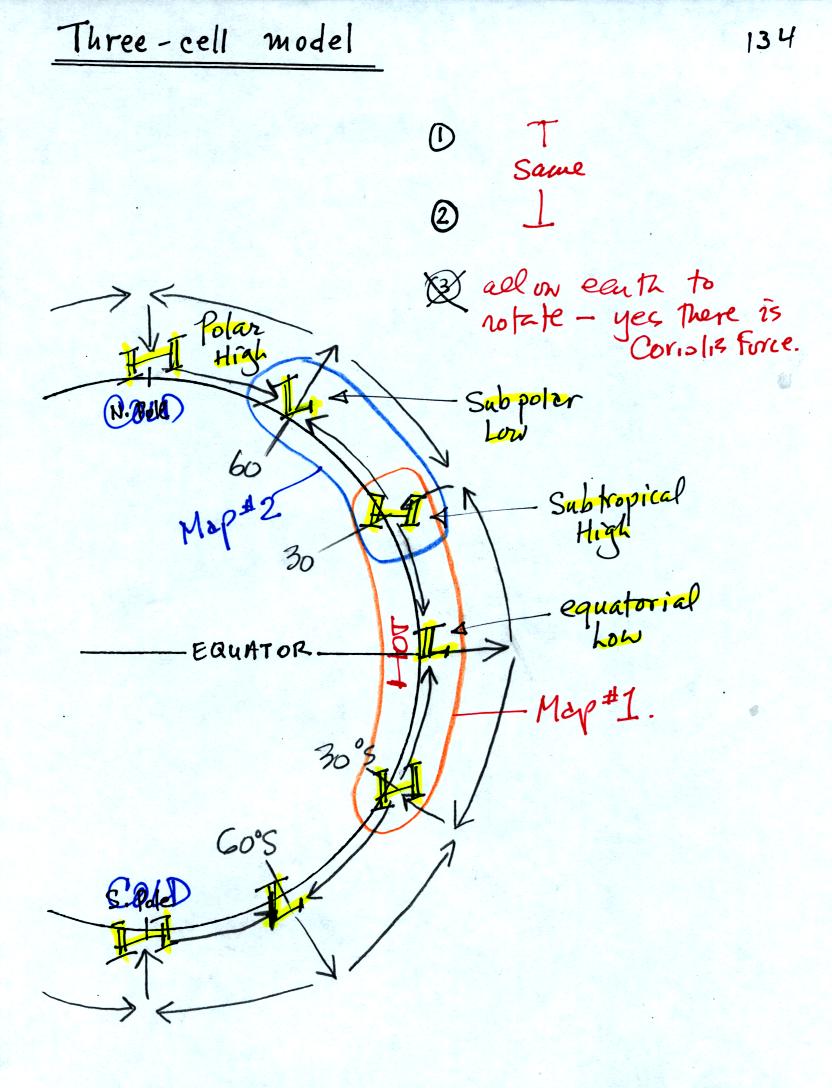
Here's what a computer would predict you would now
see on
the earth. Things are pretty much the same at the equator in the
three cell and one cell models: low pressure and rising air. At
upper levels the winds begin to blow from the equator toward the
poles. Once moving the air will be deflected to the
right
or left by the Coriolis force and won't make it to the poles.
There end up being three closed loops in the northern and in the
southern hemispheres. Here
is the link to the 1S1P assignment. There are belts of low pressure
at the equator
(equatorial low) and at 60 degrees latitude (subpolar
low). There are belts of high pressure (subtropical high) at 30
latitude and high pressure centers at the two poles (polar highs).
We will look at the surface features in a little more detail because
some of what is predicted is actually found on the earth.
We'll first look at pressure and winds on the earth from 30 S to 30 N,
the region enclosed by the dotted line and labelled Map #1 above.
On Map #2 we'll look at the region from 30 N to 60 N, where most of the
US is located.
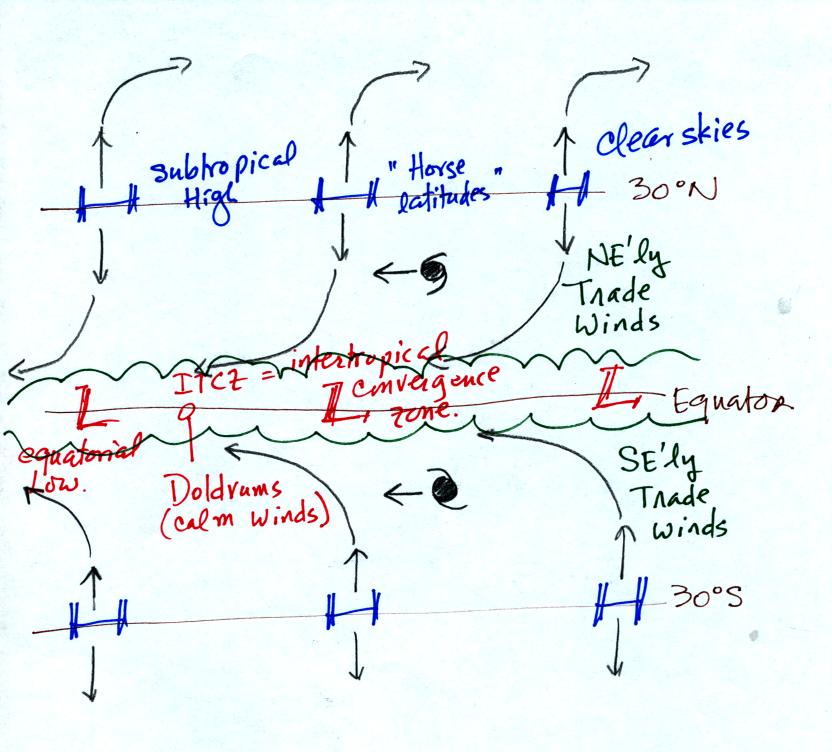
This is Map #1. Let's start at 30 S. Winds will
begin to
blow from High pressure at 30 S toward Low pressure at the
equator. Once the winds start to blow they will turn to the left
because of the Coriolis force. Winds blow from 30 N toward the
equator and turn to the right in the northern hemisphere (you need to
turn the page upside down and look in the direction the winds are
blowing). These are the Trade Winds. They converge at the
equator and the air there rises (refer back to the crossectional view
of the 3-cell model). This is the cause of the band of clouds that you
can often see at or near the equator on a satellite photograph.
The Intertropical Convergence Zone or ITCZ is another name for the
equatorial low pressure belt. This region is
also referred to as the doldrums because it is a region where surface
winds are often weak. Sailing ships would sometimes get stranded
there hundreds of miles from land. Fortunately it is a cloudy and
rainy region so the sailors wouldn't run out of drinking water.
Hurricanes form over warm ocean water in the subtropics between the
equator and 30
latitude. Winds at these latitudes have a strong easterly
component and hurricanes, at least early in their development, move
from east to west. Middle latitude storms found between 30 and 60
latitude where the
prevailing westerly wind belt is found move from
west to east.
You find sinking air, clear skies, and weak surface winds associated
with the subtropical high pressure belt. This is also known as
the horse latitudes. Sailing ships could become stranded there
also. Horses were apparently either thrown overboard (to conserve
drinking water) or eaten if food supplies were running low. Note
that sinking air is associated with the subtropical high pressure belt
so this is a region on
the earth where skies are clear (Tucson is
located at 32 N latitude, so we are affected by the subtropical high
pressure belt).
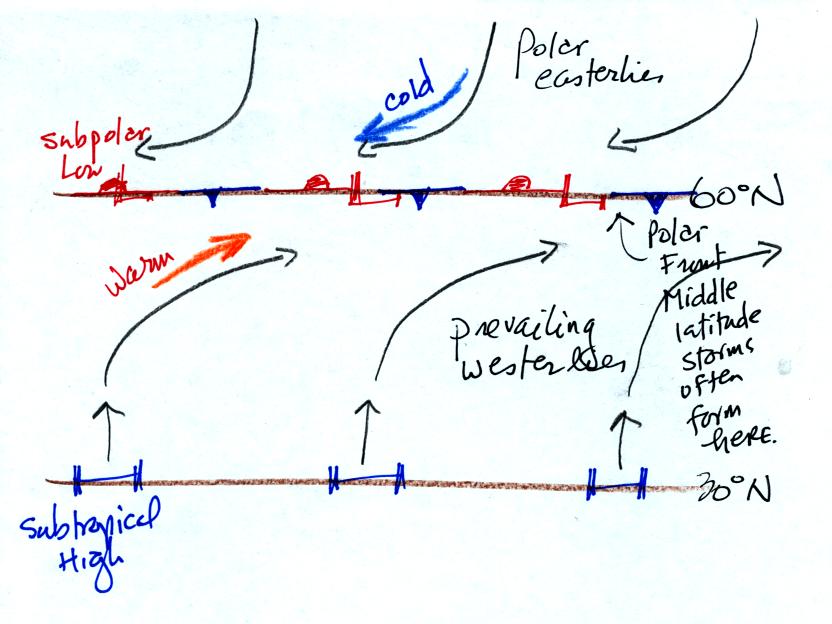
Here's Map #2, it's a little simpler. Winds blowing
north from H
pressure at 30 N toward Low pressure at 60 N turn to the right and blow
from the SW. These are called the "prevailing westerlies."
In the southern hemisphere the prevailing westerlies blow from
the northwest. The 30 S to 60 S latitude belt in the southern
hemisphere is mostly ocean. The prevailing westerlies there can
get strong, especially in the winter. They are sometimes referred
to as the "roaring 40s" or the "ferocious 50s."
The subpolar low pressure belt is found at 60
latitude. Note this
is also a convergence zone where the cold polar easterly winds
and the
warmer prevailing westerly winds meet. The boundary between these
two different kinds of air is called the polar front and is often drawn
as a stationary front on weather maps. A strong current of winds
called the polar jet stream is found overhead. Many middle
latitude storms will form along the polar front.
Despite
the simplifying assumptions in the 3-cell model, some of the features
that it predicts (particularly at the surface) are found in the real
world. This is illustrated in the next figure. This is the handout that was
distributed in class. It wasn't discussed in class on Thursday,
however, and might not be discussed much in class next Tuesday
either. That will allow us to
start the material on thunderstorms.
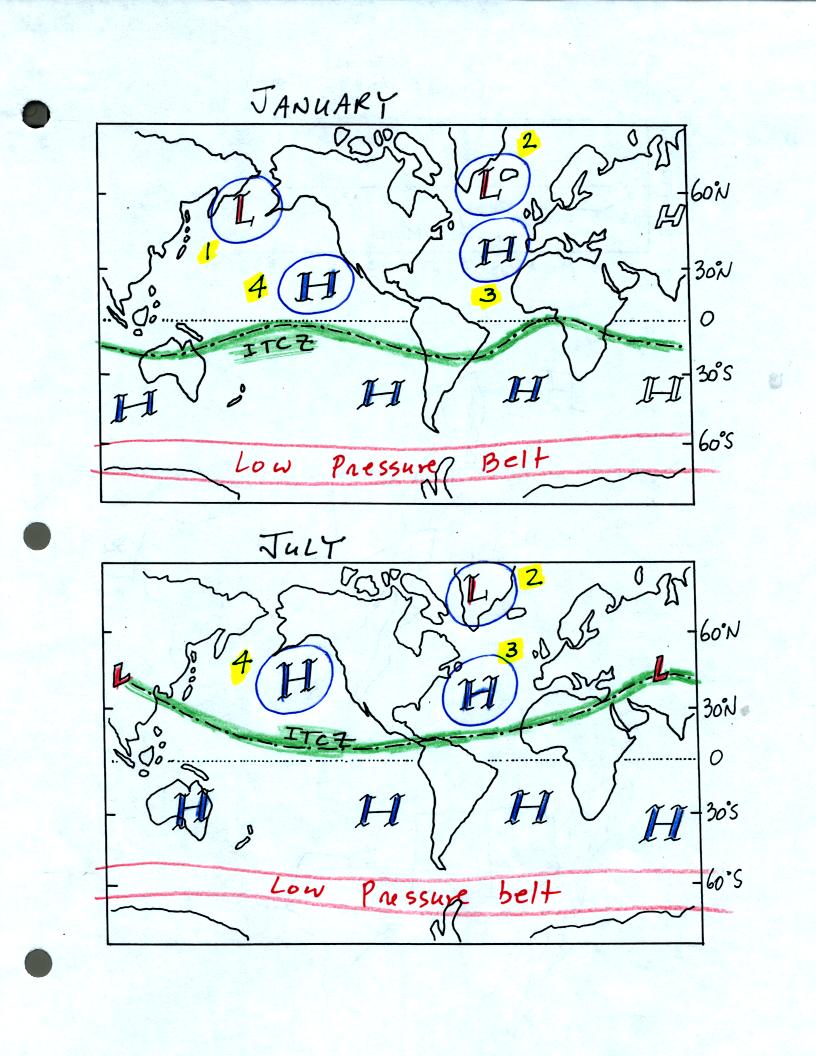
The 3-cell model predicts subtropical belts of
high
pressure near
30
latitude. What we really find are large circular centers of high
pressure. In the northern
hemisphere the Bermuda high is found
off the east coast of the US (feature 3 in the figure), the Pacific
high (feature 4) is positioned off the
west coast. Circular low pressure centers, the Icelandic (feature
2) and
Aleutian low (feature 1), are found near 60 N. In the southern
hemisphere you
mostly just find ocean near 60 S latitude. In this part of the
globe the assumption of the earth being of uniform composition is
satisfied and a true subpolar low
pressure belt as predicted by the 3-cell model is found near 60 S
latitude.
The equatorial low or IRCZ is shown in green. Notice how it moves
north and south of the equator at different times of the year.
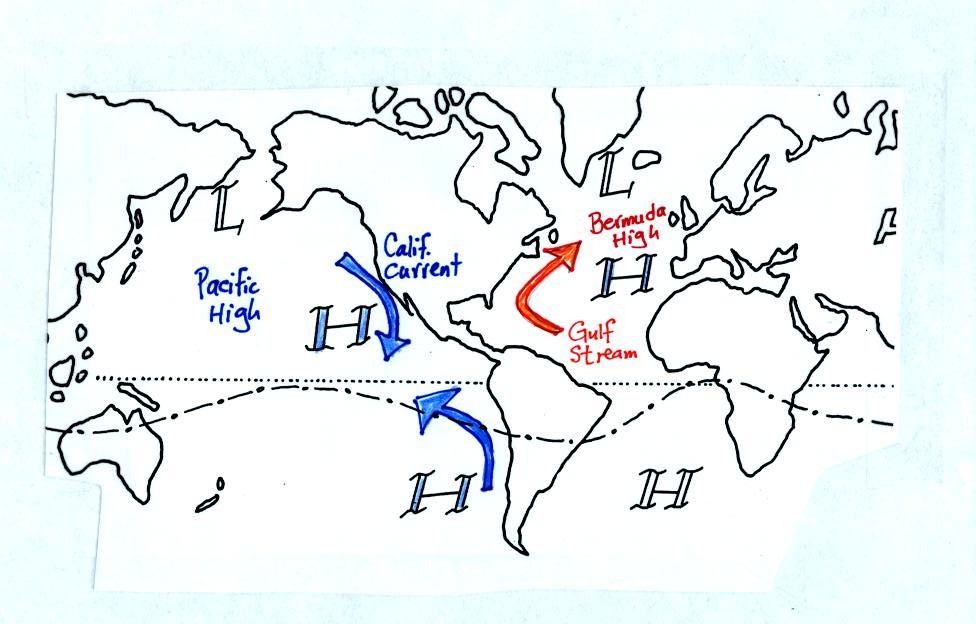
The winds that blow around these large scale high and low pressure
centers create the major ocean currents of the world. If you
remember that high pressure is positioned off the east and west coast
of the US, and that winds blow clockwise around high in the northern
hemisphere, you can determine the directions of the ocean currents
flowing off the east and west coasts of the US. The Gulf Stream
is a warm current that flows from south to north along the east coast,
the California current flows from north to south along the west coast
and is a cold current. A
cold current is also found along the
west coast of South America (a disruption of this current often signals
the beginning of an El Nino event); winds blow counterclockwise around
high in
the southern hemisphere. These currents are shown in the enlargement
below.
Movement
of the
Pacific high (north of 30 N in the summer and south of 30 N in the
winter) can have an effect
on weather in Tucson and much of the rest of
the
desert SW. This is illustrated below.
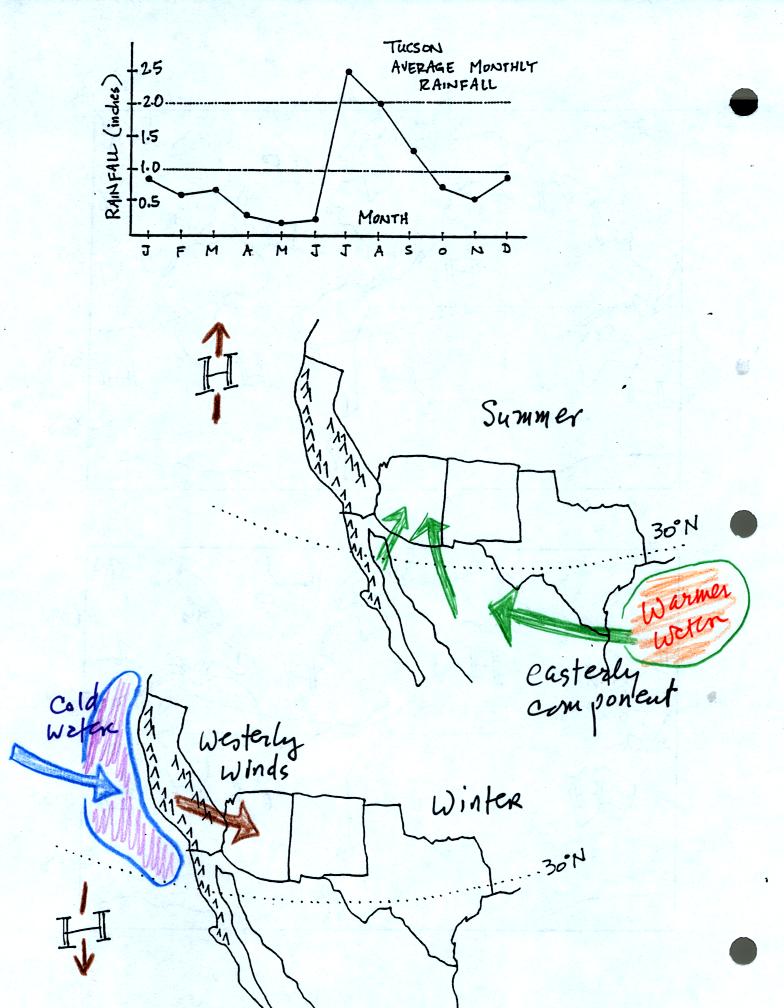
In the winter Arizona is north of the Pacific high and the winds that
blow through our region have a westerly component. They originate
over cool Pacific Ocean water and then must cross mountains in
California. These winds are often pretty dry by the time they
reach Arizona, dew points are usually in the 20s, 30s and 40s.
In the summer winds become easterly because the Pacific High moves well
to our north. These winds transport moisture from the Gulf of
Mexico into Mexico. Moisture then makes its way into Arizona from
Mexico. Dew points rise into the 50s and 60s.
This seasonal change in wind direction is another example of a monsoon
wind system.
Most of our yearly rainfall comes from summer thunderstorms in July,
August, and September. We have a secondary "wet" season during
the winter months of December, January, and February.