Tue., April 18, 2006
Reports turned in last week have been graded.
Revisions are due
in two weeks on Tue., May 2 (the last day of classes).
The most recent optional assignment has been graded. If you
answered all of the questions (correctly or incorrectly it didn't
matter) and turned the assignment in on time you received full credit
(it would have been too difficult and time consuming an assignment to
grade). You can find an online version of the assignment here and the answers to the
assignment questions here.
A preliminary version of the Quiz #4 Study
Guide is now available online. It is likely to change
slightly over the next few days.
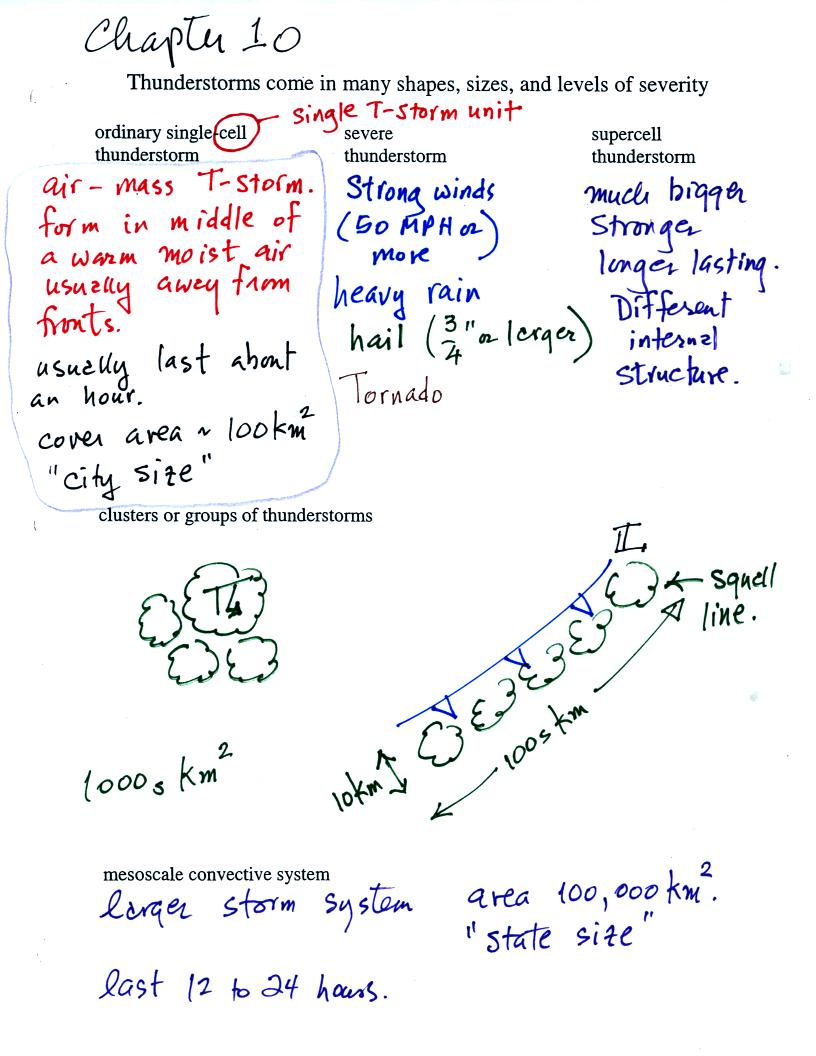
Some general information on different types of
thunderstorms. We will mostly be concerned with ordinary
single-cell thunderstorms
(also referred to as air mass thunderstorms).
The next figure is on the back side of the handout. It is a
little involved. The reason for going through this figure was to
prepare you for what you would see in a time lapse video of a
developing thunderstorm.
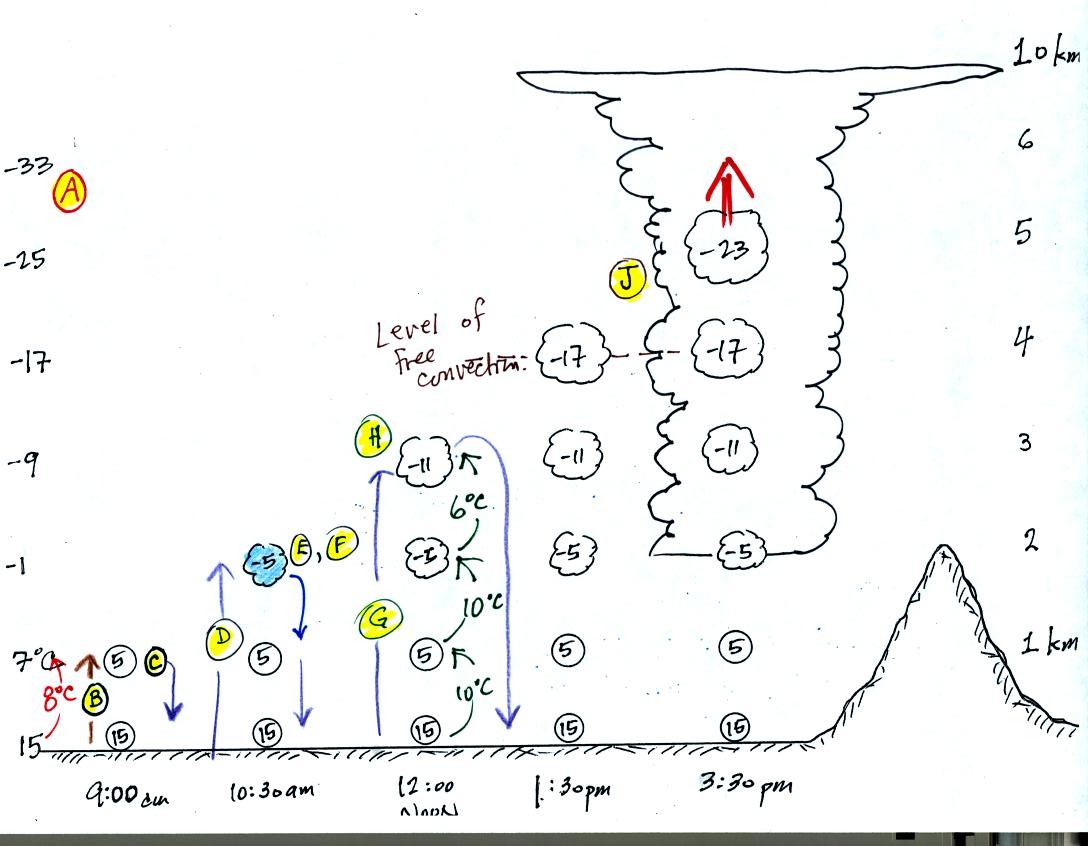
Refer back and forth between the lettered points in the
figure
above and the commentary below.
The numbers in Column A
show the temperature of the air in the atmosphere at various altitudes
above the ground (note the altitude scale on the right edge of the
figure). On this particular day the air temperature was
decreasing at a rate of 8 C per kilometer. This rate of decrease
is referred to as the environmental lapse rate.
At Point B, some of
the surface air is put into an imaginary container, a parcel.
Then a meterological process of some kind lifts the air to 1 km
altitude. The rising air will expand and cool as it is
rising. Unsaturated (RH<100%) air cools at a rate of 10 C per
kilometer. So the 15 C surface air will have a temperature of 5 C
when it arrives at 1 km altitude. We assume that energy doesn't
flow back and forth between the air inside and outside the parcel (an
adiabatic process).
At Point C note that
the air inside the parcel is slightly colder than the air outside (5 C
inside versus 7 C outside). The air inside the parcel will be
denser than the air outside and the parcel will sink back to the
ground.
By 10:30 am the parcel is being lifted to 2 km as shown at Point D. It is still
cooling 10 C for every kilometer of altitude gain. At 2 km, at Point E the
air has cooled to its dew point temperature and a cloud has
formed. Notice at Point
F, the air in the parcel or in the cloud (-5 C) is still colder
and denser than the surrounding air (-1 C), so the air will sink back
to the ground and the cloud will disappear. Still no thunderstorm
at this point.
At noon, the air is lifted to 3 km. Notice Point G which shows that
the rising saturated air is cooling more slowly (6 C drop between 2 and
3 km altitude) than the unsaturated air did (release of latent heat
during condensation offsets some of the colling due to
expansion). The air that arrives at 3km, Point H, is again still
colder than the
surrounding air and will sink back down to the surface.
By 1:30 pm the air is getting high enough that it becomes neutrally
bouyant, it has the same temperature and density as the air around it
(-17 C inside and -17 C outside). This is called the level of
free convection.
If you can somehow or another lift air above the level of free
convection it will find itself warmer and less dense than the
surrounding air as shown at Point J and will float upward to the top of
the troposphere on its own.
This
behavior was demonsrated in a time lapse video of a developing
thunderstorm. Convective air motions were visible on the tape as
early as 10 am and continued throughout the day. The developing
cloud would rise, stop, and sink. A little later it would get
higher but stop and sink. Finally around mid afternoon it crossed
the level of free convection, continued to move upward and a
thundersorm quickly developed.
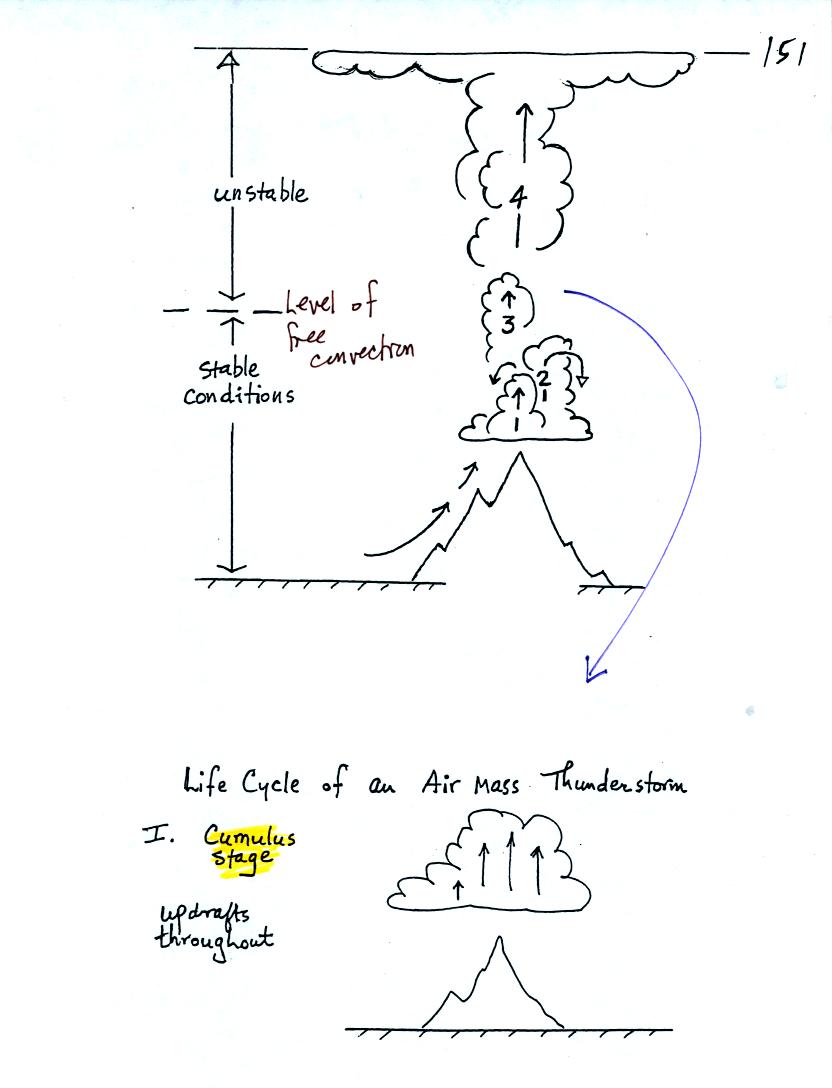
The top portion of this figure repeats what we just
discussed: it takes some effort and often a good part of
the
day before a thunderstorm forms. Early in the day air is lifted
and released. The air finds itself colder and denser than the
surrounding air and sinks back to where it started from. As the
day goes on the air is lifted higher and higher. If the air is
lifted above the "level of free convection" the air parcel will find
itself warmer and less dense than the surrounding air and will continue
to float upward on its own. This is really the beginning of a
thunderstorm.
An ordinary single cell
thunderstorm goes through a 3-stage life cycle. In
the first stage, the cumulus stage, you would find updrafts throughout
the inside of the cloud.
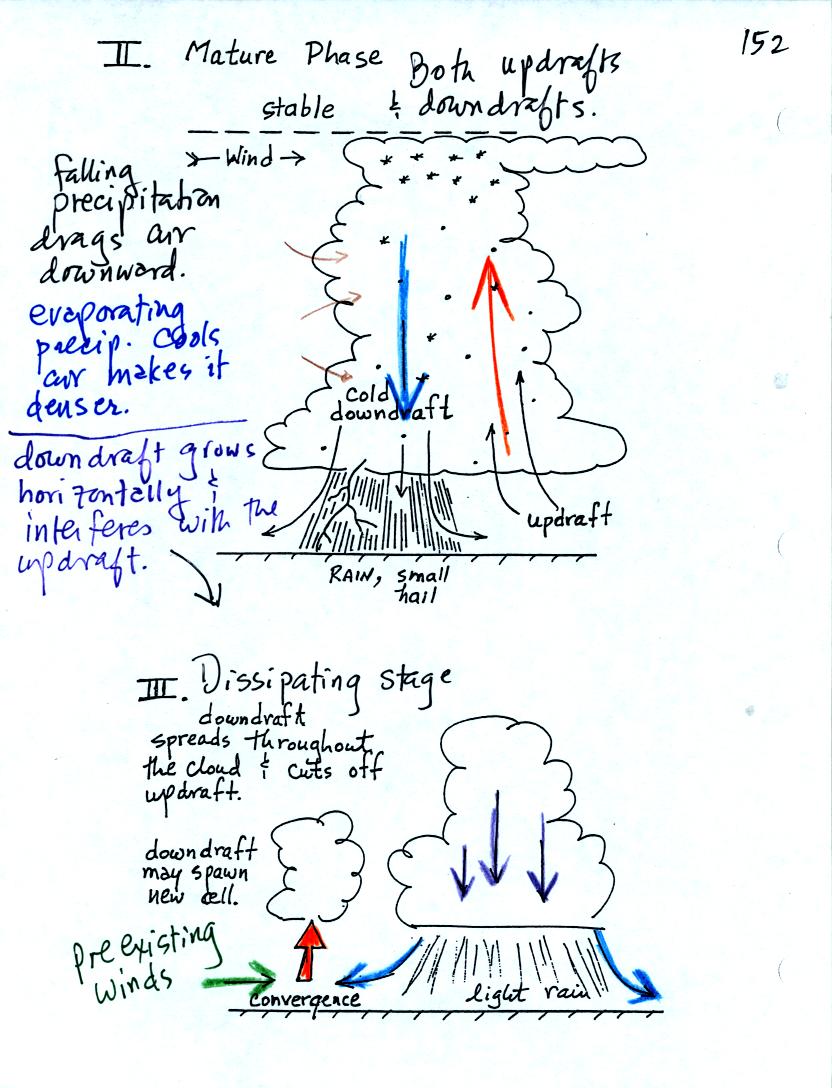
Once precipitation has formed and grown to a certain size,
it will
begin to fall and drag air downward with it. This is the
beginning of the
mature stage where you find both an updraft and a downdraft inside the
cloud. The falling precipitation will also pull in dry air from
outside the thunderstorm (this is called entrainment).
Precipitation will mix with this drier air and evaporate. The
evaporation will strengthen the downdraft (the
evaporation cools the air and makes it more dense). The
thunderstorm is strongest in the mature stage.
Eventually the downdraft spreads throughout the inside of the cloud and
interferes with or cuts off the updraft. This marks the beginning
of the end for this thunderstorm. In the dissipating stage you
would find just weak downodrafts throughout the interior of the cloud.
Note how the winds from one thunderstorm can cause a region of
convergence on one side of the original storm and can lead to the
development of new storms. Preexisting winds refers to winds that
were blowing before the thunderstorm even formed.
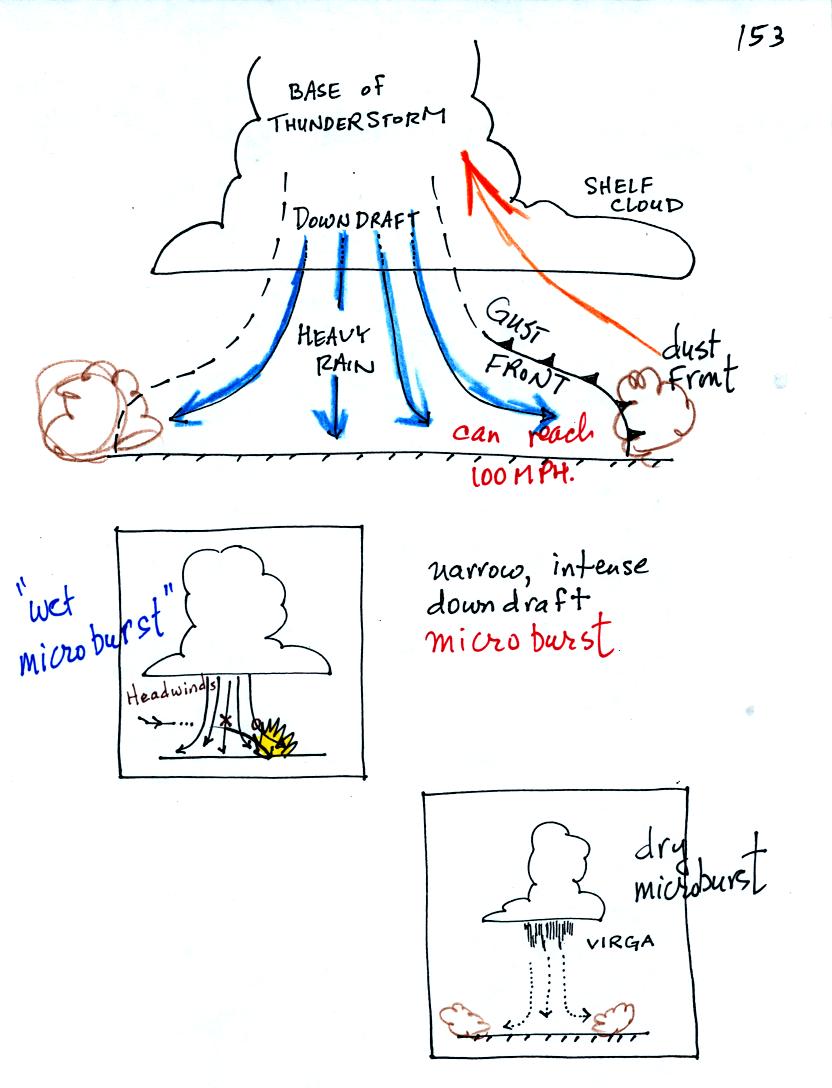
We have talked about most of the features in the top picture
before. The dust storms that thunderstorms stir up can cause a
sudden drop in visibility and are a serious risk to automobile traffic
on the interstate highway.
A narrow intense downdraft is called a microburst. At the ground
microburst winds will sometimes reach 100 MPH (over a limited area);
most tornadoes have winds of 100
MPH or less. Microburst winds can damage homes, uproot trees and
will sometimes blow over a line of electric power poles usually at
least once during our summer thunderstorm season. Microbursts are
a serious threat to aircraft especially when they are close to the
ground during landing or takeoff (see Fig. 10.10 in the text).
Falling rain could warn of a (wet)
microburst.
In other cases, dangerous (dry) microburst winds might be invisible
(the virga, evaporating rain, will cool the air, make the air more
dense, and the downdraft winds will strengthen).
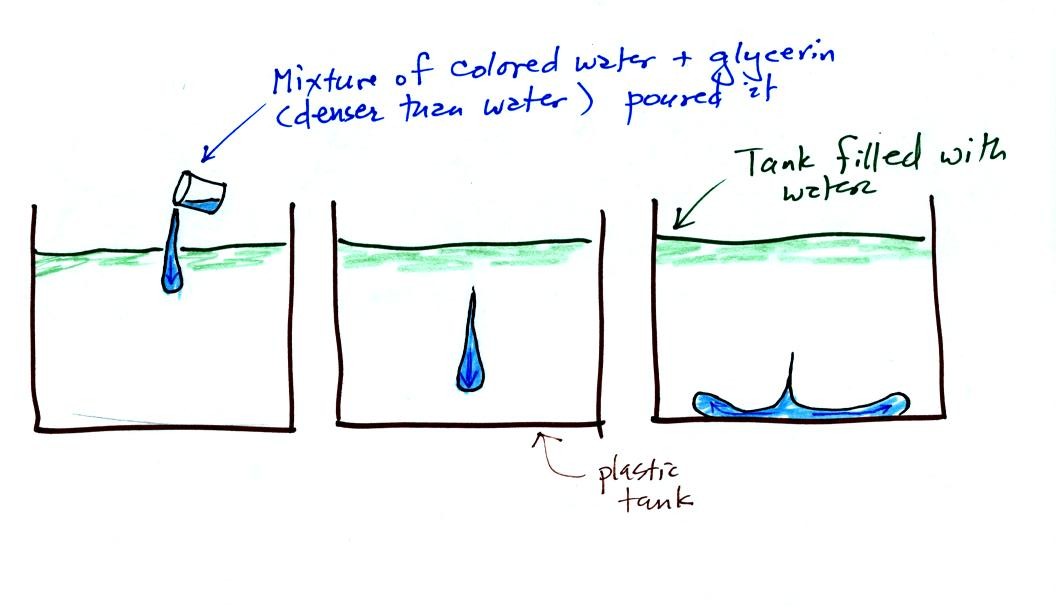
A simple demonstration gives you an idea of what a microburst might
look like. A large plastic tank is filled with water, the water
represents air in the atmosphere. Then some colored liquid that
is a little denser than water is poured into the tank. This
represents the cold dense air in a thunderstorm downdraft. The
colored liquid sinks to the bottom of the tank and then spreads out
horizontally. In the atmosphere the cold downdraft air hits the
ground and spreads out horizontally. These are the strong
microburst winds that can reach 100 MPH.
The demonstration was followed with a short time lapse video showing a
microburst that occured over the Santa Catalina mountains. Cold
air and rain suddenly fell out of a thunderstorm sank to the ground and
then spread out sideways. The surface winds could well have been
strong enough to blow down a tree or two.

Note how the winds are increasing in speed with increasing
altitude. This is vertical wind shear (changing wind direction
with altitude is also wind shear).
The thunderstorm is moving more quickly to the right than the air
next to the ground. The thunderstorm will move to the right more
rapidly than the air in the thunderstorm updraft which originates at
the ground. Rising air that is situated at the front bottom edge
of the thunderstorm will find itself at the back edge of the storm when
it reaches the top of the cloud. This produces a tilted
updraft.
Remember that an ordinary air mass thunderstorm will begin to dissipate
when the downdraft grows horizontally and cuts off the updraft.
In a severe storm the updraft is continually
moving to the right and staying out of the downdraft's way.
Severe thunderstorms can get bigger, stronger, and last longer than
ordinary air mass thunderstorms.
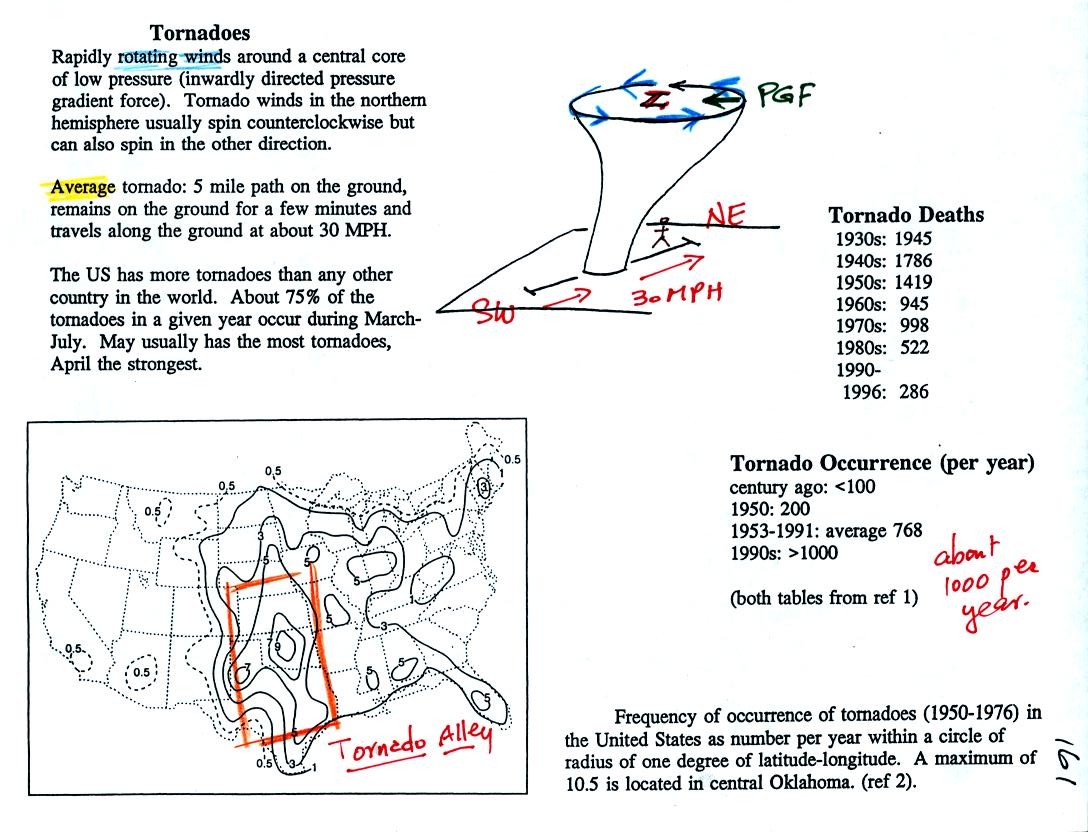
This gives some general information about tornadoes. Most
tornadoes last only a few minutes and leave a path a few miles long on
the ground. There are of course exceptions. One is
discussed below.
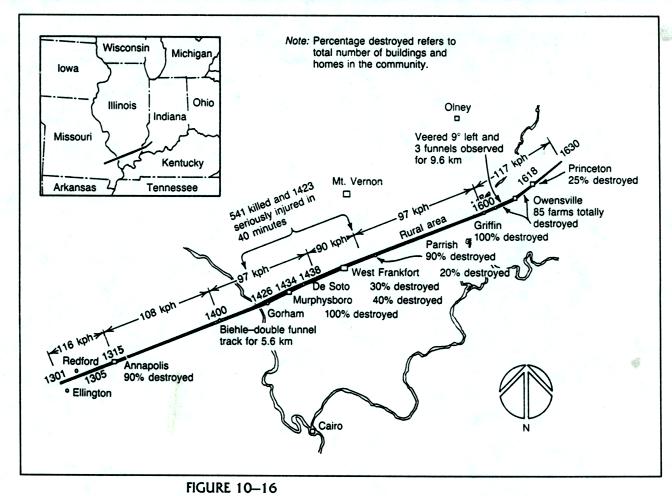
The path of the 1925 "Tri-State Tornado" is shown above. The
tornado path was 219 miles long, the tornado last about 3.5 hours and
killed 695 people. It is the single deadliest tornado ever.

Tornadoes often occur in "outbreaks." Paths of 148 tornadoes
during the April 3-4, 1974 "Jumbo Tornado
Outbreak" are shown above. Note the first tornadoes were located
in the upper left corner of the map. The tornadoes were produced
by thunderstorms forming along a cold front. During this two day
period the front moved from the NW part toward the SE part of the
figure. Note that all the tornado paths have a SE toward NE
orientation.
We will go over this figure again in class on Thursday. The first
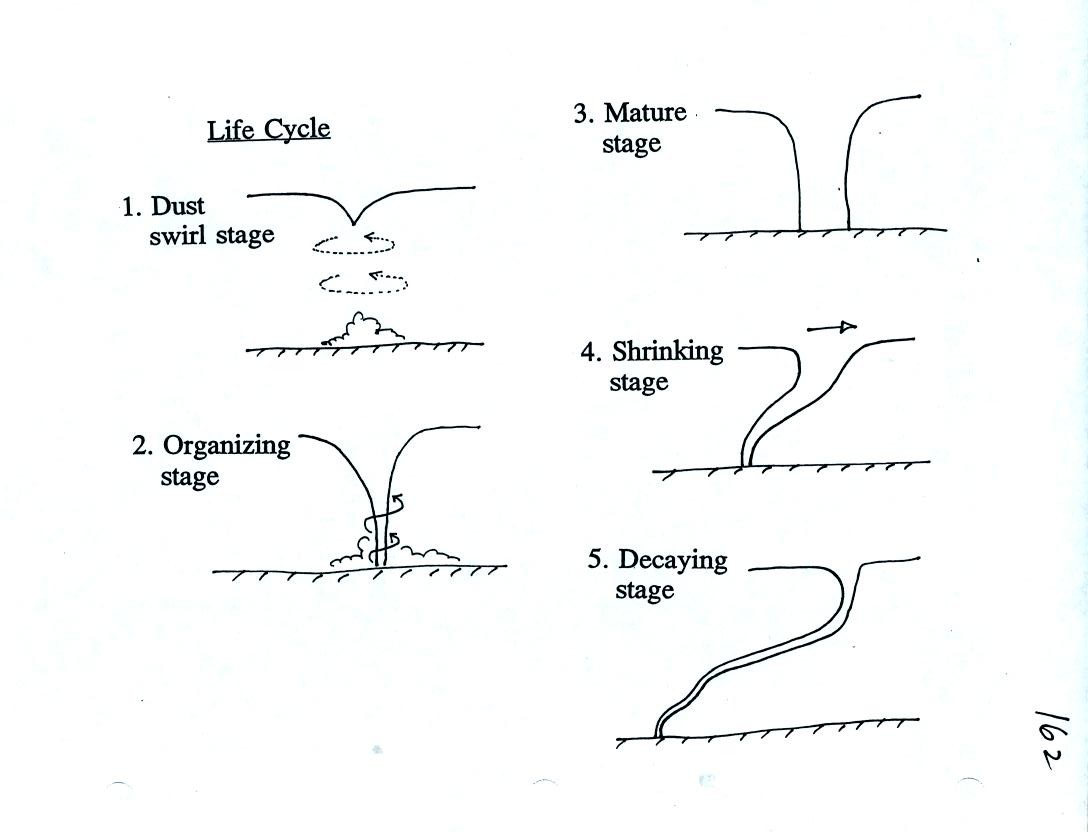
of several tornado video tapes was showed at the end of class.
This video (a tornado that formed near Luverne
Oklahoma on May 15, 1991) illustrated well the first three stages of
the tornado life cycle. The tornado was given an F3 rating.
This refers to the Fujita Scale used to rate tornado strength or
intensity. Several more tornado videos coming on Thursday.