Tue., Jan. 17, 2006
In the first few minutes of class I reviewed some information on the
evolution of the earth's atmosphere. This
material was not covered in class last Thursday but was stuck on the
end
of the Jan. 12 notes nonetheless.
Signup sheets for the experiments and book report were also circulated
through class. Names will be transferred to the online
Report Signup Lists. Experiment #1 materials were distributed
in class.
We'll
spend a couple of class periods covering some of the principal
atmospheric pollutants. We started today with sulfur
dioxide. You'll find sulfur dioxide discussed on pps 11-13 in the
packet of photocopied class notes.
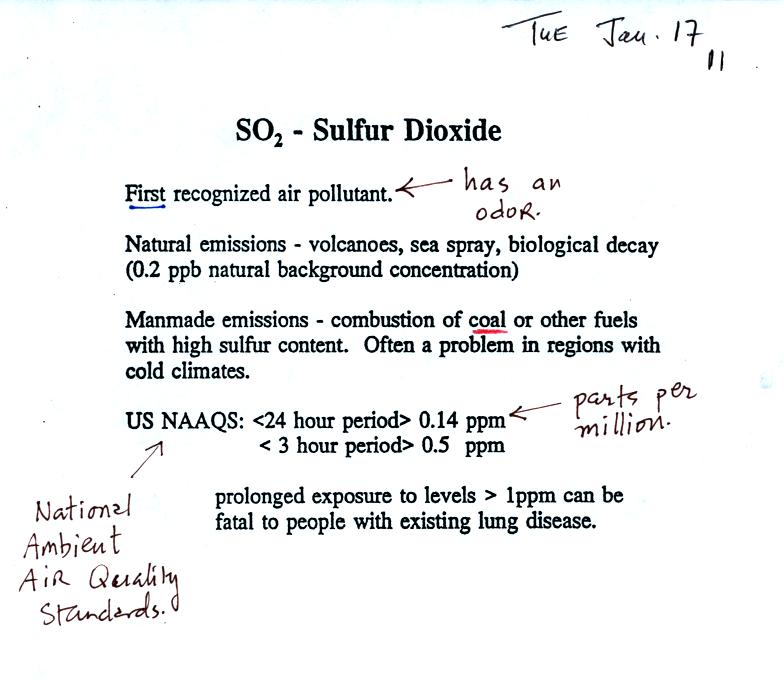
Sulfur dioxide is produced by the combustion of sulfur
containing
fuels such as coal. Combustion of fuel also produces carbon
dioxide and carbon monoxide. People probably first became aware
of sulfur dioxide because it has an unpleasant smell. Carbon
dioxide and carbon monoxide are odorless.
Sulfur dioxide concentrations lower than the National Ambient Air
Quality Standards listed above (established by the Environmental
Protection Agency) should not present a health risk. Note however
that levels of 1 ppm (part per million, one SO2 molecule
mixed in with
one million air molecules) does present a health risk to certain
people. SO2 concentration did exceed this value in
some of the
air pollution events listed in the next figure.
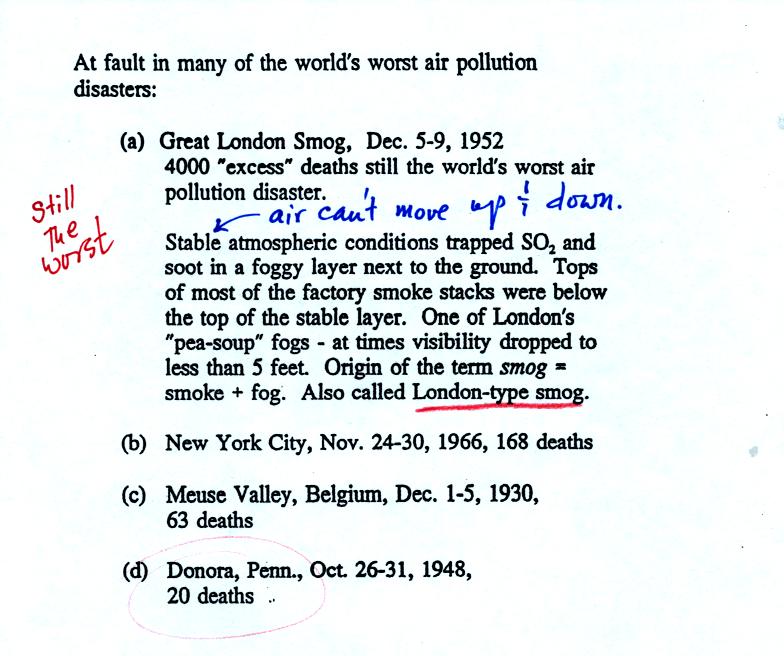
The Great London smog is still the deadliest air pollution
event in
history. A stable air layer next to the ground can't mix with
cleaner air above.
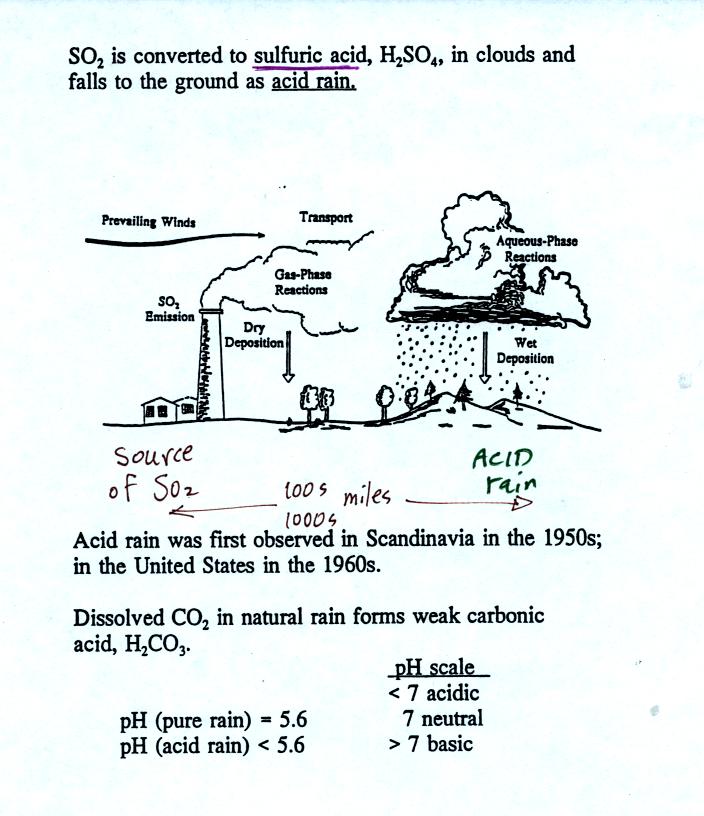
Acid rain often falls hundreds or thousands of miles away
from the
source of the SO2. Coal fired factories and electric
power plants
in the Ohio River Valley could produce acid rain in New England and
Canada. Acid rain in Scandinavia could be the result of SO2
emissions in England and Belgium.
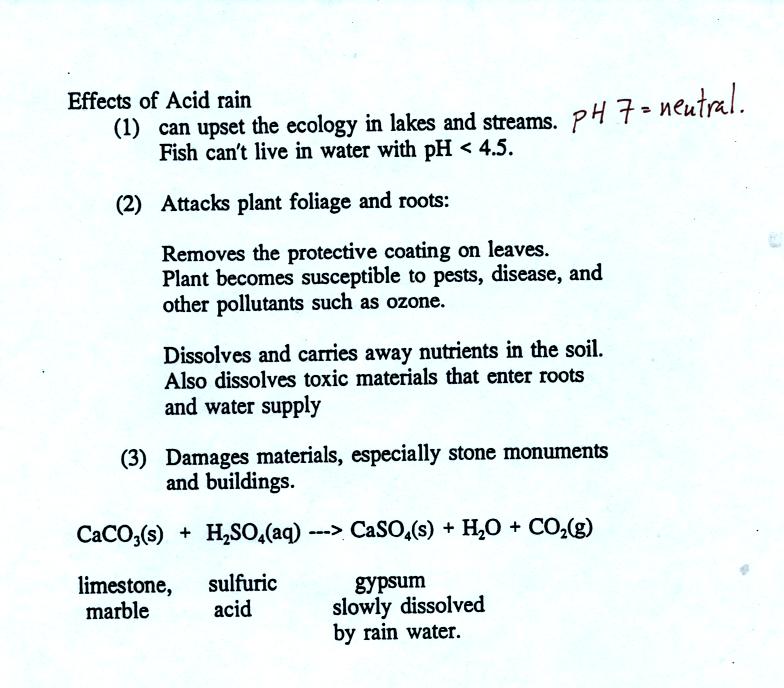
An acid rain demonstration was performed in the
last 15 minutes of class to give you a general idea of how acid rain is
produced. Carbon dioxide rather than SO2 was bubbled
through
Tucson tap water. The tap water is initially slightly basic (pH
> 7). Dissolved CO2 however turned the tap water
acidic.
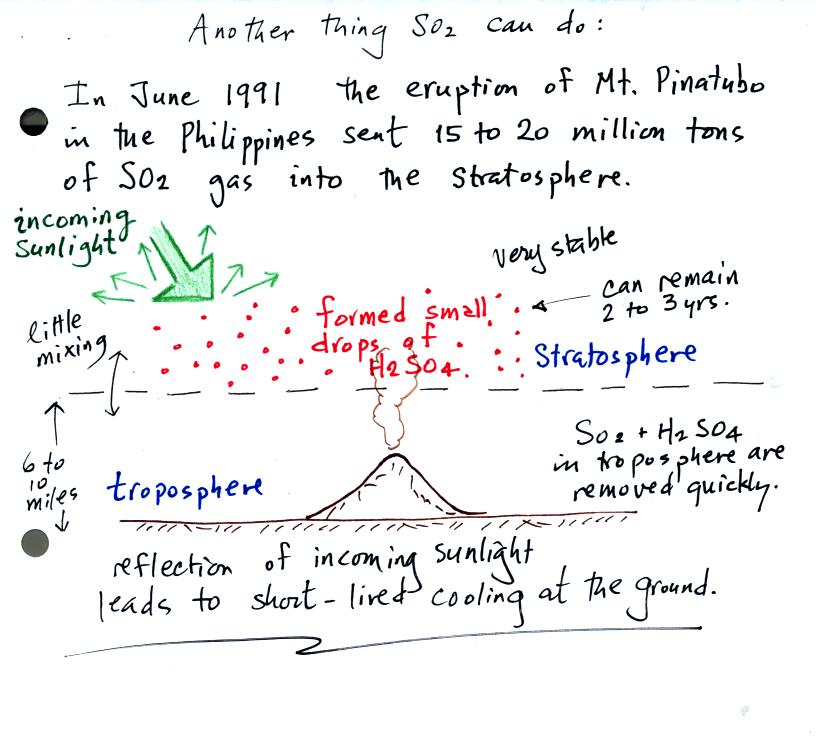
Small drops of sulfuric acid that formed in the stratosphere
following
the Mt. Pinatubo eruption reflected incoming sunlight. With less
sunlight arriving at the ground this lowered average temperatures at
the ground slightly for a period of a few years.
The acid
rain demonstration involved carbon dioxide. Carbon dioxide is an
important greenhouse gas. There is worldwide concern about
increasing atmospheric concentrations of CO2 and other
greenhouse
gases. The following figure is found on page 1 in the class notes.
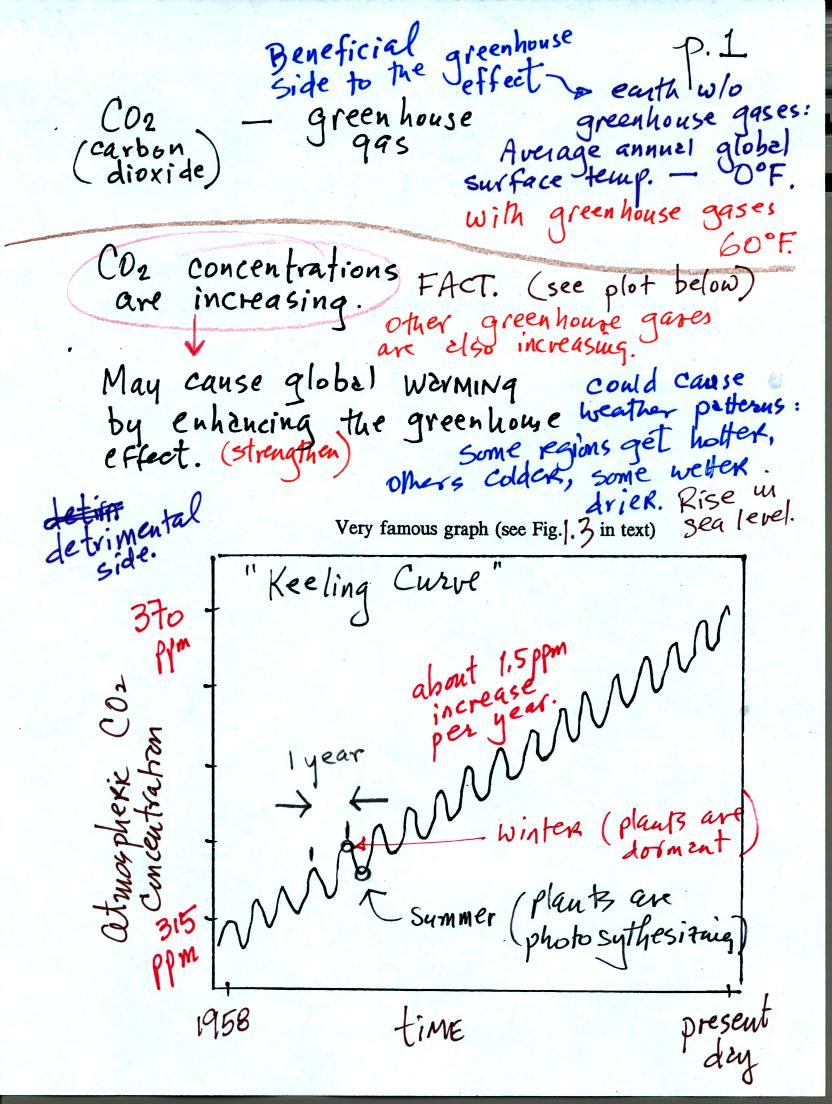
We'll cover the greenhouse effect in detail in Chapter
2.
The natural greenhouse effect raises the overall average surface
temperature on the earth. The average annual global average would
be about 0o F without greenhouse gases in the
atmosphere. With
greenhouse gases the average is a much more pleasant 60o
F. The natural greenhouse effect is beneficial
The concentration of CO2 (and other greenhouse gases) is
increasing. The Keeling curve shown above (and in Fig. 1.3 in the
text) clearly shows this. The concentration has increased from
about 315 ppm in 1958 when the measurements were started to about 370
ppm at present.
There is concern that increasing greenhouse gas concentrations may
strengthen or enhance the greenhouse effect and increase the global
average surface temperature. This could have a variety of
consequences that we will examine later.
We will first look at what is causing atmospheric CO2
concentrations to
increase. Before we do that we need to see how CO2 is
added to
and removed from the atmosphere.
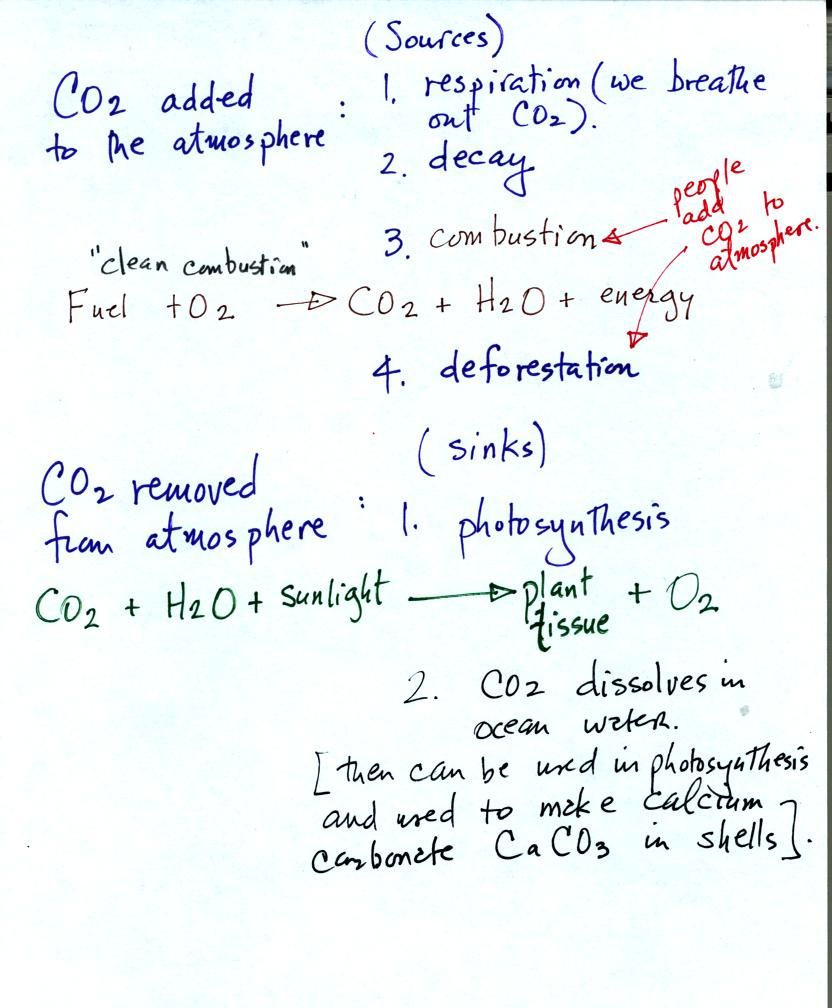
Natural processes such as respiration and decay add CO2
to
the
atmosphere. Volcanoes are an additional natural source.
Combustion and deforestation are human activities that add CO2
to the
air.
Photosynthesis removes CO2 from the air and is the main
source of
atmospheric oxygen. We saw how easily CO2 gas
dissolved in water
in the acid rain demonstration. CO2 is removed from
the
atmosphere when it dissolves in the oceans.
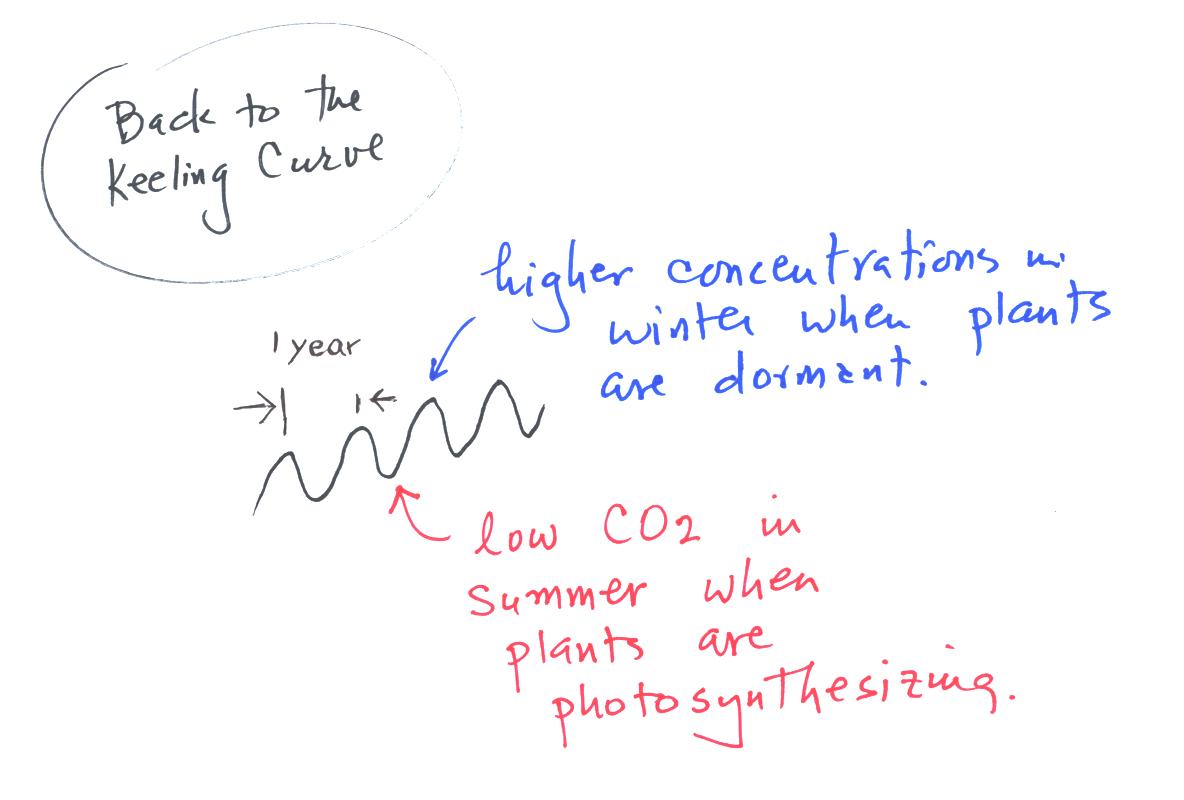
Knowing something about the sources and sinks of atmospheric CO2
we
can explain the wavy appearance in the Keeling curve. It
takes one year to complete one cycle.
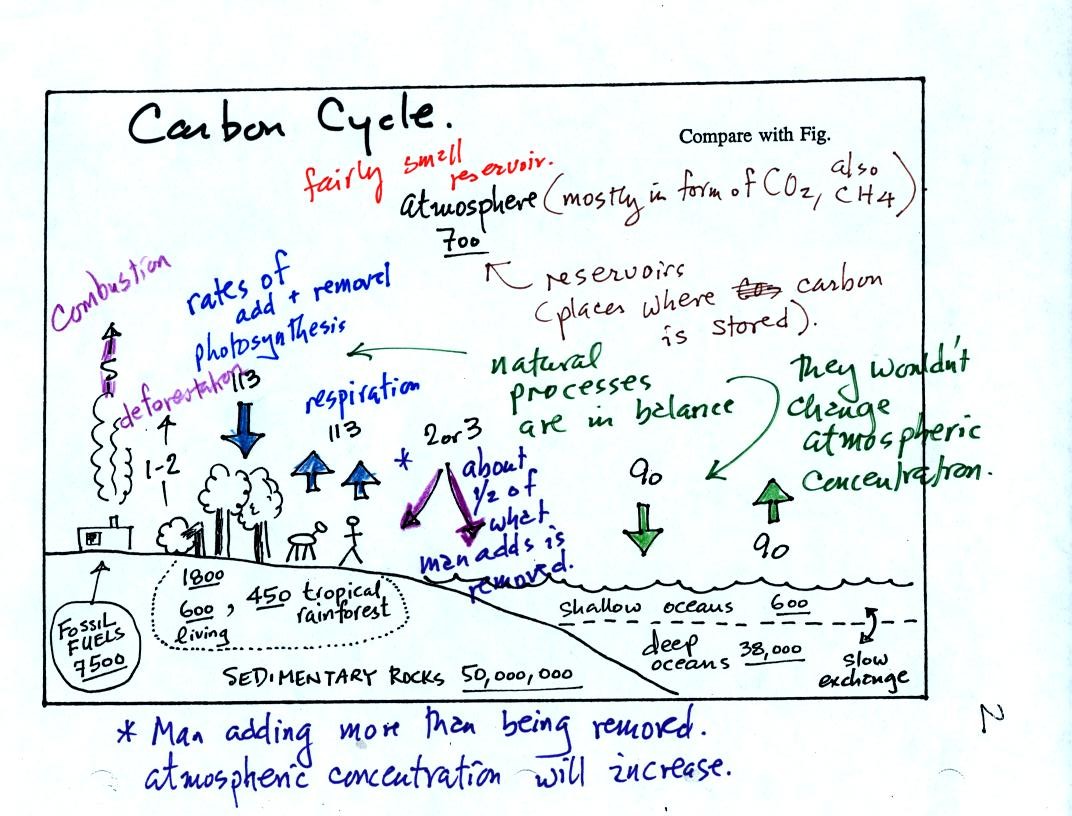
The carbon cycle shows the rates at which carbon (mostly in the form of
CO2) is added to an removed from the atmosphere. It also shows
various places where carbon is stored (underlined numbers).
The atmosphere contains only about 700 units of carbon (mostly CO2 but
also some CH4, methane). The deep oceans contain 38,000 units of
carbon, 50 million units are stored in sedimentary rock. There
are 7500 units of carbon in the form of fossil fuels waiting to be dug
up.
Natural processes such as respiration and decay add 113 units of carbon
to the atmosphere every year. 113 units are removed by
photosynthesis. The oceans add and remove 90 units of carbon per
year. Notice the natural processes are in balance - they would
not change the atmospheric CO2 concentration.
Activities of man such as burning fossil fuels and deforestation add a
total of 6 to 7 units (5 + 1 or 2 units) of CO2 to the atmosphere every
year. There is fairly small compared to the added by natural
processes, however the manmade contributions are not balanced by equal
rates of removal. About one-half of what man adds every year is
removed. Exactly how this is done is not known. It is the
imbalance that is causing atmospheric CO2 to increase.
There are 7500 units of carbon in the form of fossil fuels that will
probably be burned in the next 100 years or so. This is 7500
units of carbon that will be added to the atmosphere. You can see
that this could have a big effect on atmospheric CO2
concentration. There is a lot of research being done to try to
figure out how the atmospheric concentration will change, and also how
changing atmospheric concentration of CO2 (and other greenhouse gases)
will change climate.


