Monday Apr. 9, 2007
The Expt. #4 reports (for most people)
were returned in class today. The revised reports are due in 2
weeks, on or before Mon. Apr. 23. Please return your original
report with your revised report. If you didn't get your report
back today it means I am trying to repeat some of your measurements and
you should get your report back on Wednesday. There are several
people that haven't returned their materials or turned in a report.
Today was the 2nd and last 1S1P makeup report due date.
Wednesday this week is the 1st of the 1S1P
Assignment #3 due dates. If you plan to turn in two reports
in Assignment #3, at least one report must be turned in on Wednesday.
An optional assignment handed out in class on Friday was collected at
the beginning of the period.
Now we'll
use what we know about the pressure gradient and Coriolis forces to
determine why upper level winds blow the way they do. You
only need to worry about the PGF and CF when considering upper level
winds. When we get to surface winds we will need to include the
frictional force.
We'll start with a simple upper level contour pattern, straight
parallel contour lines. And we'll start with the analogous
situation shown at the top of p. 123 in the photocopied Class Notes.
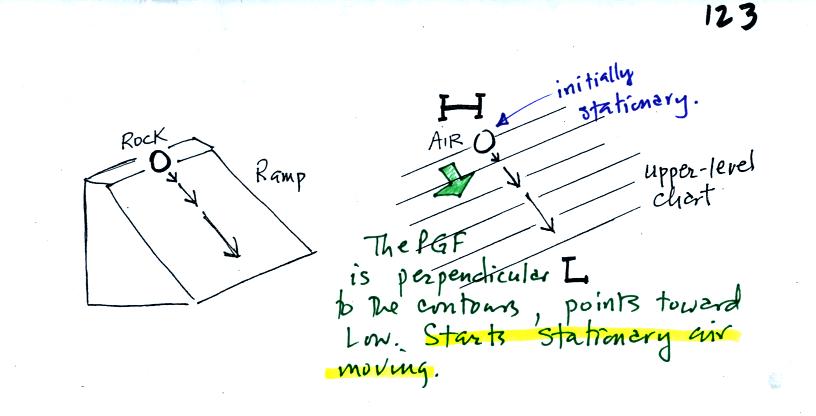
Placing a volume of air in a pressure gradient is just like putting a
rock on a ramp. The rock will begin to roll downhill. The
PGF will start the stationary air moving and cause it to move toward
low pressure. The wind will pick up speed as it goes.

On the larger weather chart at the bottom of p. 123, we
start with a
stationary volume of air at Point 1. The PGF (perpendicular to
the
contour lines and pointing toward low) will start the air moving toward
low pressure. The dots show this initial motion.
At Point 2 the air is moving and the Coriolis force appears. It
is perpendicular and to the right of the
wind. It is
weak because the wind speed is low. The CF begins to bend the
wind (it is bending to the right if you look in the direction the wind
is blowing).
The wind picks up speed and, in Points 3 and 4, the CF is getting
stronger
and the wind is continuing to bend.
At Point 5, the wind is blowing parallel to the contours, and the wind
speed is high enough that the CF is able to
balance the PGF. The net force is now zero. From this point
on the
winds will blow in a straight line at constant speed parallel to the
contour lines. This is known as a geostropic wind or geostrophic
flow.
Some more
examples from p. 124 in the photocopied Class Notes.
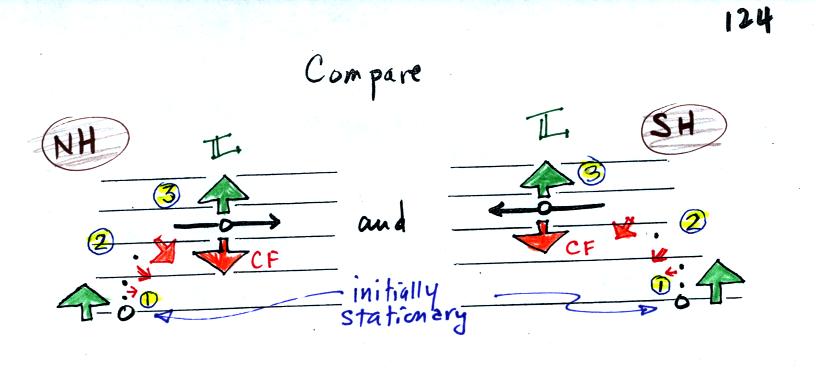
Some air is placed
at Point
1 in the two figures above. The
PGF force
starts the stationary air moving (the dots show the direction of this
initial motion). Low pressure would be found at the top
of both maps in this figure. Then if we watch the motion
carefully we see the
air
beginning to turn to the right at Point 2 in the left figure and
turning to the left in the right hand figure. This is caused by
the
Coriolis force. The CF is to the right of the wind in the left
figure, this is a northern hemisphere (NH) chart. The CF is to
the left of the wind in the right figure, this is a southern hemisphere
(SH) chart.
The CF and PGF again balance by the time you get to Point 3.
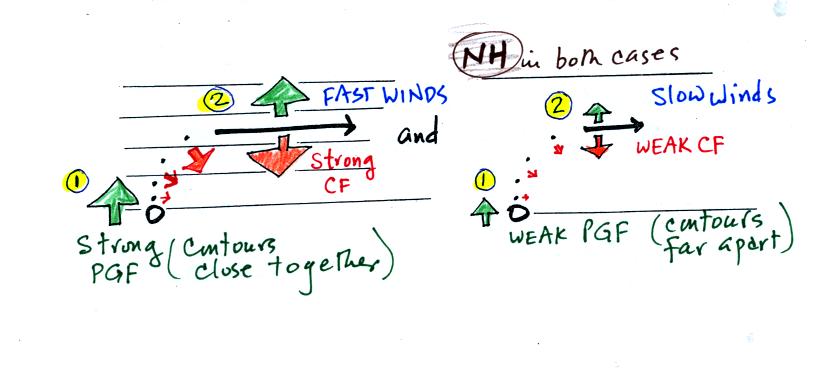
The two figures above (middle of p. 124) show maps
with strong and weak pressure
gradients. The wind in the left figure ends up blowing much
faster
than the wind in the right figure (much as a rock would roll quickly
down a steep ramp and slowly down a more gradual slope). The fast
wind
in the left figure produces a strong Coriolis force that is eventually
able to balance
the strong PGF. The slow winds at right produce a weaker
CF. The CF is to the right of the wind in both examples, so these
are both in the northern hemisphere.
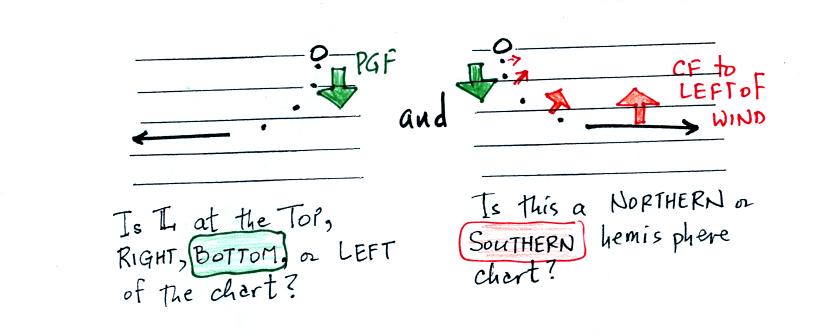
In the left figure the direction of the initial motion (the
dots) is toward the bottom of the figure. The initial motion is
caused
by the PGF. The PGF points toward low pressure at the bottom of
the
chart.
In the right figure the wind takes a left turn once it
begins
to blow (turn the page upside down so you are looking in the direction
the wind is
blowing). That identifies this as a southern hemisphere chart.
Now we'll
look at upper level circular centers of low and high pressure.
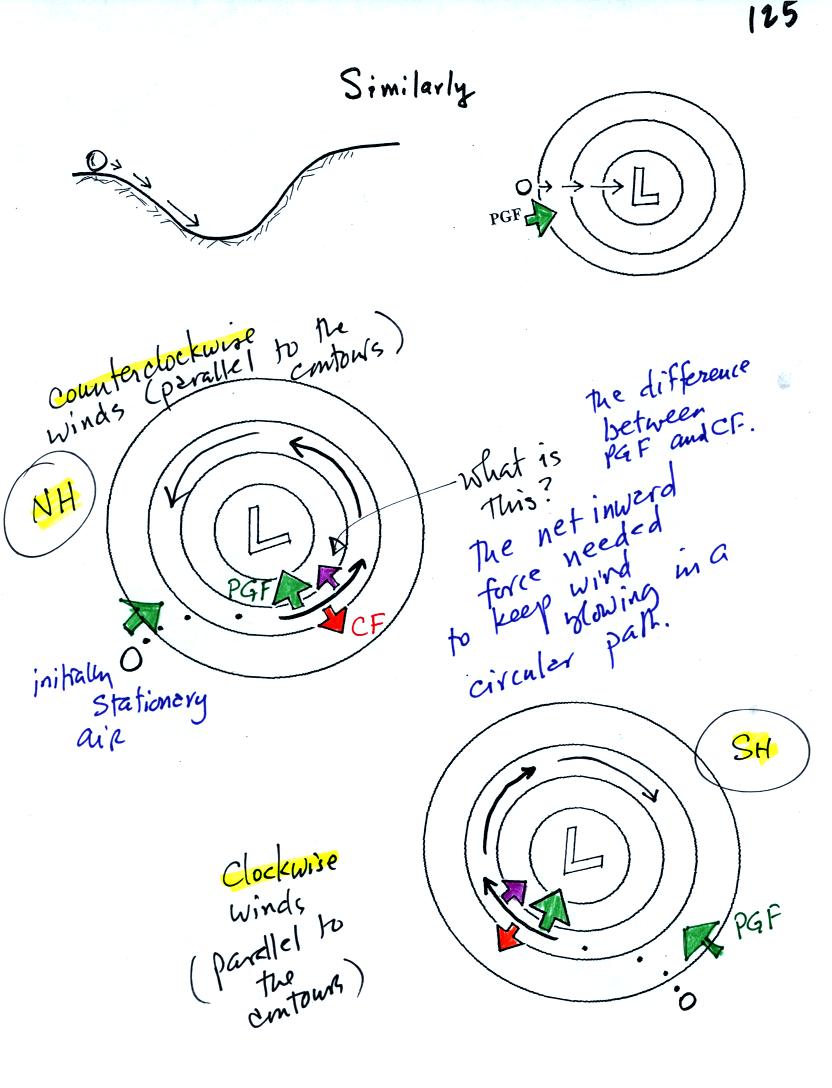
The rock rolling down a hill vs air moving in a pressure
gradient
analogy is shown again at the top of the figure.
By now you should be understanding what is shown in the bottom two
figures. The dots tell you the direction of the
initial motion. They tell you the direction of the PGF, inward
toward low pressure in both these figures.
In the middle figure
the wind takes a right turn (identifying this as a northern hemisphere
chart) and eventually ends up blowing parallel to the contour lines in
a counterclockwise direction.
In the bottom figure the wind turns to the left and ends up blowing
parallel to the contour lines in a clockwise direction. The CF
points to the left of the wind in this figure, this is a southern
hemisphere chart.
Note in both charts that the PGF and the CF point in
opposite directions but they are no longer equal in strength. The
inward point PGF is stronger than the outward CF. The difference
provides the net inward force (the purple arrow) needed to keep the
wind blowing in a
circular path.
Because of the Coriolis force, winds blow counterclockwise around low
pressure in the NH and clockwise around low in the SH.
Here's
what happens with upper level high pressure centers.
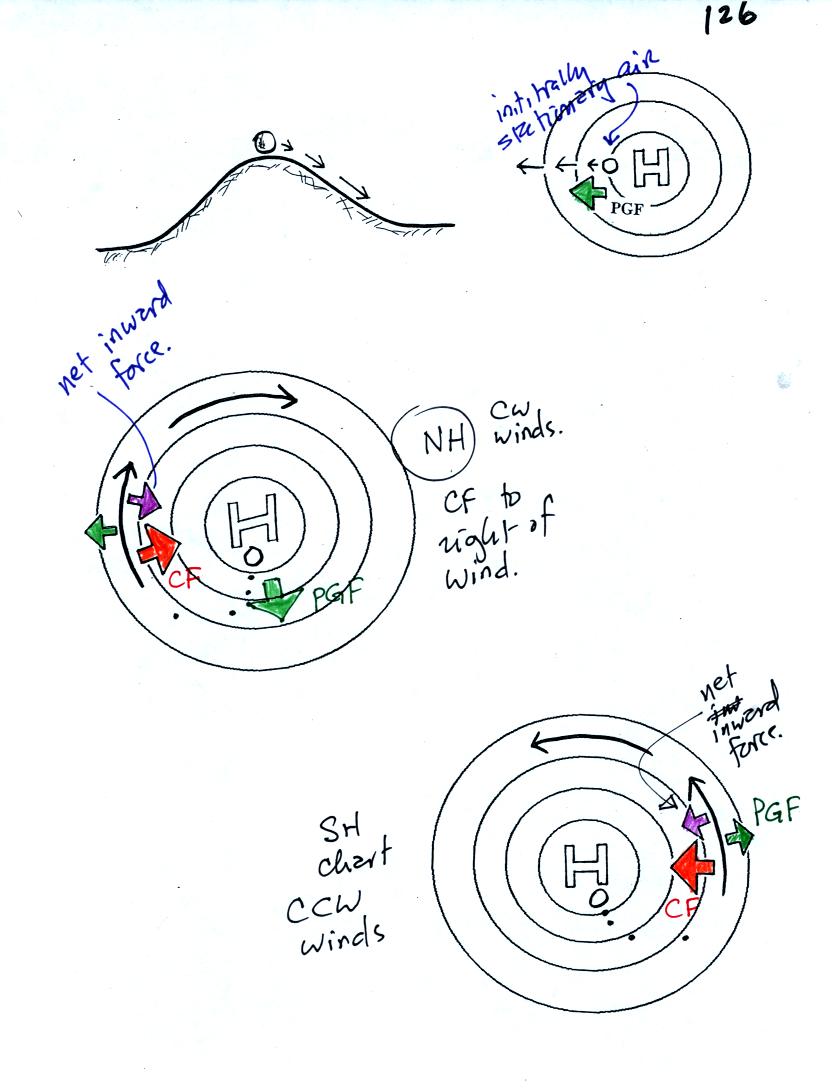
The initially stationary
air begins to move outward and away from the high pressure in the
center (the dots show this initial motion).
In the middle figure the CF is to the right of the wind. This is
a northern hemisphere map. Winds blow parallel to the contours
and spin clockwise around high in the northern hemisphere.
The winds blow parallel to the contours and in a counterclockwise
direction around circular centers of high pressure in the southern
hemisphere.
Note the net force is inward in both cases.
Now before
you get the idea that all winds change directions in the NH and SH
we'll look at the next figure.
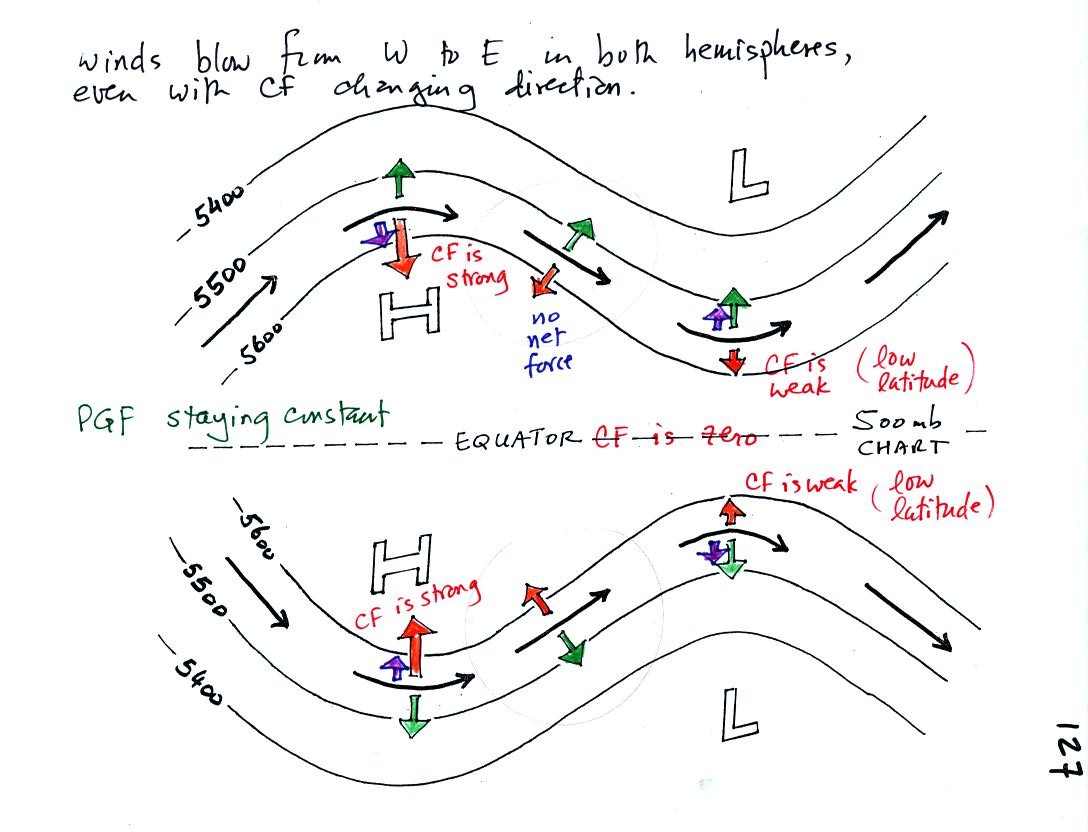
The winds are blowing from west to east in both hemispheres
even though
the CF changes directions in the NH and SH. How is this
possible. If you look closely you will notice that the pressure
pattern is also "flipped." Low pressure is found at the top of
the map in the NH and at the bottom of the chart in the SH. The
direction of the CF changes directions in the NH and SH hemisphere, the
PGF also charnges directions and the winds blow in the same direction.
The spacing of the contour lines and the strength of the PGF stays
about constant on this chart. If you look closely at the figure
you will notice that the CF force is
sometimes stronger and sometimes weaker than
the PGF. This changing imbalance results in a net force needed
for the right and left
turns that the winds take as they blow through this pattern. If
you remember that the strength of the CF depends on latitude (as well
as wind speed) you can understand why the CF changes strength.
The CF is strongest when the winds are far from the equator, weakest
when the winds are close to the equator.