Friday, Apr. 13, 2007
Revised Expt. #3 reports are due next Monday, Apr. 16. Please
return your original report with your revised report. The 2nd
1S1P Assignment #3 due date is next Wednesday Apr. 18.
Today
we'll
apply the thermal circulation concept to the earth as a whole.
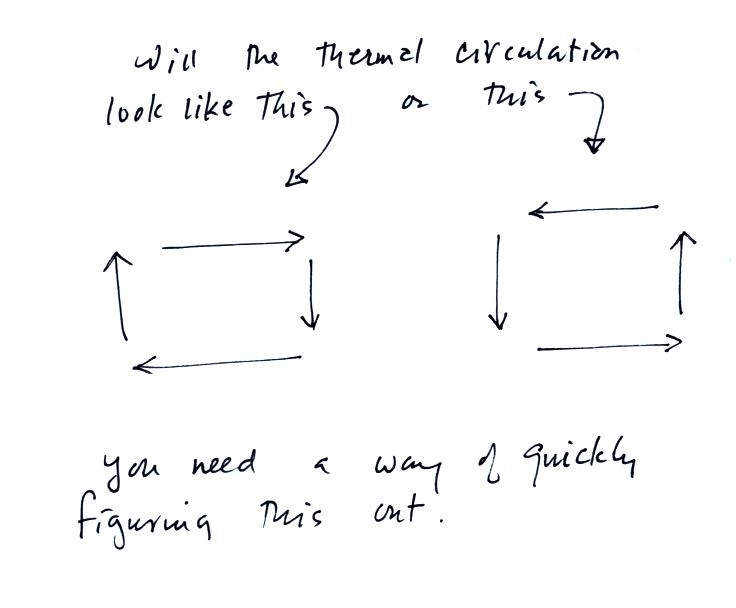
Before doing that however, if you were given the temperature pattern
below
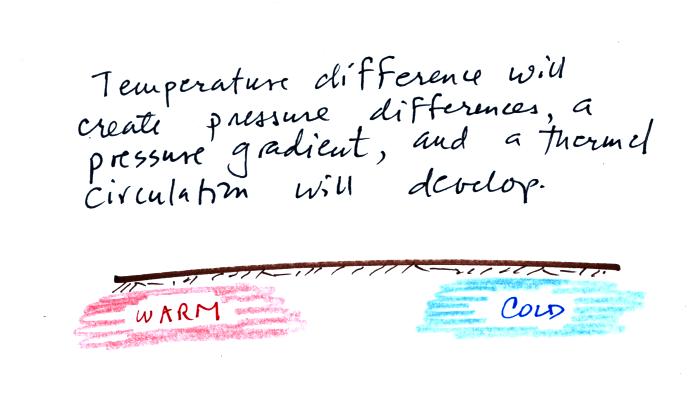
could you determine which direction the thermal circulation would
blow?
One suggestion: remember that warm air rises, draw an arrow
representing rising air in the warm part of the figure.
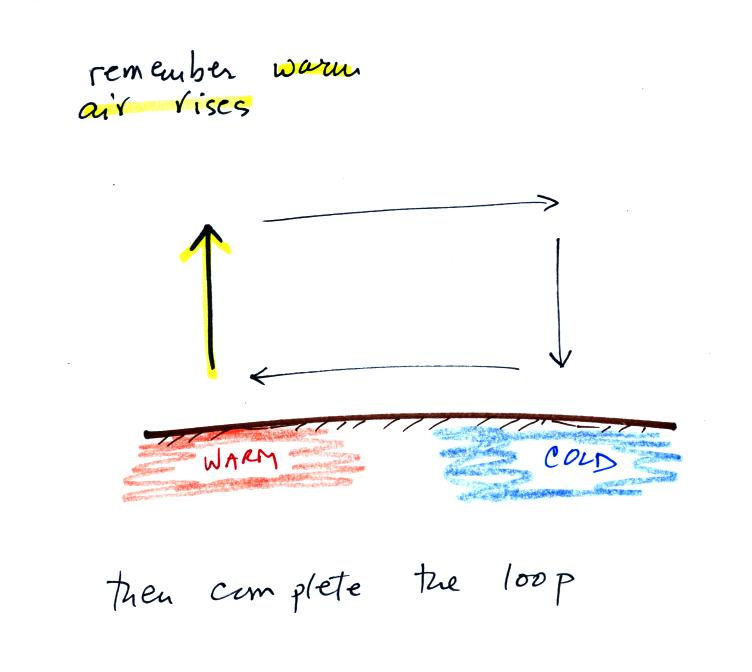
Then draw additional arrows to complete the loop.
Now we'll
apply the thermal circulation to the global scale and try to learn
something about global scale pressure and wind patterns on the
earth. Ordinarily you couldn't apply a small scale phenomena like
a thermal circulation to the much larger global scale. However if
we make some simplifying assumptions, particularly if we assume that
the earth doesn't rotate or only rotates slowly, we can ignore the
Coriolis force.
Some additional simplifications are also made and are listed below.
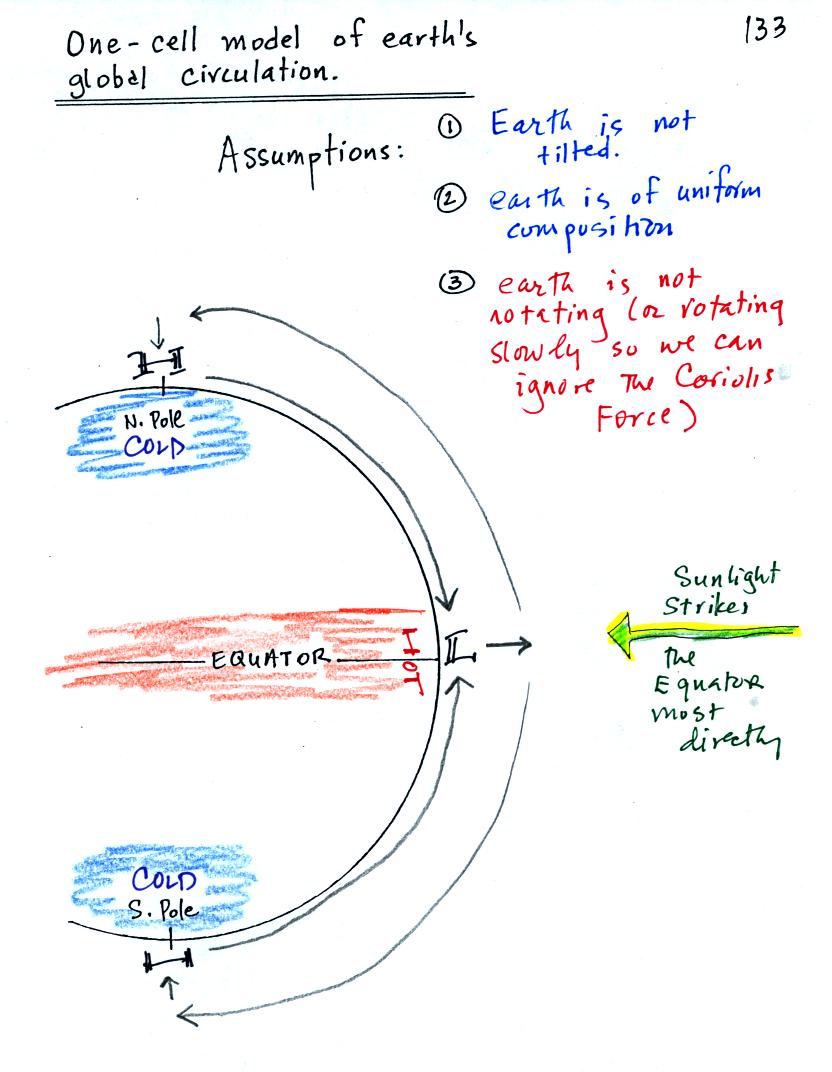
The incoming sunlight shines on the earth most directly at
the
equator. The equator will become hotter than the poles. By
allowing the earth to rotate slowly we spread this warmth out along the
entire length of the equator rather than concentrating it in a spot on
the side of the earth facing the sun.
You can see the wind
circulation pattern that would develop. The term one cell
just means there is one complete
loop
in the northern hemisphere and another in the southern hemisphere.
Next we will remove the assumption concerning the rotation of the
earth. We won't be able to ignore the Coriolis force now.
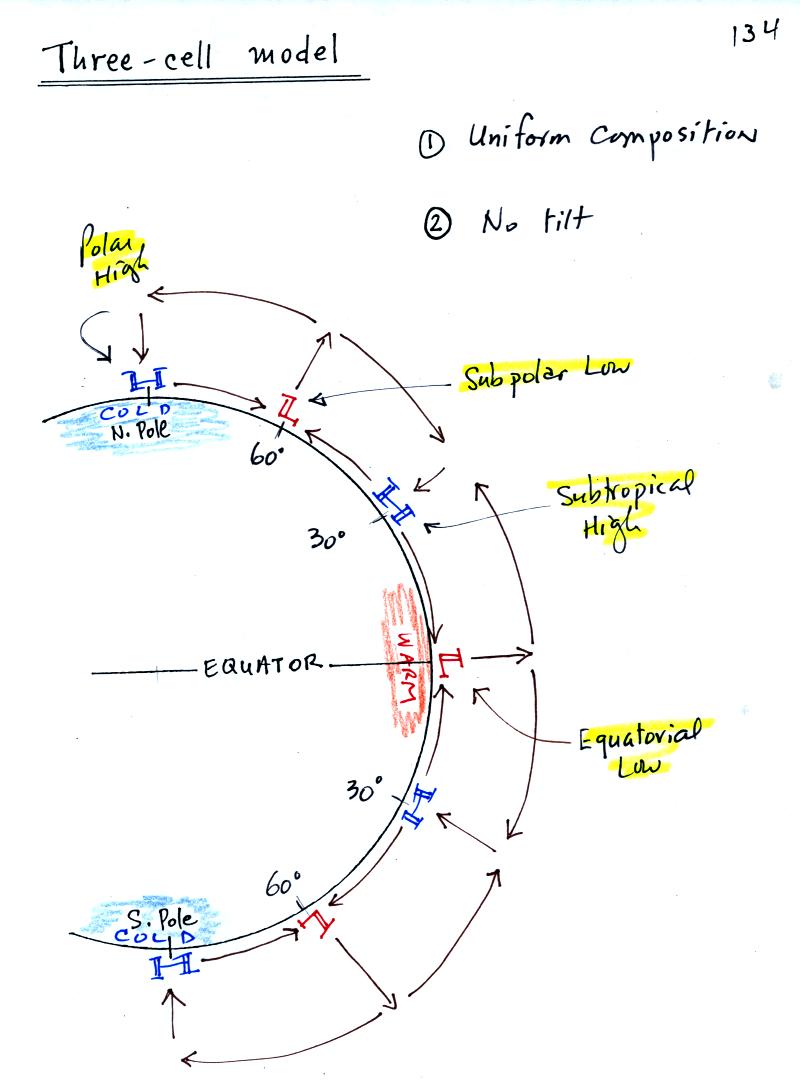
Here's what a computer would predict you would now see on
the earth. Things are pretty much the same at the equator in the
three cell and one cell models: low pressure and rising air. At
upper levels the winds begin to blow from the equator toward the
poles. Once headed toward the poles the upper
level winds are deflected by the Coriolis force.
There end up being three closed loops in the northern and in the
southern hemispheres. There are belts of low pressure
at the equator (equatorial low)
and at 60 degrees latitude (subpolar
low). There are belts of high pressure (subtropical high) at 30
latitude and high pressure centers at the two poles (polar highs).
We will look at the surface features in a little more detail because
some of what is predicted, even with the unrealistic assumptions, is
actually found on the earth.
We'll first look at surface pressures and winds on the earth from 30 S
to 30 N.
Then we'll look at the region from 30 N to 60 N, where most of the
US is located.
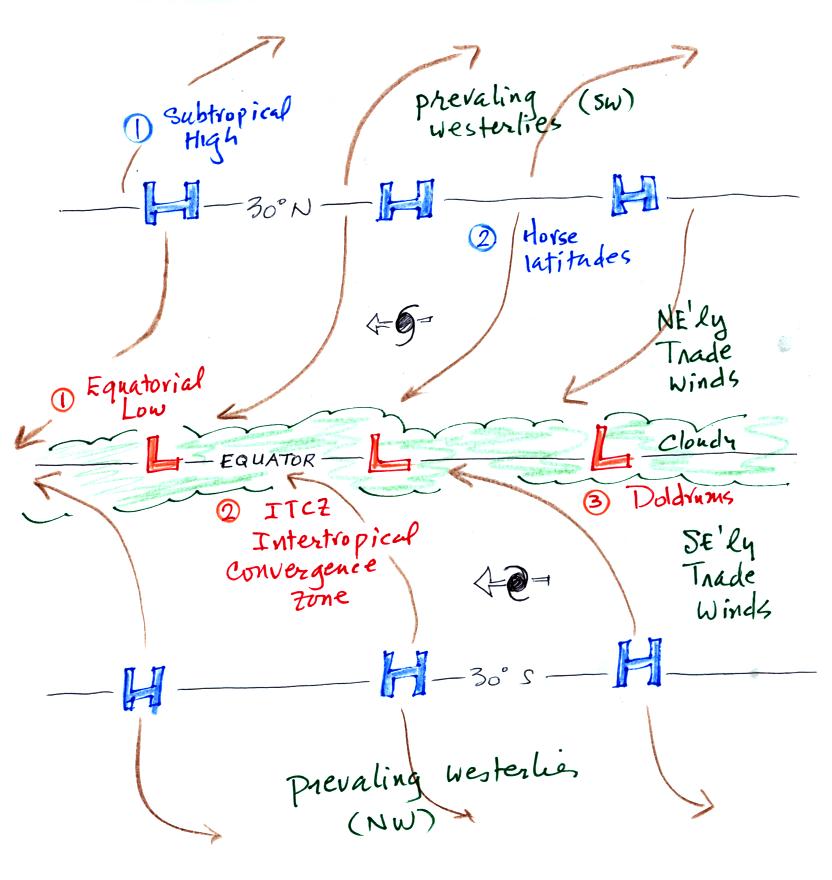
This is the first map. Let's start at 30 S.
Winds will begin to
blow from High pressure at 30 S toward Low pressure at the
equator. Once the winds start to blow they will turn to the left
because of the Coriolis force. Winds blow from 30 N toward the
equator and turn to the right in the northern hemisphere (you need to
turn the page upside down and look in the direction the winds are
blowing). These are the Trade
Winds. They converge at the
equator and the air there rises (refer back to the crossectional view
of the 3-cell model). This is the cause of the band of clouds that you
can often see at or near the equator on a satellite photograph.
The Intertropical Convergence Zone or ITCZ is another name for the
equatorial low pressure belt. This region is
also referred to as the doldrums because it is a region where surface
winds are often weak. Sailing ships would sometimes get stranded
there hundreds of miles from land. Fortunately
it is a cloudy and
rainy region so the sailors wouldn't run out of drinking water.
Hurricanes form over warm ocean water in the subtropics between the
equator and 30
latitude. Winds at these latitudes have a strong easterly
component and hurricanes, at least early in their development, move
from east to west. Middle latitude storms found between 30 and 60
latitude, where the prevailing westerly
wind belt is found, move from
west to east.
You find sinking air, clear skies, and weak surface winds associated
with the subtropical high pressure belt. This is also known as
the horse latitudes. Sailing ships could become stranded there
also. Horses were apparently either thrown overboard (to conserve
drinking water) or eaten if food supplies were running low. Note
that sinking air is associated with the subtropical high pressure belt
so this is a region on the earth where skies are
clear (Tucson is
located at 32 N latitude, so we are affected by the subtropical high
pressure belt).
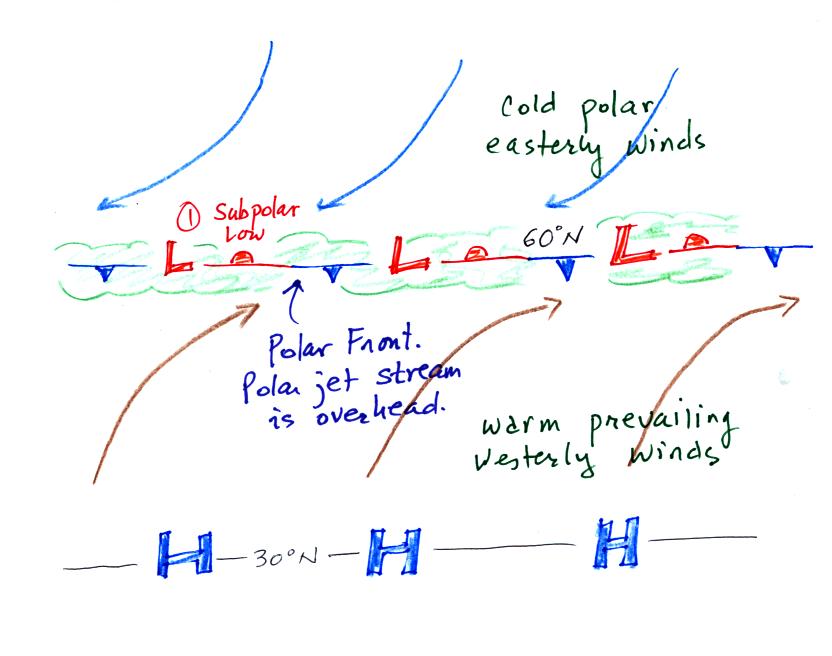
Here's the other map, it's a little simpler. Winds
blowing north from H
pressure at 30 N toward Low pressure at 60 N turn to the right and blow
from the SW. These are called the "prevailing westerlies."
In the southern hemisphere the prevailing westerlies blow from
the northwest. The 30 S to 60 S latitude belt in the southern
hemisphere is mostly ocean. The prevailing westerlies there can
get strong, especially in the winter. They are sometimes referred
to as the "roaring 40s" or the "ferocious 50s."
The subpolar low pressure belt is found at 60
latitude. Note this
is also a convergence zone where the cold polar easterly winds and the
warmer prevailing westerly winds meet. The boundary between these
two different kinds of air is called the polar front and is often drawn
as a stationary front on weather maps. A strong current of winds
called the polar jet stream is found overhead. Middle
latitude storms will often form along the polar front.
Despite
the simplifying assumptions in the 3-cell model, some of the features
that it predicts (particularly at the surface) are found in the real
world. This is illustrated in the
next figure.
Neither of the next two figures
was shown in class on Friday.
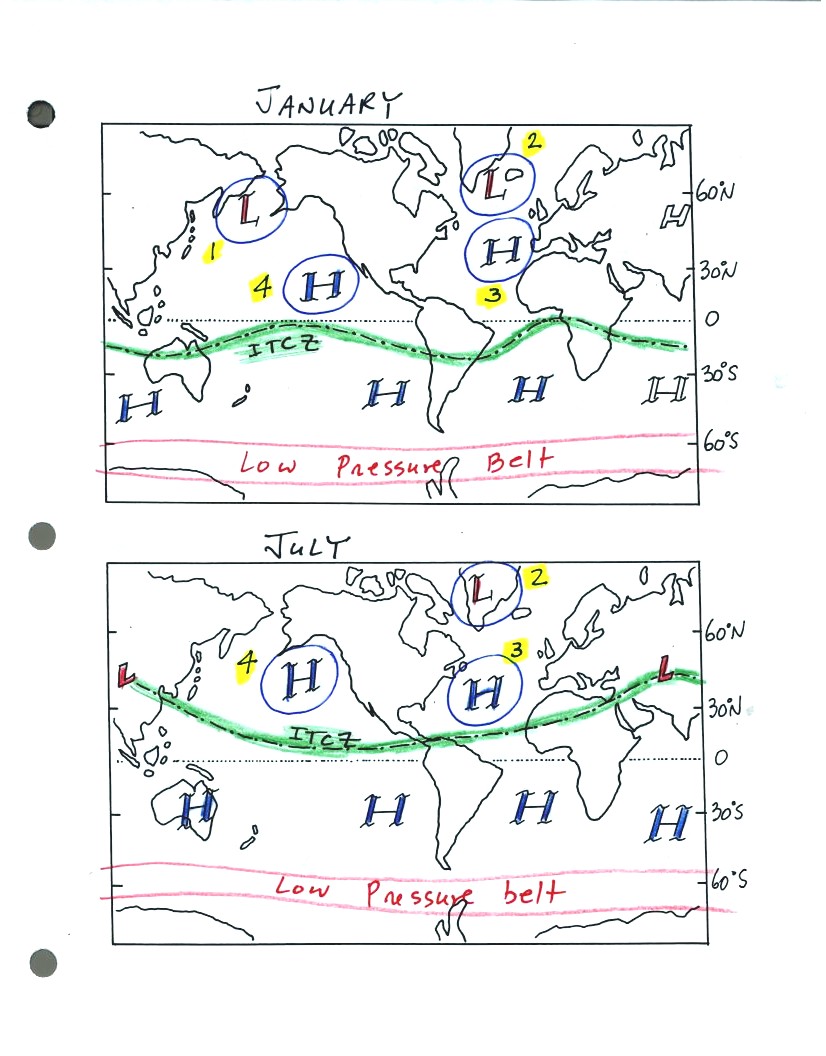
The 3-cell model predicts subtropical belts of high
pressure near
30
latitude. What we really find are large circular centers of high
pressure. In the northern hemisphere the Bermuda high is found
off the east coast of the US (feature 3 in the figure), the Pacific
high (feature 4) is positioned
off the
west coast. Circular low pressure centers, the Icelandic (feature
2) and
Aleutian low (feature 1), are found near 60 N. In the southern
hemisphere you
mostly just find ocean near 60 S latitude. In this part of the
globe the assumption of the earth being of uniform composition is
satisfied and a true subpolar low
pressure belt as predicted by the 3-cell model is found near 60 S
latitude.
The equatorial low or IRCZ is shown in green. Notice how it moves
north (when the north pole is tilted toward the sun) and south of the
equator (when the north pole is tilted away from the sun) at different
times of the year.
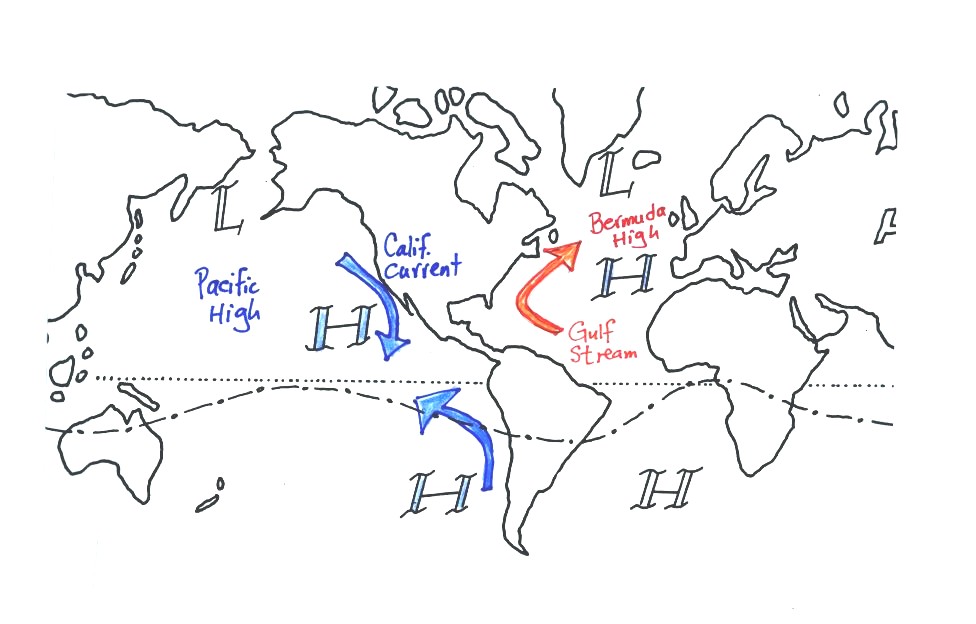
The winds that blow around these large scale high and low pressure
centers create the major ocean currents of the world. If you
remember that high pressure is positioned off the east and west coast
of the US, and that winds blow clockwise around high in the northern
hemisphere, you can determine the directions of the ocean currents
flowing off the east and west coasts of the US. The Gulf Stream
is a warm current that flows from south to north along the east coast,
the California current flows from north to south along the west coast
and is a cold current. A cold current is also found along the
west coast of South America (a disruption of this current often signals
the beginning of an El Nino event); winds blow counterclockwise around
high in
the southern hemisphere. These currents are shown in the enlargement
below.