Monday Feb. 5, 2007
The 1S1P Assignment #1 reports and the Expt. #1
reports were collected today.
Experiment #2 materials will be distributed
this week.
At the end
of class last Friday we had just drawn some isobars (pressure contours)
on a surface weather map and located centers of Low and High
pressure. The first thing we will do today is to learn what
weather conditions you might expect to find in the vicinity of these
Highs
and Lows.
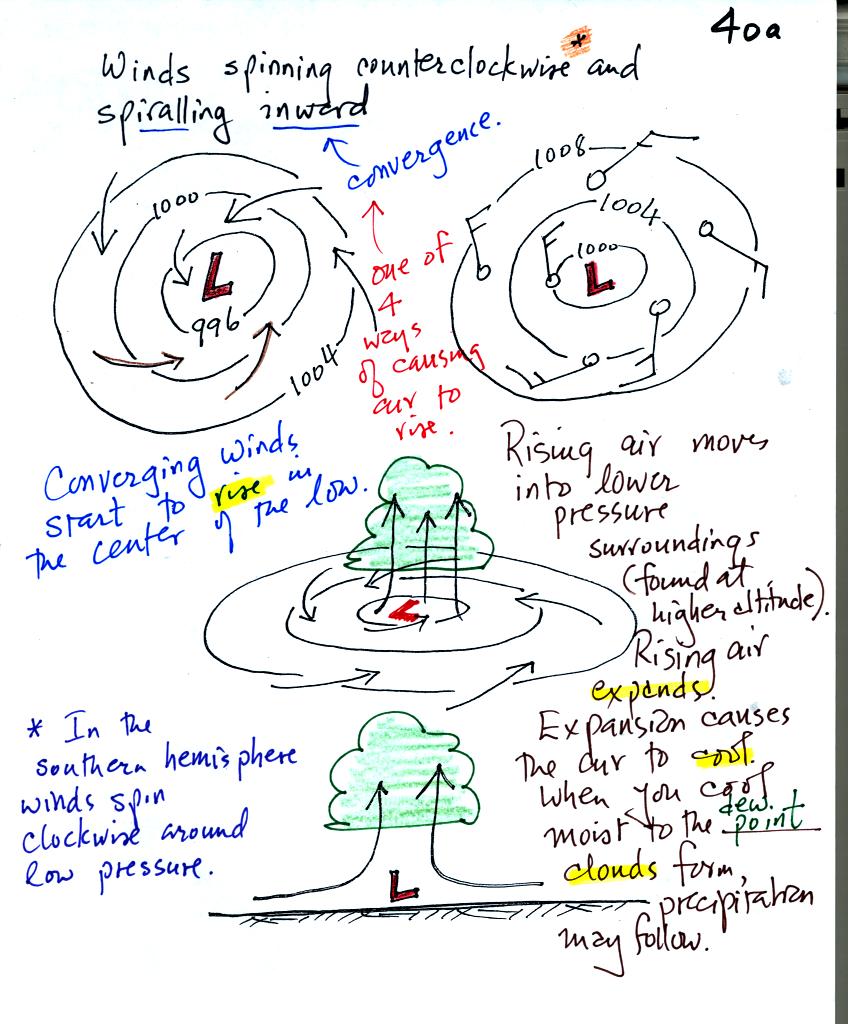
A pressure difference will first start air moving toward low
pressure. Then something called the Coriolis force will cause the
wind to start to spin (we'll learn more about the Coriolis force in
Chapter 6). Winds spin in a counterclockwise direction around surface
low pressure
centers. The winds also spiral inward toward the center of the
low, this is called convergence. [winds spin clockwise around low
pressure centers in the southern hemisphere but still spiral inward]
The convergence causes the air to rise at the center of the low.
Rising air expands and cools. If the air is sufficiently moist
clouds can form and then begin to rain or snow. Thus you often
see
cloudy skies and stormy weather associated with surface low pressure.
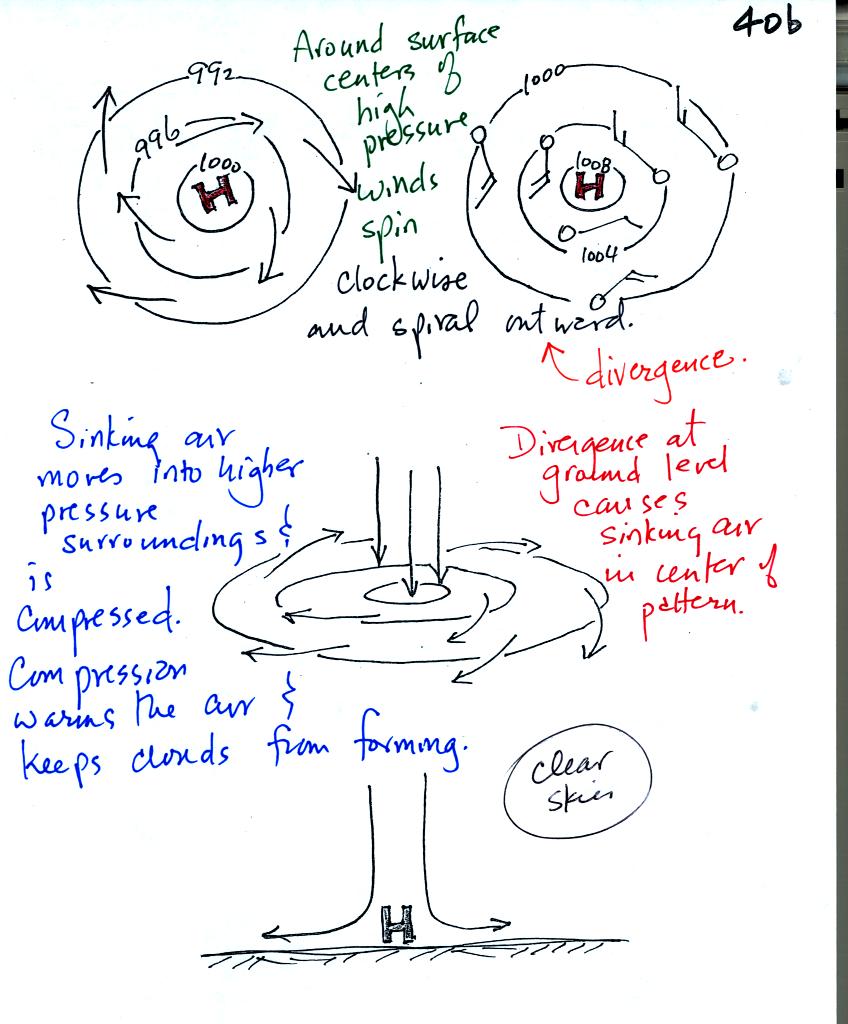
It is pretty much the opposite situation with surface high
pressure
centers. Winds spin clockwise and spiral outward
(divergence). Air sinks in the center of surface high pressure to
replace the diverging air. The sinking air is compressed and
warms. This keeps clouds from forming so clear
skies are normally found with high pressure.
The
pressure pattern will also give you an idea where the winds will be
fast and slow
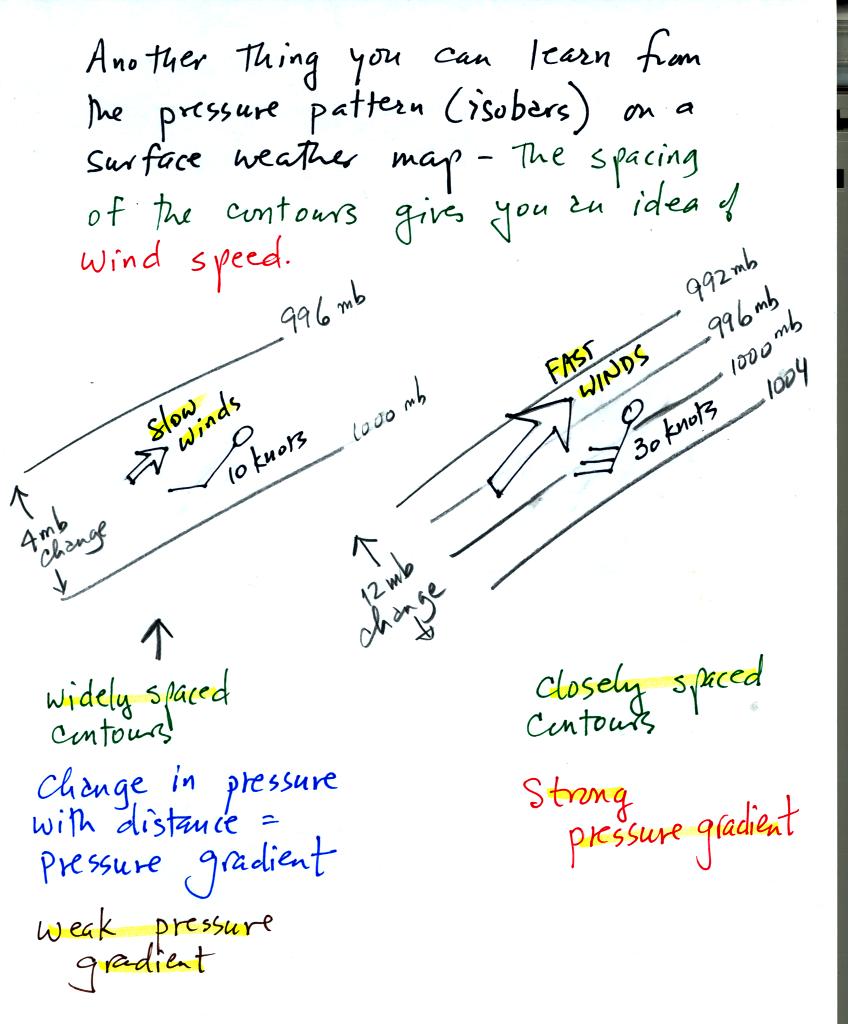
The figure above was redrawn for clarity.
In
the left figure pressure changes 4 mb over some horizontal
distance. In the figure at right there is a 12 mb pressure change
over the same distance. The pressure is changing slowly with
distance in the figure at left, this is a weak pressure gradient.
A stronger pressure gradient is shown in the figure at right.
The overall orientation of the isobars is the same in the
two figures, it is just the contour spacing that is different.
The winds blow in the same direction in both figures (from SW toward
the NE), but the speeds are different. The winds in the figure at
right with the strong pressure gradient are three times faster than the
winds at left.

In some respects weather maps are like topographic
maps. The map
above at top right represents the hill at top left. Closely
spaced
contours on the topographic map correspond to a steep slope on the
hill. Widely spaced contours depict the gradual slope on the
right side of the hill. If you were to trip and roll downhill,
you would roll faster on the steep slope than on the gradual
slope.
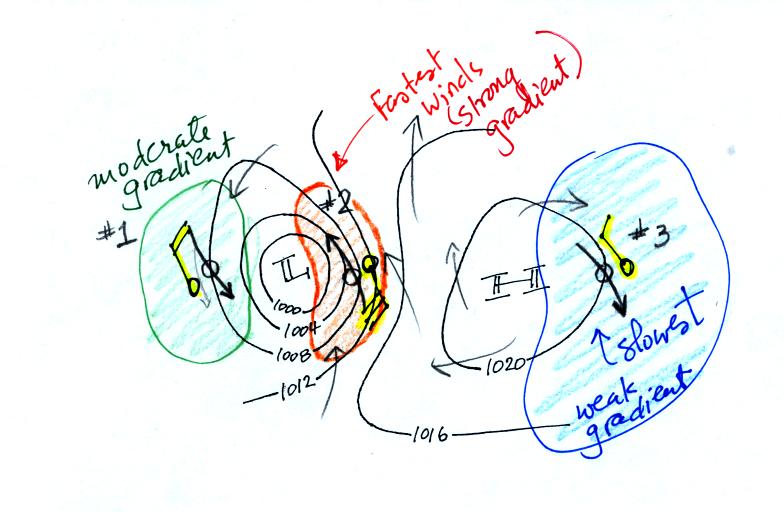
Here's a fairly complex but more realistic weather map
example (found at the bottom of p. 40c in the photocopied class
notes). The arrows
indicate the directions of the winds (clockwise and outward around the
high, counterclockwise and inward around the low). Fast 30 knot
winds are found in the strong pressure gradient region shaded orange
(#2). Slower 10 knot winds are shown in the weak
pressure gradient region colored blue (#3). The green shaded
region (#1) has a moderate pressure gradient and 20 knot winds.
Once the
pressure pattern gets the wind blowing, the winds can affect and change
the temperature pattern. The figure below shows the
temperature pattern you would
expect to see if the wind wasn't blowing at all or if the wind was
blowing straight from west to east. The bands of different
temperature air are aligned parallel to the lines of constant latitude.
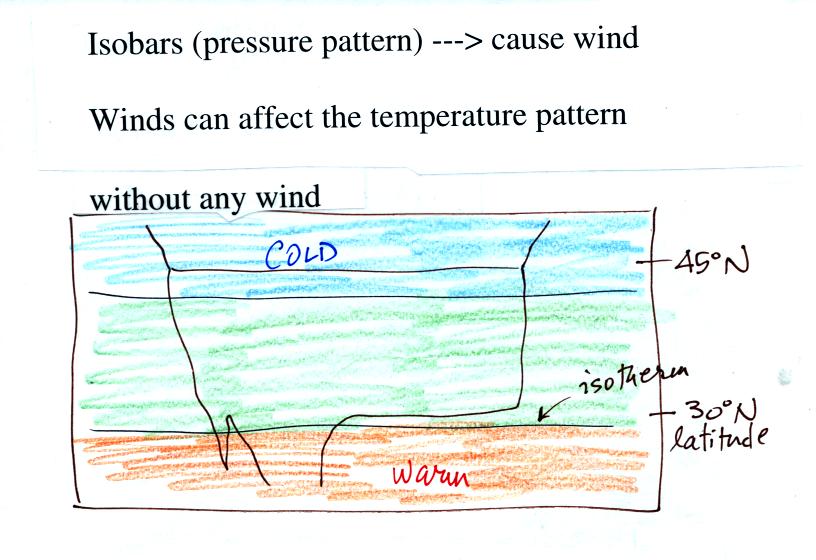
This isn't a very interesting picture. If
you were to travel from west to east you wouldn't experience much of a
temperature change. It gets a
little
more interesting if you put centers of high or low pressure in the
middle.
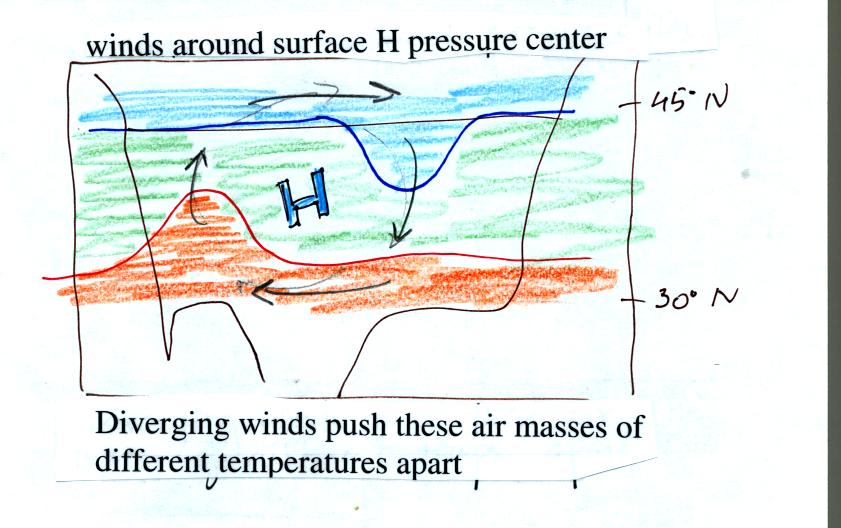
The clockwise spinning winds move warm air to the north of
the western
side of the HIGH. Cold air moves toward the south on the eastern
side of the high.
Counterclockwise winds move cold air toward the south on the
west side
of the LOW. Warm air advances toward the north on the eastern
side of the low.
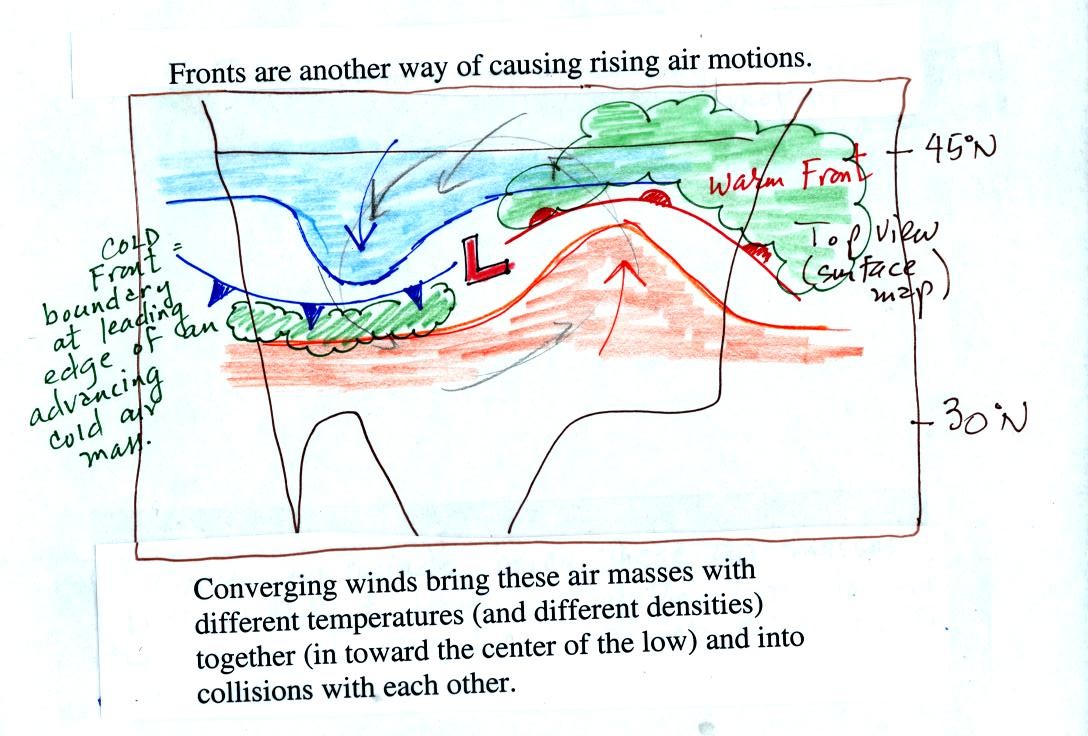
The converging winds in the case of low pressure will move the air
masses of different temperature in toward the center of low pressure
and cause them to collide with each other. The boundaries between
these colliding air masses are called fronts.
Cold air is moving from north toward the south on the
western side of
the low. The leading edge of the advancing cold air mass is a
cold front. Cold fronts are drawn in blue on weather maps.
The small triangular symbols on the side of the front identify it as a
cold front and show what direction it is moving. The fronts are
like spokes on a wheel. The "spokes" will spin counterclockwise
around the low pressure center.
A warm front (drawn in red with half circle symbols) is shown on the
right hand side of the map at the advancing edge of warm air.
Clouds can form along fronts (often in a fairly narrow band along a
cold front and over a larger area ahead of a warm front). We need
to look at the crossectional structure of warm and cold fronts to
understand better why this is the case.
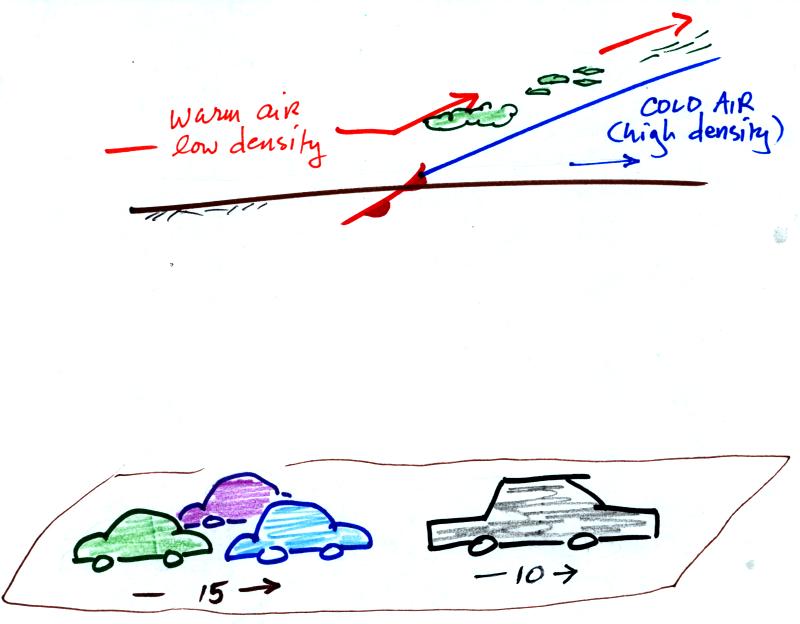
Crossectional
view of a cold front
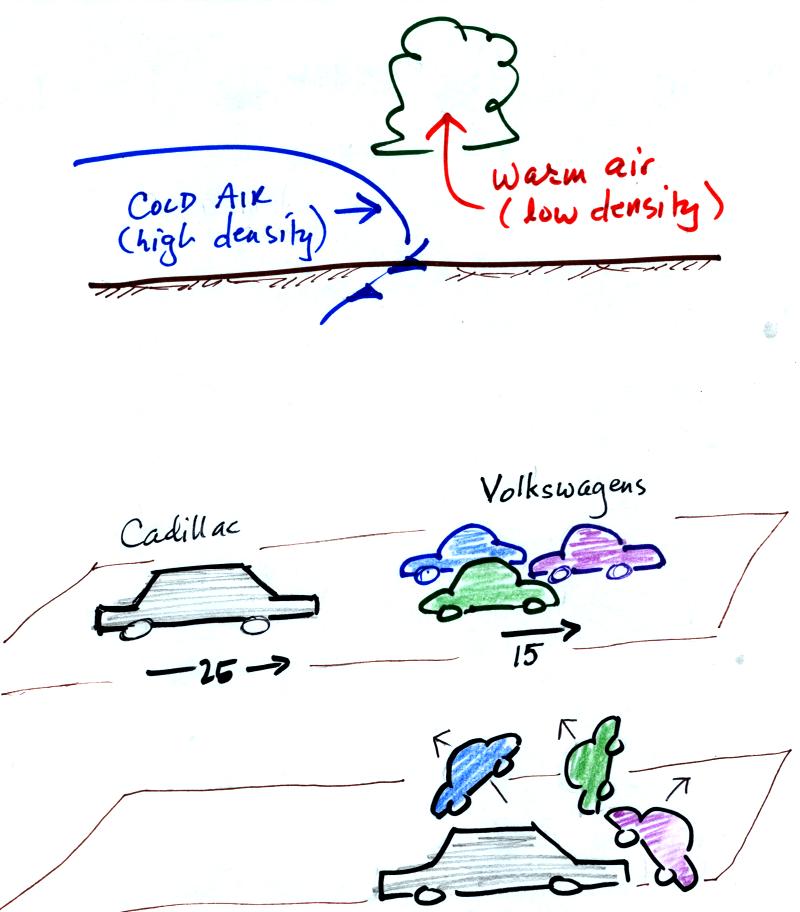
At the top of the figure, cold dense air on the left is advancing into
warmer lower density air
on the right. We are looking at the front edge of the cold air
mass. The warm low density air is lifted out of the way
by the cold air.
The lower figure shows an analogous situation, a big heavy Cadillac
plowing into a bunch of
Volkswagens. The VWs are thrown up into the air by the Cadillac.
Crossectional
view of a warm front
In the case of a warm front we are looking at the
back,
trailing edge of cold air (moving slowly to the right). Note the
ramp
like shape of the cold air mass. Warm air overtakes the cold
air. The warm air is still less dense than the cold air, it can't
wedge its way underneath the cold air. Rather the warm air
overruns the cold air. The warm air rises again (more gradually)
and clouds form. The clouds generally are spread out over a
larger area than with cold fronts.
In the automobile analogy, the VWs are catching a Cadillac. What
happens
when they overtake the Cadillac?
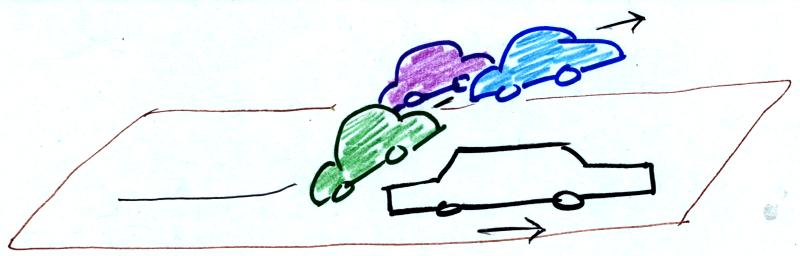
The Volkswagens aren't heavy enough to lift the
Cadillac.
They run up and over the Cadillac.
Fronts are another way of
causing air to rise. Rising air cools and if the
warm air
is moist, clouds and precipitation can form.