Introduction to Humidity
Variables
This is an introduction to an important new topic: humidity. The
beginning of
Chapter 4 can be a little overwhelming and confusing. If you find
it too confusing, I would suggest you stop reading. Instead,
study this introduction and the notes you take in class. We will
work a number of example humidity problems and you should fairly
quickly grasp the basic concepts.
We will be mainly interested in 4 variables, what they are
and what can cause their values to change. The variables are :
mixing ratio, saturation
mixing ratio, relative humidity, and dew point. You will find
most of what follows on pps 83-85 in the photocopied class notes.
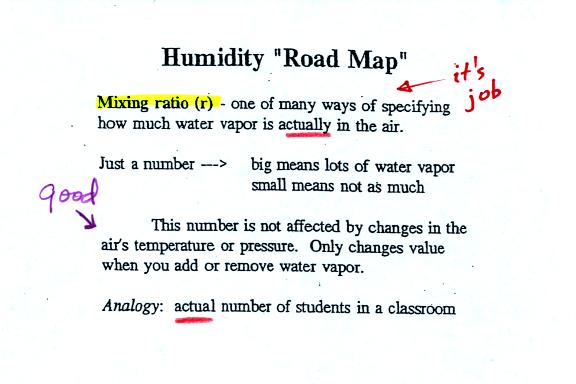
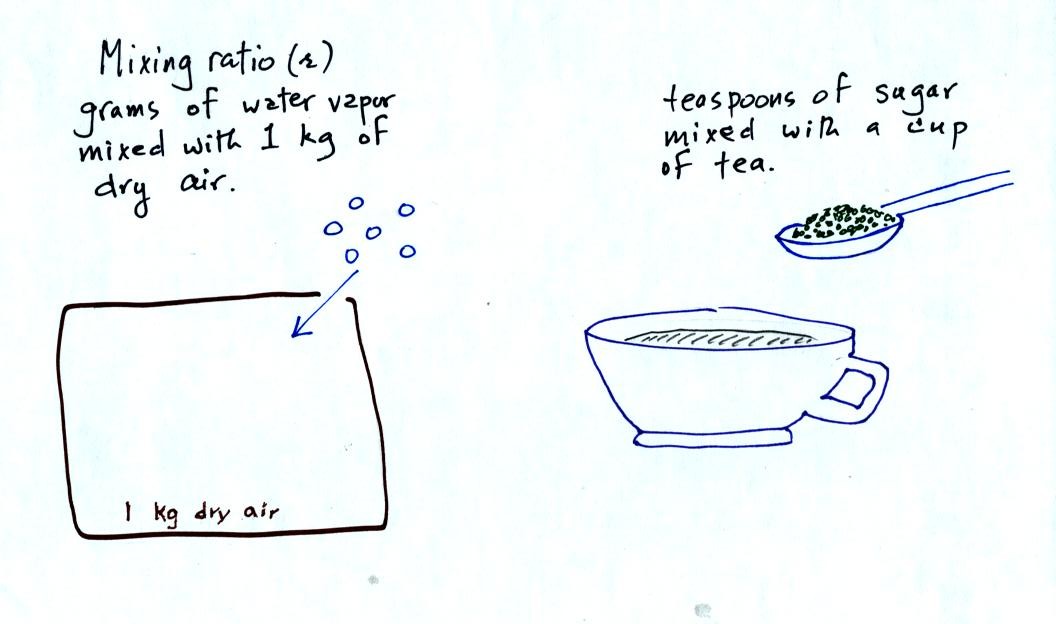
Mixing ratio tells you how much water vapor is actually in
the
air. Mixing ratio has units of grams of water vapor per kilogram
of dry air (the amount of water vapor in grams mixed with a
kilogram
of dry air). It is basically the same idea as teaspoons of sugar
mixed in a cup of tea.
The value of the mixing ratio won't change unless you add
water
vapor to or remove water vapor from the air. Warming the air
won't
change the mixing ratio. Cooling the air won't change the mixing
ratio
(unless the air is cooled below its dew point temperature and water
vapor starts to condense).
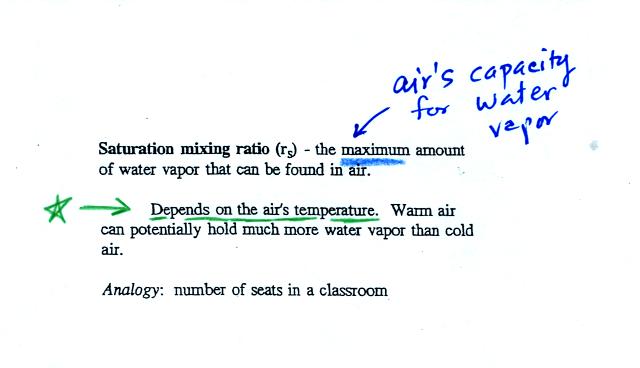
Saturation mixing ratio is just an upper limit to how much
water vapor
can be found in air, the air's capacity for water vapor. It's a
property of air, it doesn't say anything about how much water
vapor is actually in the air (that's the mixing ratio's job).
Warm air can potentially hold more water vapor than cold air.
This variable has the same units: grams of water vapor per kilogram of
dry air. Saturation mixing ratio values for different air
temperatures are listed and graphed on p. 86 in the photocopied class
notes.
The dependence of saturation mixing ratio on air temperature is
illustrated below:
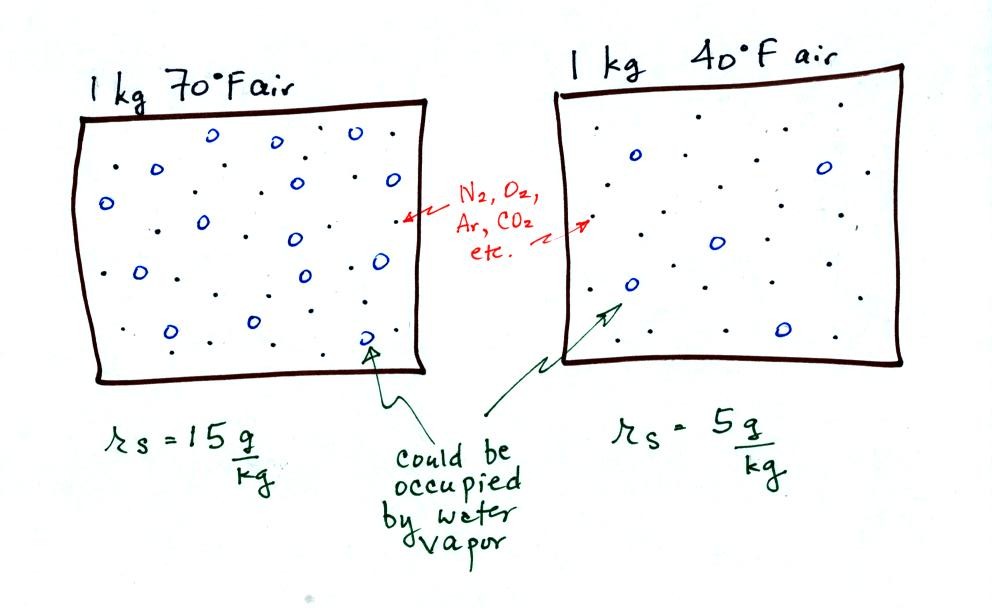
The small specks represent all of the gases in air except
for the water
vapor. Each of the open circles represents 1 gram of water vapor
that the air could hold. There are 15 open circles drawn in the 1
kg of 70 F air; each 1 kg of 70 F air could hold up to 15 grams of
water vapor. The 40 F air only has 5 open circles; this cooler
air can only hold up to 5 grams of water vapor per kilogram of dry air.
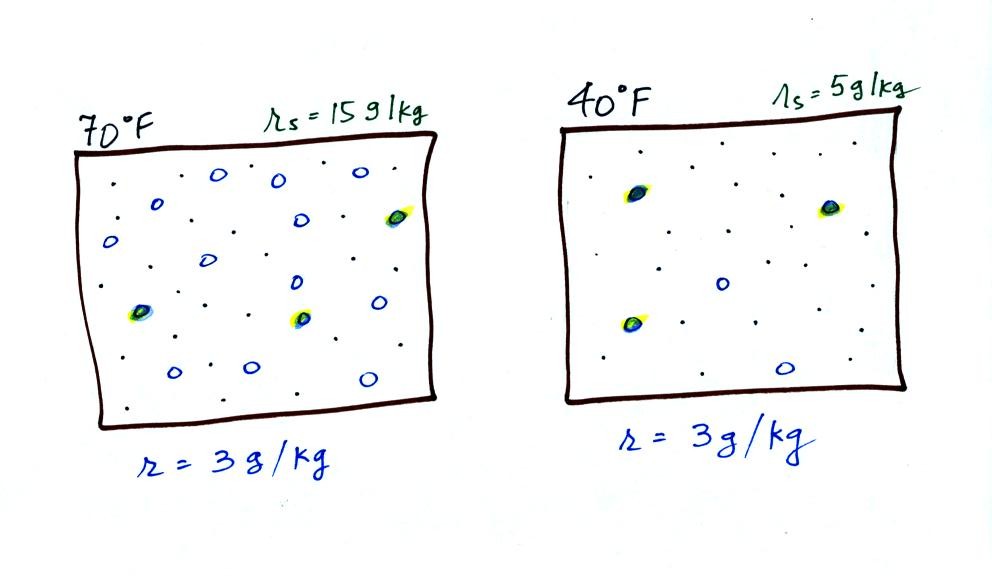
Now we have gone and actually put some water vapor
into the
volumes of
70 F and 40 F air. 3 grams of water vapor have been added to each
volume of air. The mixing ratio, r, is 3 g/kg in both cases.

The relative
humidity is the variable most people are familiar with, it tells you
how "full" the air is with water
vapor.
In the analogy (sketched on the right hand side of p. 83 in
the photocopied notes) 4 students wander into Classroom A which has 16
empty
seats. Classroom A is filled to 25% of its capacity.
You can think of 4, the number of students, as being analogous to the
mixing ratio. The classroom capacity is analogous
to the
saturation mixing ratio. The percentage occupancy is analogous to
the relative humidity.
Instead of students and a classroom you
could think of the 70 F and 40 F air that could potentially hold 15
grams or 5 grams, respectively of water vapor.
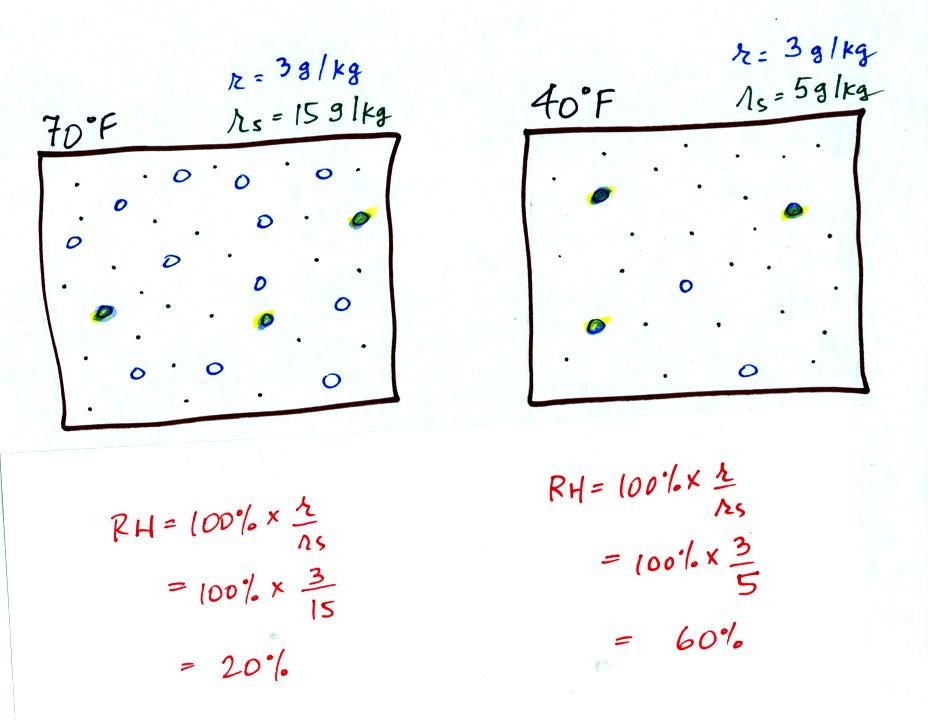
Here are the relative humidities of the 70 F and 40 F air
that each
contain 3 grams of water vapor. The 70 F air has a low RH because
this warm air's saturation mixing ratio is large. The RH in the
40 F is higher even though it has the same actual amount of water vapor
because the 40 F air can't hold as much water vapor and is closer to
being saturated.
Something important to note: RH doesn't really tell you how much water
vapor is
actually in the air. The two volumes of air above contain the
same amount of water vapor (3 grams per kilogram) but have different
relative humidities. You could just as easily have two volumes of
air with the same relative humidities but different actual amounts of
water vapor.
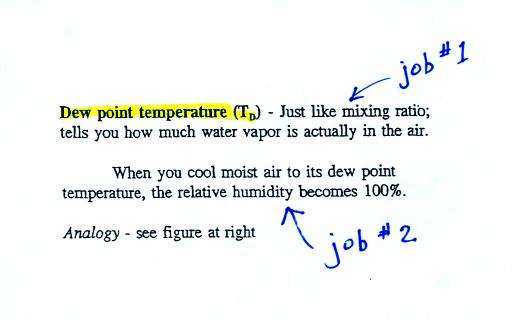
The dew point temperature has two jobs. First it is a
measure of
the actual amount of water vapor in the air. In this respect it
is just like the mixing ratio. If the dew point temperature is
low the air doesn't contain much water vapor. If it is high the
air contains more water vapor.
Second the dew point tells you how much you must cool the air in order
to cause the RH to increase to 100% (at which point a cloud, or dew or
frost, or fog would form).
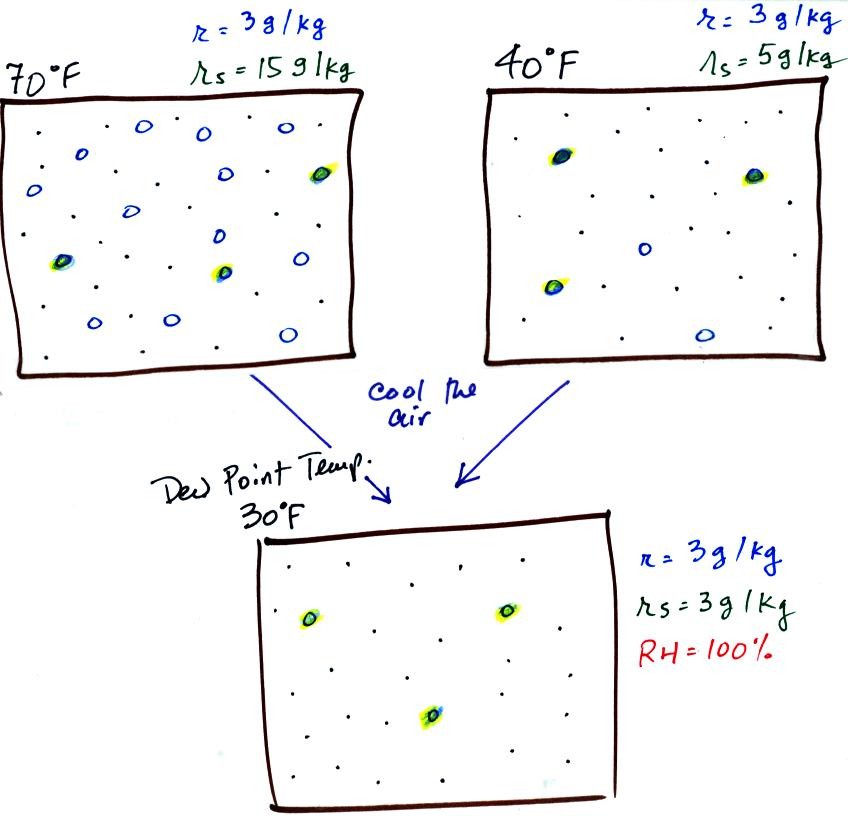
If we cool the 70 F air or the 40 F air to 30 F we would
find that the
saturation mixing ratio would decrease to 3 grams/kilogram. Since
the air actually contains 3 g/kg, the RH of the 30 F air would become
100%. The 30 F air would be saturated, it would be filled to
capacity with water vapor. 30 F is the dew point temperature for
70 F air that contains 3 grams of water vapor per kilogram of dry
air. It is also the dew point temperature for 40 F air that
contains 3 grams of water vapor per kilogram of dry air.
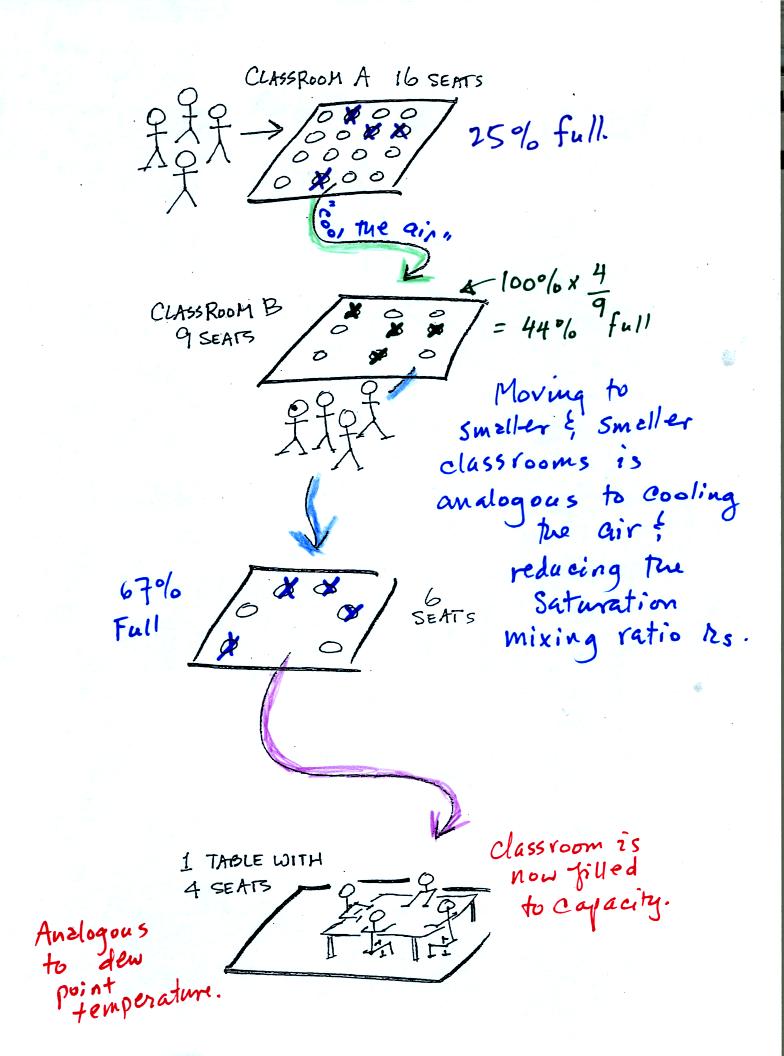
Now back to our students and classrooms analogy on the righthand
side of p. 83. The 4 students
move into classrooms of smaller and smaller capacity. The
decreasing capacity of the classrooms is analogous to the
decrease in saturation mixing ratio that occurs when you cool
air. Eventually the students move into a classroom that they just
fill to capacity. This is analogous to cooling the air to the dew
point temperature, at which point the RH becomes 100% and the air is
filled to capacity, the air is saturated with water vapor.
Next we
will try to understand better why it is possible to saturate air with
water vapor. Why is there an upper limit to the amount of water
vapor that air can contain? Why does this upper limit depend on
air temperature.
First we need to understand that the rate at which water evaporates
depends on the water's temperature.
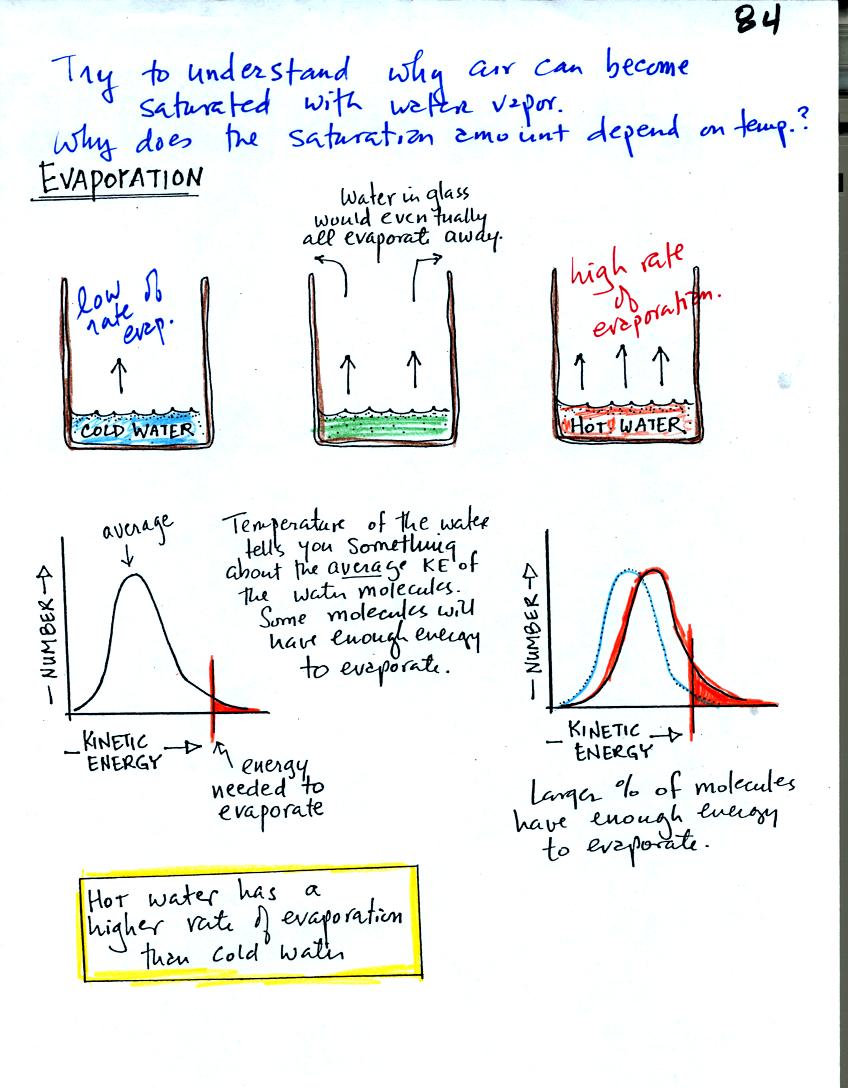
Before reading any further, is the statement "hot water has
a higher rate of evaporation than cold water" what you would have
suspected? Your intuition in this case is probably pretty good.
To be able to evaporate, a water molecule in a glass must make its way
up to the
surface of the water and the water molecule must have sufficient
kinetic energy
to overcome any attractive forces trying to keep it in a liquid
state.
The distributions of the kinetic energies of the water molecules in the
glasses of cold and hot water (remember temperature is a measure of the
average kinetic energy) are shown in the two graphs above. In
cold water only a limited number of the water molecules
(those in the red-shaded portion of the graph) have the necessary
energy - cold water has a low rate of
evaporation. In hot water, the whole distribution has slid to the
right, a larger fracton of the water
molecules will have enough energy (the red shaded portion is larger),
hot water evaporates more rapidly.
Now we will look at the top part of p. 85 in the photocopied
notes. We have put a cover on the glass of room temperature
water.

In #1 we see that the water is evaporating (2 arrows worth
of
evaporation). Water vapor will begin to build up in the air in
the glass. This is shown in #2. Some of the water vapor
molecules will condense (even though they may have just
evaporated). In Fig. #3 the amount of water vapor has built up to
a point where there is one arrow worth of condensation. In #3
there is still more evaporation than condensation so the water vapor
concentration will increase a little bit more. Eventually in #4
the water vapor concentration has increased to a point that there are
two arrows of condensation. This balances the 2 arrows of
evaporation. The air is saturated, the air is filled to
capacity. The amount of water vapor in the air will now remain
constant.
What would happen if we took off the cover and added some
more water
vapor to the glass in Fig. #4? (this figure isn't include in the
photocopied class notes).
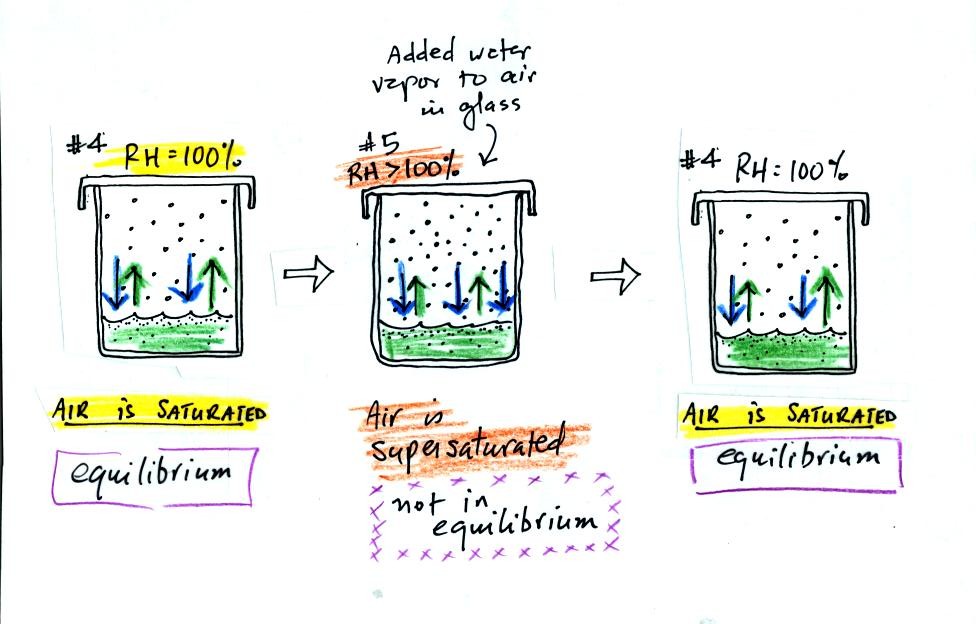
The air in Fig. #5 shows what would happen. The
air
would be supersaturated with water vapor and the RH would be greater
than 100%. This is possible but it is not an equilibrium
situation. The increased amount of water vapor would increase the
rate of condensation. There would be more condensation than
evaporation. The water vapor concentration would begin to
decrease. Eventually the glass would return to the equilibrium
situation in Fig. #4.
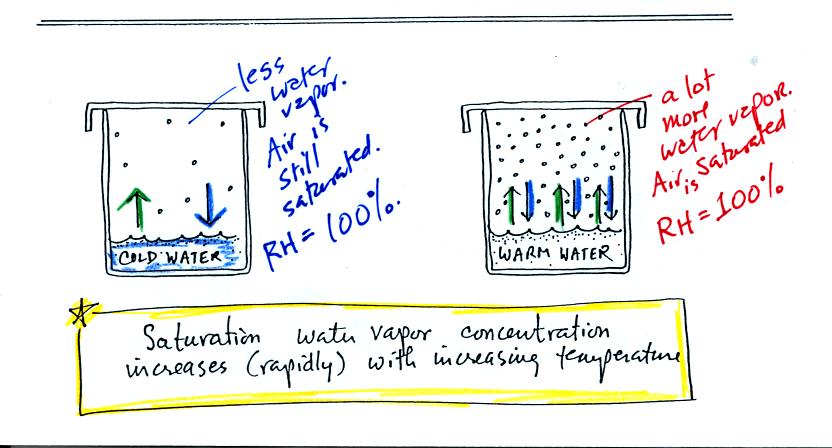
If we look at the bottom of p. 85 we see that the air in all
three cases is
saturated (equal rates of evaporation and condensation in each
case). The relative humidity is 100% in all three cases.
The amount of water vapor in the air however is different. The
warm air contains a lot more water vapor than the cold air.
Here is a hidden humidity optional
assignment (due at the beginning of class on the first day of class
after Spring Break)