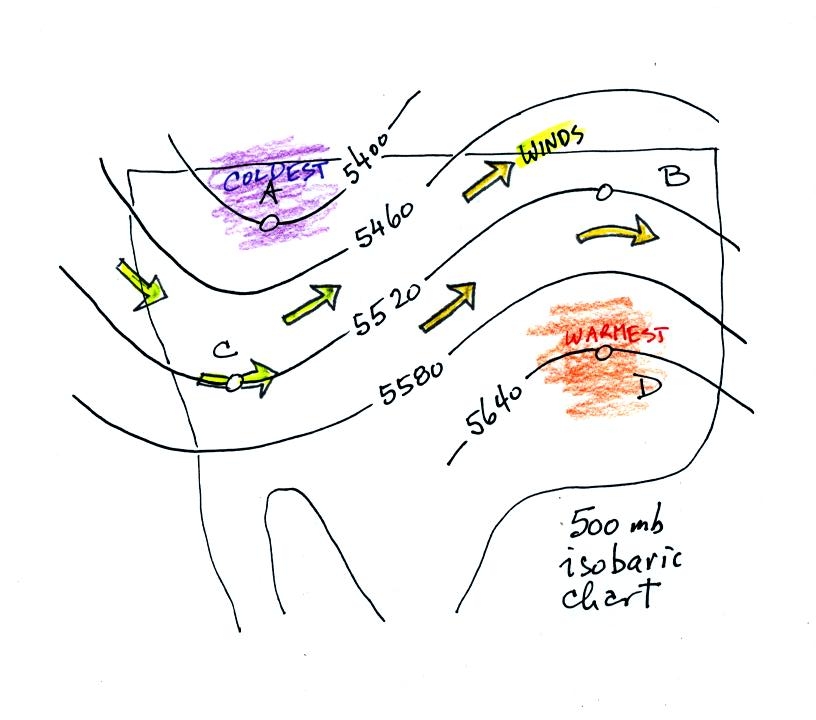
Since this is an isobaric chart, all four points have the same
pressure, 500 mb. The numbers on the contour lines are altitudes
in meters. The 500 mb pressure level is found at higher altitude
than the 850 mb level used in the previous examples.
At 5400 m, Point A is found at lowest altitude. The coldest air
in the picture is between the ground and Point A. That is why
Point A is closest to the ground.
The warmest air is found between the ground and Point D. Point D
is found at highest altitude, 5640 meters.
The winds (yellow arrows) on upper level charts blow parallel to the
height contours. This winds are blowing straight from west to
east at Point C.