Thursday Nov. 10, 2011
click here to
download today's notes in a more printer friendly format.
A single, fairly long, instrumental, Oaxaca, by a
group named Maserati
before class this morning.
The Experiment #3 reports have been graded and were returned in class
today. You now have 2 weeks to revise your report if you want to
(it's not required). The revised reports are due on or before
Wednesday, Nov. 23. That's the Wednesday before
Thanksgiving. So you'll need to either bring the reports to class
on the Tuesday the 22nd or drop them off in my office.
A new Bonus 1S1P Assignment and
the first of the 1S1P Assignment #3
topics are now online. There are also a couple of new
Optional Assignments.
One
is
discussed
in
more detail at the end of today's notes. The
other is due on Thursday next week (Nov. 17).
Here's an idea of what we covered in class today. For the first
time in several weeks the T Th section is ahead of the MWF class.
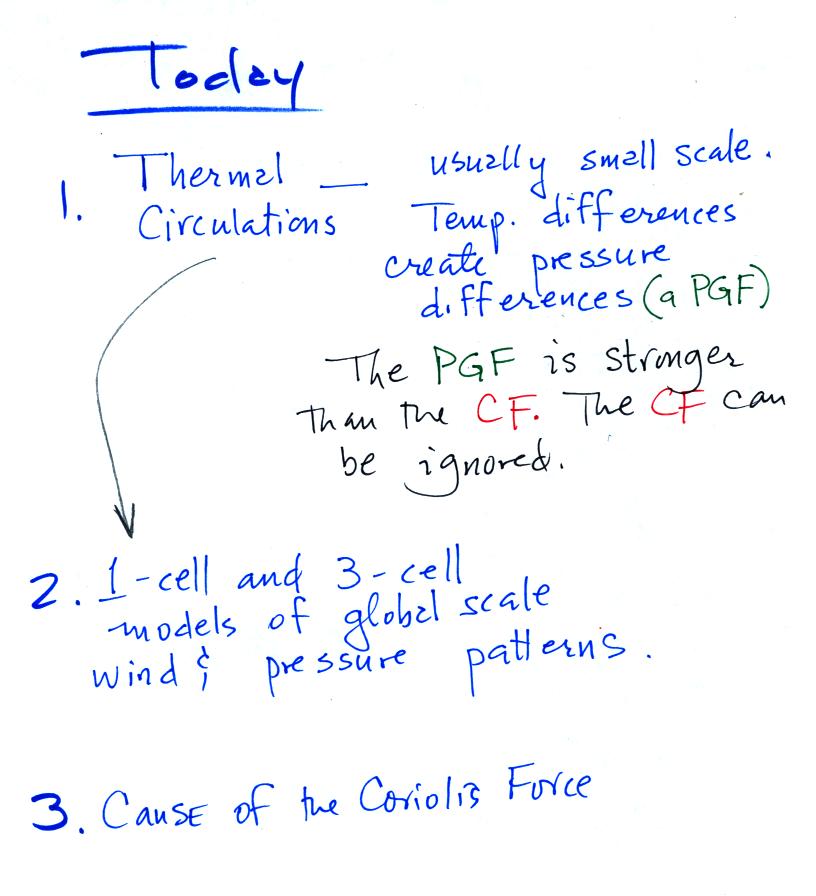
Thermal Circulations
Differences
in temperature like you might find between a coast and
the ocean or between a city and the surrounding country side can create
horizontal pressure differences. The horizontal pressure gradient can
then produce a wind flow pattern known as a thermal circulation.
When dealing with these usually small scale circulations, the
pressure gradient force is often so much stronger than the Coriolis
force
that the
Coriolis force can be ignored.
We will learn how thermal
circulations develop and then apply to concept to the earth as a
whole
in order to understand large global scale pressure and wind
patterns. You'll find this
discussed on p. 131 in the photocopied Class Notes.
The figures below are more carefully drawn versions of what was done in
class.
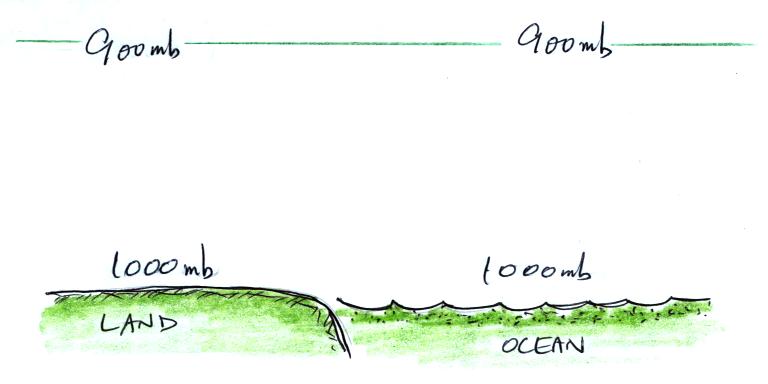
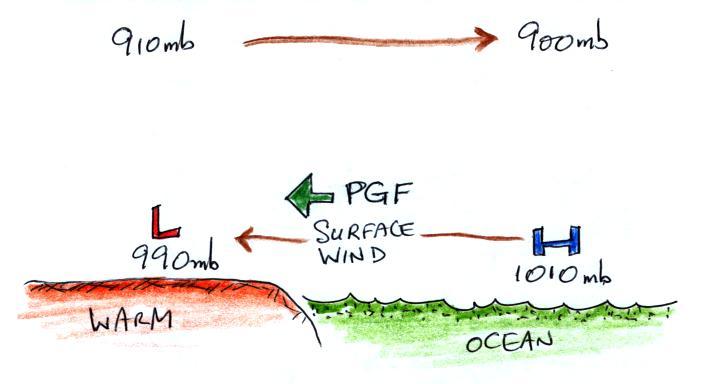
We've situated ourselves along a sea
coast. There aren't any temperature differences yet in this
picture (both the ocean and the land are shaded green), so the pressure
at the ground and at some level above the
ground are the same over the land and over the ocean.
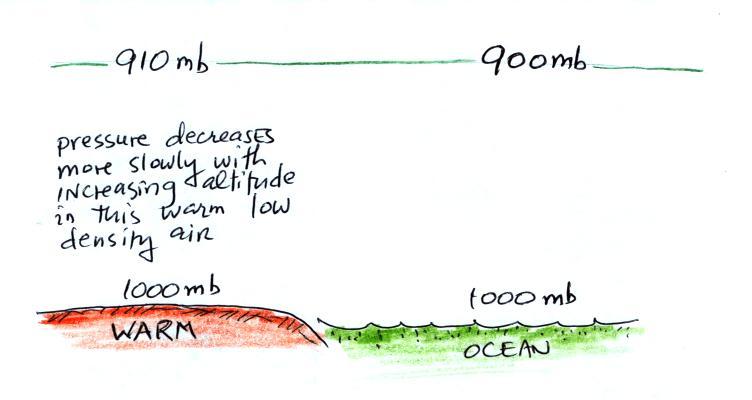
A beach will often become much warmer than the
nearby
ocean during
the day (the sand gets hot enough that it is painful to walk across in
bare feet). The ocean is much harder to warm and won't change
temperature much during the day. The warm ground will warm the
air above. Pressure
decreases more slowly as you move upward through warm low density
air (this is something we covered early in the semester). As you
move from the ground to the level of the green line
in the picture above pressure decreases 90 mb in the warm air and a
little more, 100 mb, in the cooler denser air over the ocean.
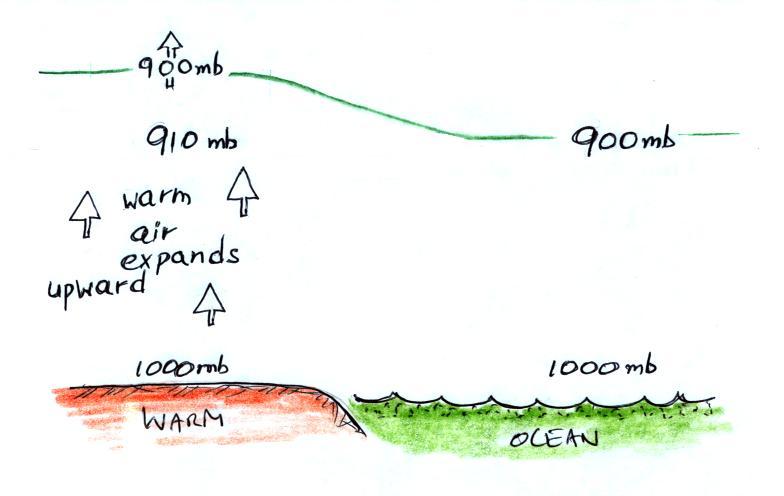
Here's another way of figuring out what happens. The warm air
expands pushing the 900 mb pressure level to a higher level than it
would normally be found. 910 mb pressure
from a little lower altitude moves in to take its place.
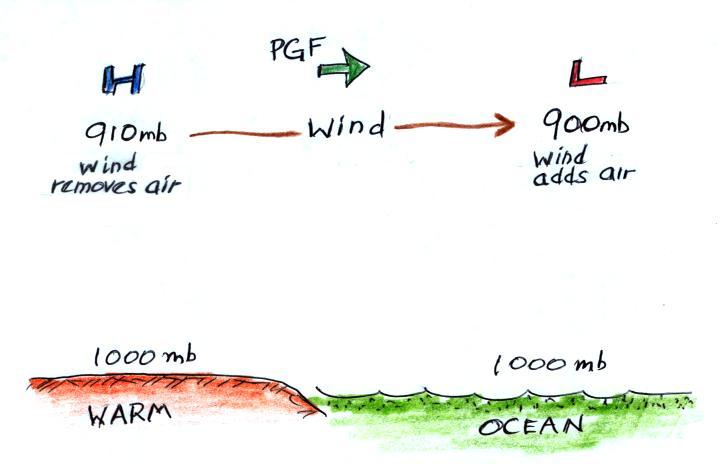
The temperature differences at the ground have created an upper
level pressure
gradient (pressure difference), higher pressure (910 mb) on the left
and lower pressure (900 mb) on the right. The resulting pressure
gradient force (PGF) causes air to start to blow from left to right.
The upper level winds (which remove air from the left side of the
picture and add it to the right) will affect the surface pressure
pattern.
Air leaving the left side of the picture
will lower the surface pressure (from 1000 mb to 990 mb). Adding
air aloft to the right side of the picture will increase the surface
pressure (from 1000 mb to 1010 mb). Surface winds will start to
blow from right to left.
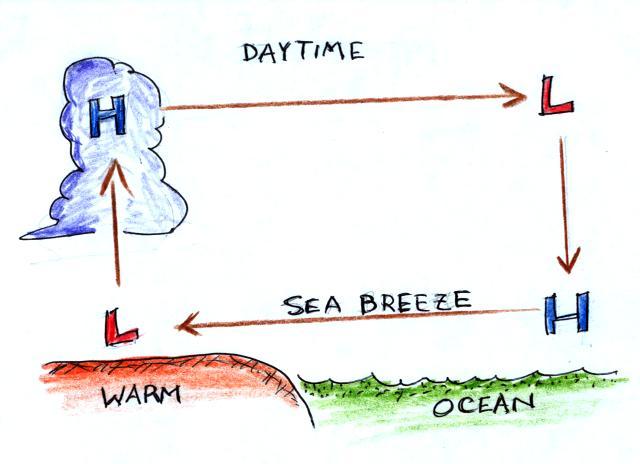
You can complete the circulation loop by adding rising air
above the
surface low pressure at left and sinking air above the surface high at
right. The surface winds which blow from the ocean onto land are
called a sea breeze (the name tells you where the winds come
from). Since this air is likely to be moist, cloud formation is
likely when the air rises over the warm ground. Rising air
expands and cools. If you cool moist air to its dew point, clouds
form (I'm not sure why I
colored the cloud purple in this picture).
It is pretty easy to figure the directions of the winds in a thermal
circulation without going through a long-winded development like we
just done. Just remember that warm air rises.
Draw
in
a
rising
air
arrow
above
the
warm
part
of
the
picture,
then complete the loop.
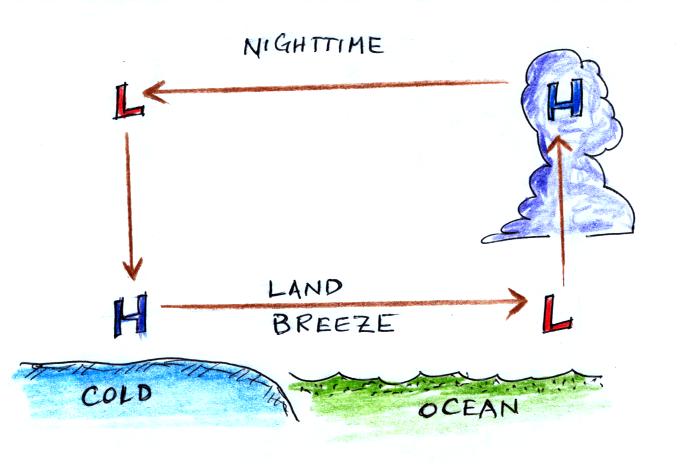
At night the ground cools more quickly than the ocean and becomes
colder than the water (the water temperature didn't change at all in
the picture below). Rising air is found over the ocean
water because it is warmer than the land. The thermal circulation
pattern reverses
direction. Surface winds blow from the land out over the
ocean. This is referred to as a land breeze.
Here
are
some
additional
examples
of
thermal
circulations
or
large
scale
circulations
that
resemble
thermal
circulations. We didn't discuss
the first of these in class.
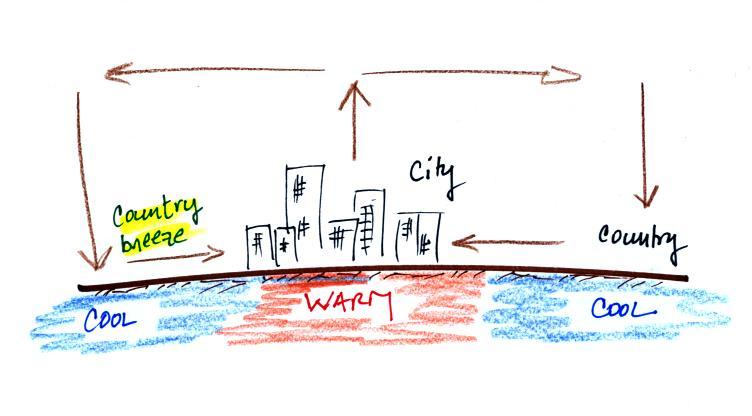
Cities are often warmer than the
surrounding
countryside,
especially at night. This is referred to as the urban heat island
effect. This difference in temperature can create a
"country breeze." This will sometimes carry pollutants
from a factory outside the city back into the city or odors from a
sewer treatment plant outside of town back into town.
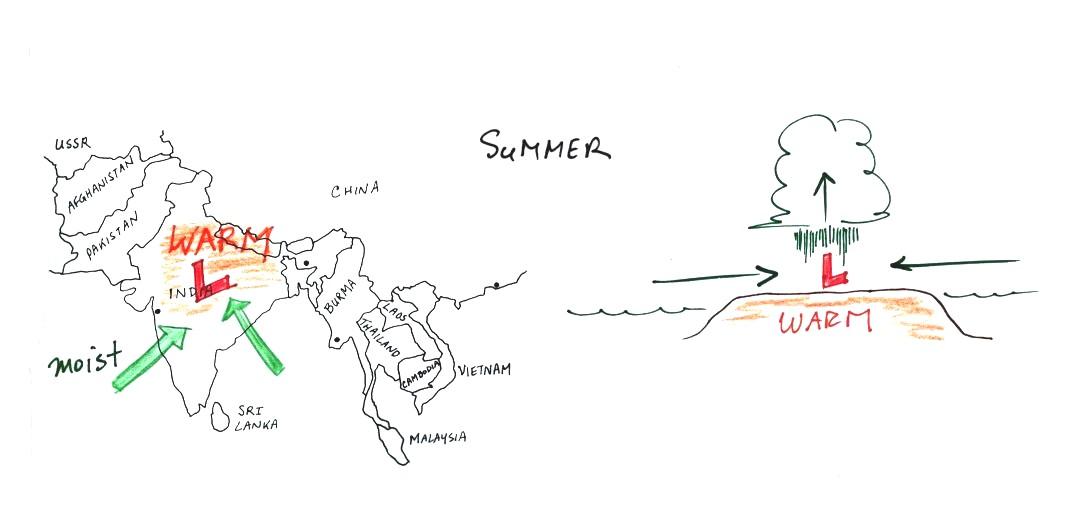
The Asian monsoon (monsoon refers to a seasonal change
in the direction of the prevailing winds) is a large scale circulation
pattern and is much more complex than a simple thermal
circulation. However you can
use the thermal circulation concept to get a general understanding of
what to expect at different times of the year.
In the summer land masses in India and SE
Asia
become warmer than the
oceans
nearby. Surface low pressure forms over the land, moist winds
blow from the ocean onshore, and very large amounts of rain can
follow. A map view (view from above) is shown at left, a
crossectional view is shown at right.
The winds change
directions in the
winter when the
land becomes colder
than the ocean.
You can
also use the thermal circulation to understand some of the basic
features of the El Nino phenomenon (you find a discussion of the El
Nino on pps 135-139 in the photocopied Classnotes). We did
discuss this briefly in class.
First here is what conditions look like in the tropical Pacific
Ocean
in non-El Nino years (top and side views again)
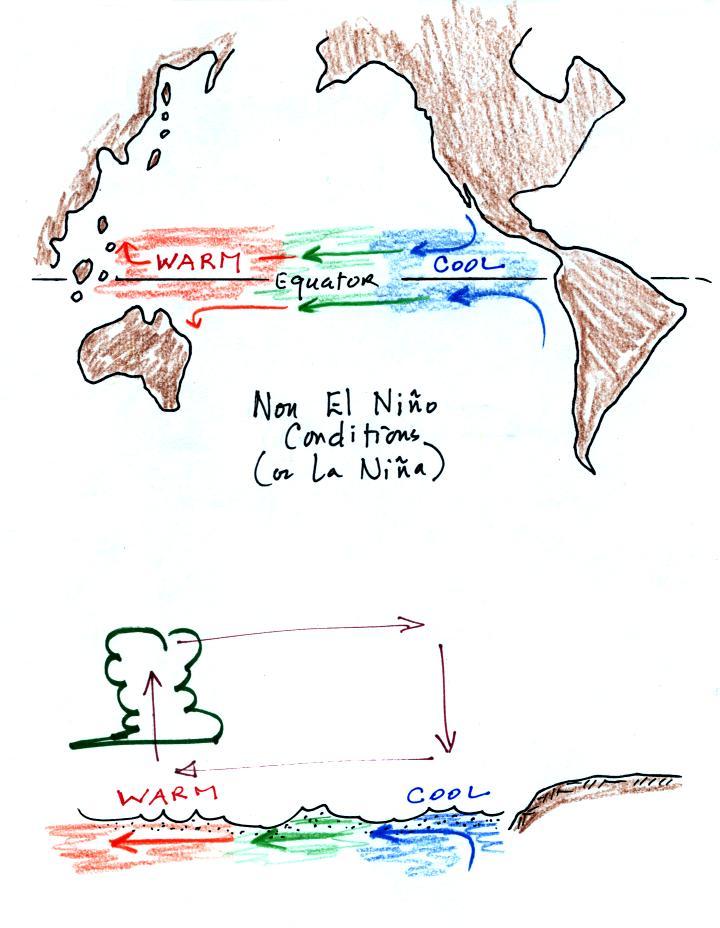
Cold ocean currents
along the west coasts of N. America and S.
American normally converge at the equator and begin to flow westward
(see top view above). As the water travels westward it
warms. Some of the warmest sea surface waters on earth are
normally found
in the western Tropical Pacific. A temperature gradient becomes
established between the W. and E. ends of the tropical Pacific. The
crossectional view above shows the normal temperature and circulation
pattern found in the equatorial Pacific Ocean. You would
find surface high pressure in the east and low pressure in the
west. Note that the wind circulation pattern is the same as the
simple thermal circulation we studied above.
During a La Nina event, waters in the Eastern Pacific are even
colder than normal. This generally produces drier than normal
conditions during the winter in the desert SW. This was the case
last winter and La Nina conditions are again in effect this
winter. You can read more about La Nina here.
Every few years El Nino conditions occur and the cold
currents don't
make it to the
Equator. Warm water is carried from the western Pacific to the
eastern Pacific. The temperature and pressure basically reverses
itself.
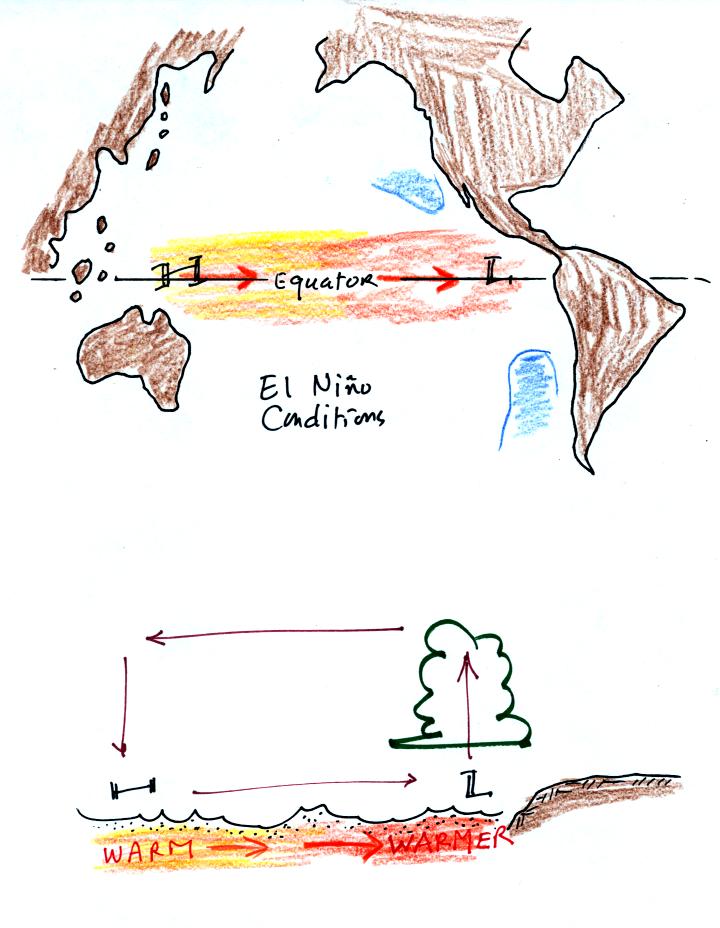
Now surface high
pressure is found in the west and surface low
pressure and rising air is found in the E. Pacific (the reversal in the
surface pressure pattern is referred to as the southern
oscillation). Indonesia and Australia often experience drought
conditions during El Nino events. In the desert SW we expect
slightly wetter than normal conditions (perhaps 20% wetter than
normal). Wetter conditions are also found in California and in
the SE US.
The second main topic of the day: using
the
thermal
circulation
idea
to
learn
something
about
global
scale
pressure
and
wind
patterns
on
the
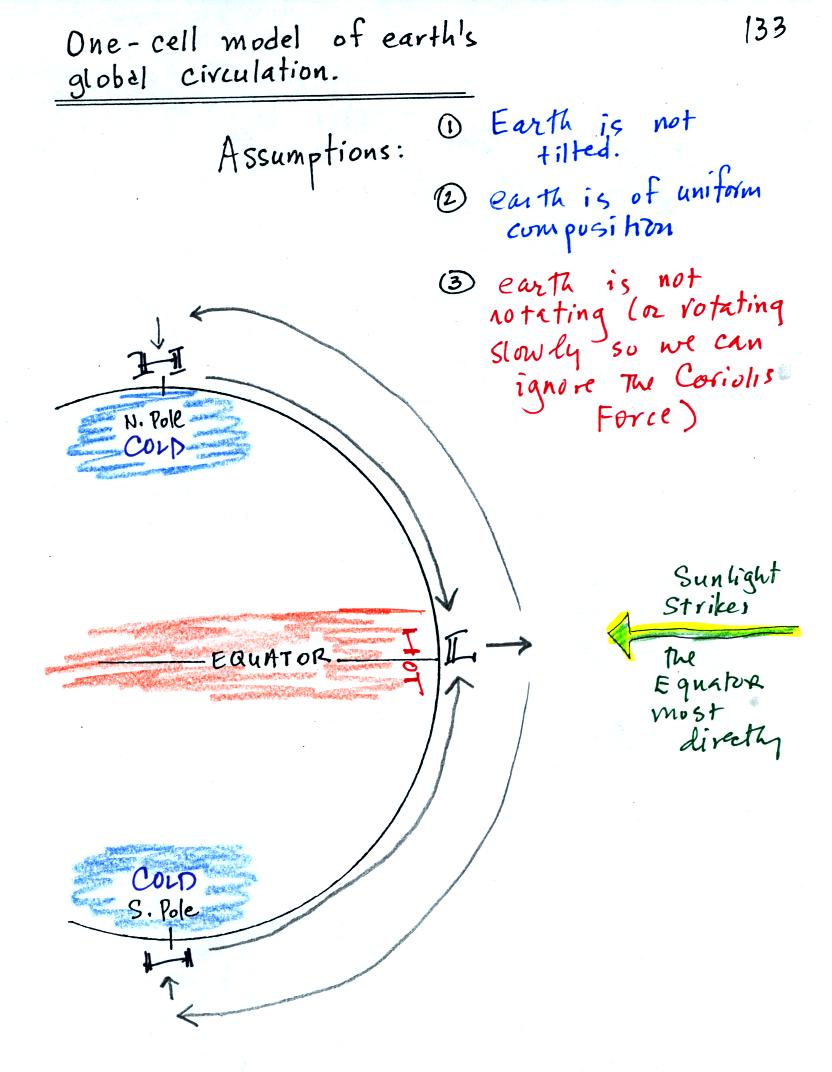
earth. Ordinarily you couldn't apply a small scale phenomena like
a thermal circulation to the much larger global scale. However if
we make some simplifying assumptions, particularly if we assume that
the earth doesn't rotate or only rotates slowly, we can ignore the
Coriolis force and a thermal circulation could become established.
Some additional simplifications are also made and are listed below (p.
133 in the photocopied Classnotes). The figures are more
carefully drawn versions of what was done in class.
Because the earth isn't tilted, the incoming sunlight
shines
on the earth most directly at
the
equator. The equator will become hotter than the poles. By
allowing
the
earth
to
rotate
slowly
we
spread
this
warmth
out
in
a
belt
that circles the globe at the equator rather than concentrating it in a
spot on
the side of the earth facing the sun. Because the
earth is of uniform composition there aren't any temperature
differences created between oceans and continents.
You can see the wind
circulation pattern that would develop. The term one cell
just means there is one complete
loop
in the northern hemisphere and another in the southern hemisphere.
Next we will remove the assumption concerning the rotation of the
earth. We won't be able to ignore the Coriolis force now.
Here's what a computer would predict you would now see
on
the earth. Things are pretty much the same at the equator in the
three cell and one cell models: surface low pressure and rising
air. At
upper levels the winds begin to blow from the equator toward the
poles. Once headed toward the poles the upper
level winds are deflected by the Coriolis force.
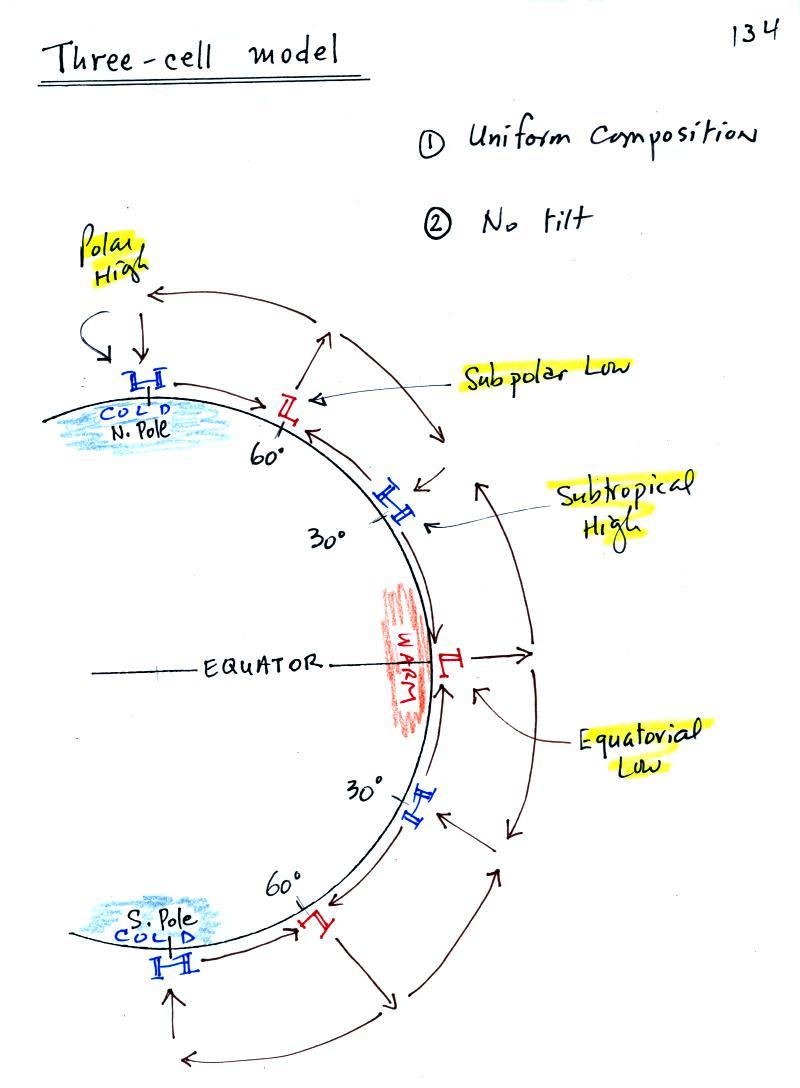
There end up being three closed loops in the northern and in the
southern hemispheres. There are surface belts of low
pressure
at the equator (the equatorial low)
and at 60 degrees latitude (the subpolar
low). There are belts of high pressure (the subtropical high) at 30
latitude and high pressure centers at the two poles (the polar highs).
We will look at the 3-cell model surface features (pressure belts and
winds) in a little more detail because
some of what is predicted, even with the unrealistic assumptions, is
actually found on the earth.
Here's a map view of the region between 30 S and 30 N latitude.

There's a lot of information on this picture, but with a
little study you should be able to start with a
blank
sheet of paper and reproduce this figure. I would suggest
starting at the equator. You need to remember that there is a
belt of
low pressure found there. Then remember that the pressure belts
alternate: there are belts of high pressure at 30 N and 30 S.
Let's start at 30 S.
Winds will begin to
blow from High pressure at 30 S toward Low pressure at the
equator. Once the winds start to blow they will turn to the left
because of the Coriolis force. Winds blow from 30 N toward the
equator and turn to the right in the northern hemisphere (you need to
turn the page upside down and look in the direction the winds are
blowing). These are the Trade
Winds (northeasterly trade winds north of the equator and
southeasterly trades south of the equator). They converge at the
equator and the air there rises (refer back to the crossectional view
of the 3-cell model). This is the cause of the band of clouds that you
can often see at or near the equator on a satellite
photograph.
The Intertropical Convergence Zone or ITCZ is another name for the
equatorial low pressure belt. This region is
also referred to as the doldrums because it is a region where surface
winds are often weak. Sailing ships would sometimes get stranded
there hundreds of miles from land. Fortunately
it is a cloudy and
rainy region so the sailors wouldn't run out of drinking water (they
might well have run out of rum though which they probably felt was
worse).
Hurricanes form over warm ocean water in the subtropics between the
equator and 30
latitude. Winds at these latitudes have a strong easterly
component and hurricanes, at least early in their development, move
from east to west. Middle latitude storms found between 30 and 60
latitude, where the prevailing westerly
wind belt is found, move from
west to east.
You find sinking air, clear skies, and weak surface winds associated
with the subtropical high pressure belt. This is also known as
the horse latitudes. Sailing ships could become stranded there
also. Horses were apparently either thrown overboard (to conserve
drinking water) or eaten if food supplies were running low (after class
I had a look at Wikipedia
and found a different explanation of the origin of the term "horse
latitudes"). Note
that sinking air is associated with the subtropical high pressure belt
so this is a region on the earth where skies are
clear (Tucson is
located at 32 N latitude, so we are strongly affected by the
subtropical high
pressure belt).
The winds to the north of 30 N and to the south of 30 S are called the
"prevailing westerlies."
They blow from the SW in the northern hemisphere and from the NW in the
southern hemisphere. The 30 S to 60 S latitude belt in the southern
hemisphere is mostly ocean. Because there is less friction over
the oceans, the prevailing westerlies there can
get strong, especially in the winter. They are sometimes referred
to as the "roaring 40s" or the "ferocious 50s" (the 40s and 50s refer
to the latitude belt they are found in).
We didn't have time in class for the following figure. But
I'll insert it here anyways and come back to it next week.
In this map we're looking from a little south of 30 N to a little
bit past 60 N.
Winds
blowing north from H
pressure at 30 N toward Low pressure at 60 N turn to the right and blow
from the SW. These are the "prevailing westerlies."
The polar easterlies are cold winds coming down from high pressure at
the north pole. The subpolar low pressure belt is found at 60
latitude. This
is also a convergence zone where the cold polar easterly winds and the
warmer prevailing westerly winds meet. The boundary between these
two different kinds of air is called the polar front and is often drawn
as a stationary front on weather maps. A strong current of winds
called the polar jet stream is found overhead. Strong middle
latitude storms will often form along the polar front.
Here's a map that shows all of the
3-cell model surface features
This is analogous to the cloud chart that you studied prior to the
last quiz. With a little practice you should be able to start
with a blank
sheet of paper and reproduce this figure.
We didn't finish the 3-cell model material because I wanted to
briefly explain the cause of the Coriolis force. Most
of
what
follows
can
be
found
on p. 122c in the photocopied ClassNotes.
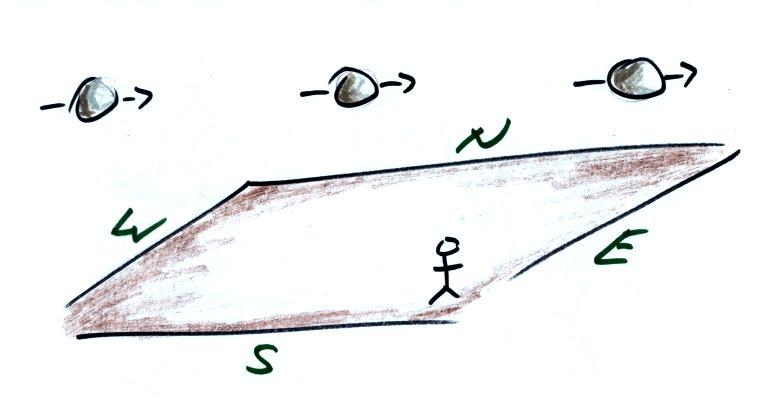
Imagine something flies
over Tucson (an
asteroid did fly by the earth on Tuesday). It
travels
straight from west to east at constant speed. The next figure
shows the path that
the object followed as it passed over the city. You would, more
or less subconciously, plot its path relative to the ground.
Here's the path the moving object
would appear to follow
relative to the ground. Based on this straight line,
constant speed trajectory you'd conclude there was
no net force acting on the object (and again no net force doesn't mean
there aren't any forces, just that they all cancel each other out so
the total force is zero).
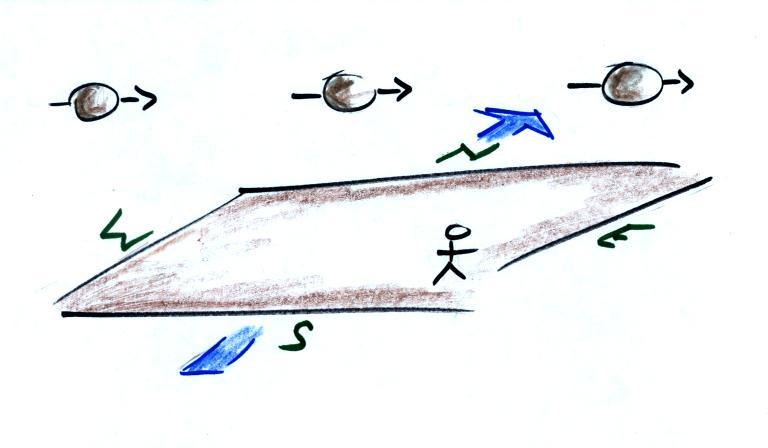
In this second picture the object
flies by overhead
just as it
did in the previous picture. In this picture, however, the ground
is moving (don't worry about what might be causing the ground to
move). What would you say happened when viewing the flyby from
the ground?
The path, relative to the ground, would look something like this.
It
would
no
longer
appear
to
be
moving
from
W
to E but rather from the NW toward
the SE.
It's
still straight line motion at constant speed, though, so you
conclude there was no net force acting on the object.
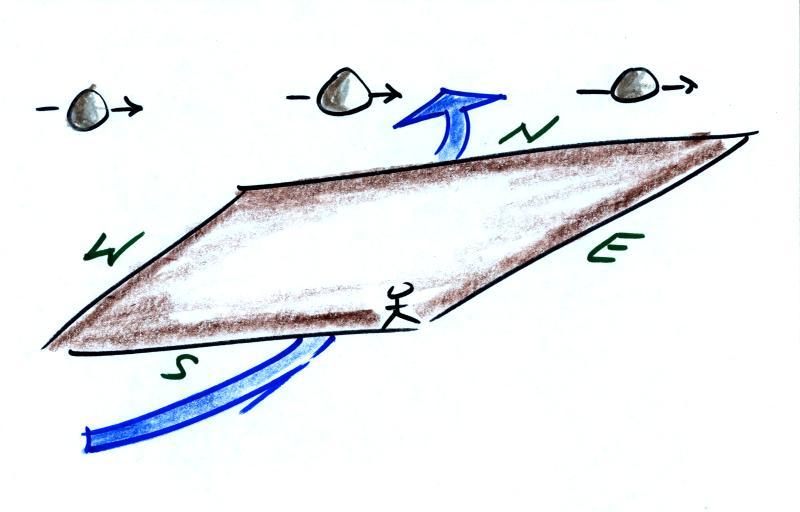
Now the ground is moving and
also spinning.
The path of the object plotted
on the ground appears to be
curved. But remember that's relative to the ground and the ground
is spinning. We could take that into account or just ignore
it. In the latter case you'd conclude that
there was a net force
perpendicular and to the right of the moving object. This net
force would be needed to explain the curved path that the object
appears to be
following.
At most locations on the earth the
ground
IS
rotating. This
is
most easily seen at the poles.
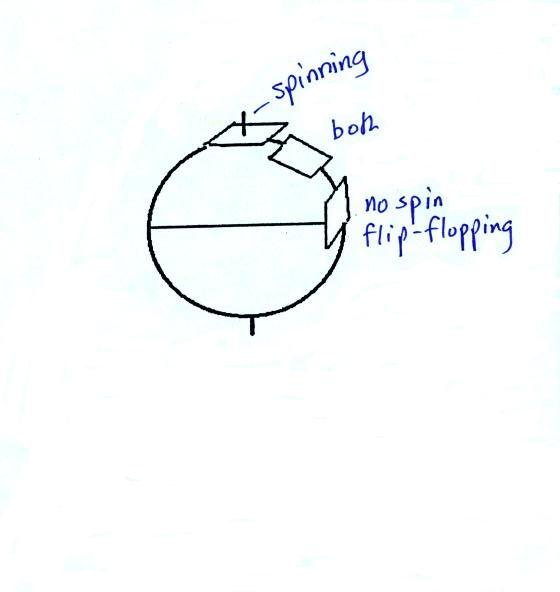
Imagine a piece of paper glued to
the top of a globe.
As the
globe spins the piece of paper will rotate. A piece of paper
glued to the globe at the equator won't spin, it will flip over.
At points in between the paper would spin and flip, the motion gets
complicated.
The easiest thing for us to do is to ignore or forget about the
fact that the
ground on
which we are standing is rotating. We do still need to account
for the curved paths that moving objects will take when they
move relative to the earth's surface. That is what the Coriolis
force does.
And that's the reason for another 1S1P
Bonus
Assignment. Foucault's Pendulum was the first demonstration
that proved that
the ground we're standing on (at most
locations on earth) is spinning. Here's a photograph of a
Foucault Pendulum at the Pantheon
in Paris (Foucault conducted his demonstration apparently at the Paris
Observatory).
This is a logical point to clear up a common misconception
involving the Coriolis force. You
might have
heard
that
water
spins
in
a
different
direction
when
it
drains from a sink or a toilet bowl in the southern hemisphere
than it does in the northern hemisphere. You might also have
heard that this is due to the Coriolis force or the Coriolis
effect.
The Coriolis force does
cause winds to spin in opposite directions around large scale high and
low pressure
centers in the northern and southern hemisphere. The
PGF starts the air moving (in toward low, out and
away from high pressure) then the Coriolis force bends the wind to the
right (N. hemisphere) or to the left (S. hemisphere).
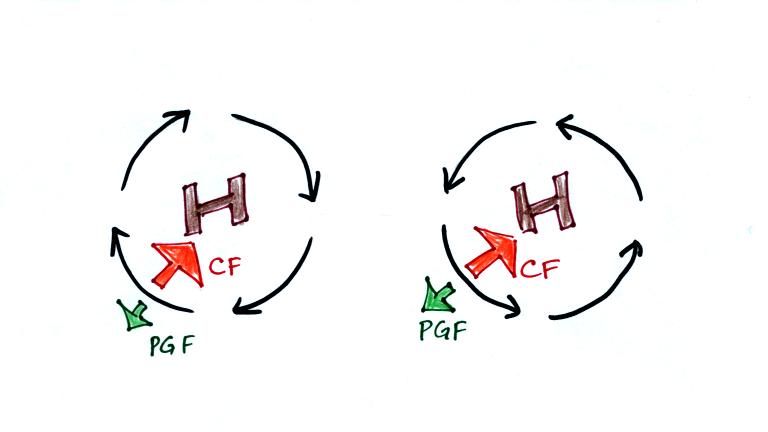
Here's what you end up with in the case of low pressure (you'll find
these figures on p. 130 in the photocopied ClassNotes):
Air starts to move inward toward
low pressure (the dots show this initial motion). Then
the
Coriolis force causes it to turn to the right or left depending on
which hemisphere you're in. You should be able to say which of
the pictures above is the northern hemisphere and which is the southern
hemisphere picture.
The same kind of idea applies to
high
pressure except that the air starts moving outward (the dots
aren't included here). The Coriolis
force then turns it to the right or left.
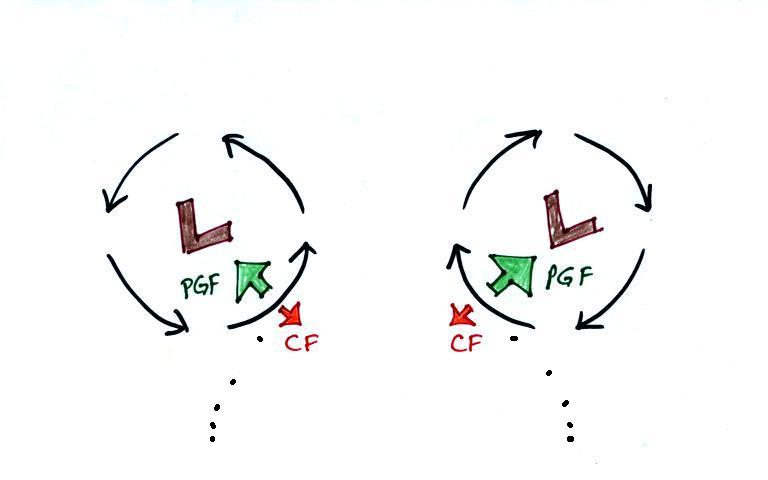
There are situations where the PGF is much stronger
than
the
CF and the CF can be ignored.
A
tornado
is
an
example.
The
PGF
is
much
much
stronger
than
the
CF
and the CF can be
ignored.
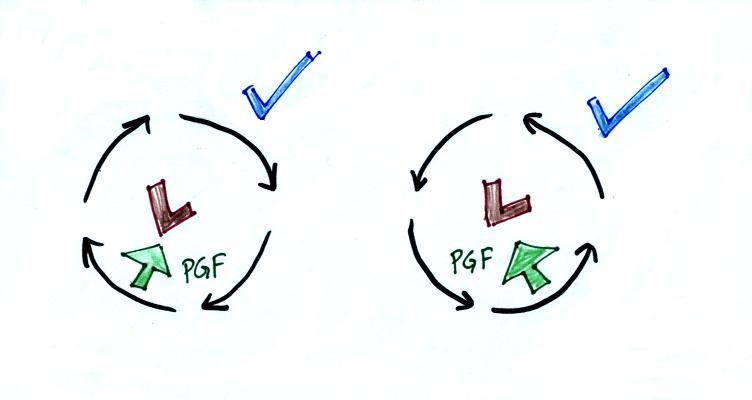
Winds
can
blow
around
Low
pressure
because the PGF points inward.
The wind can
spin in either direction in either
hemisphere.
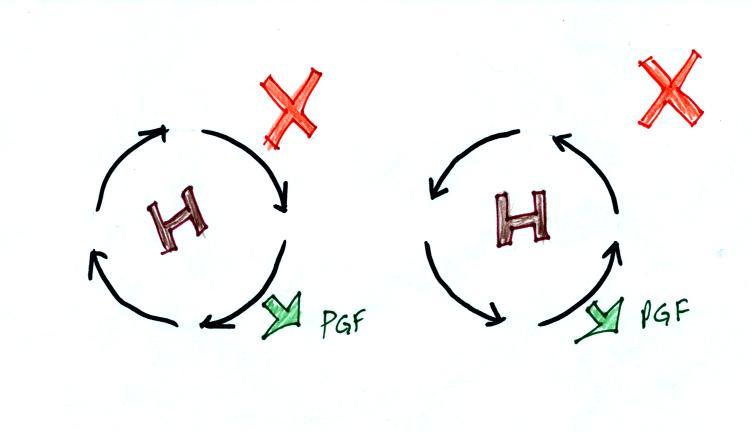
Note that without the CF, winds can't spin around High
pressure because
there is nothing to provide the needed inward force.
OK, what about water draining from
sinks, buckets, toilets etc.
There's just an inward pointing
PGF, no
CF. Water can spin in either direction in either
hemisphere. What causes the inward pointing PGF? The water
at the end of the spinning water is a little deeper than in the
middle. Since pressure depends on weight, the pressure at the
outer edge of the spinning water is higher than in the center.
Water draining from a sink or toilet can spin in
either direction. It doesn't matter where you're located.
But this something we should probably checkout for ourselves, so here
is one of my favorite
optional assignments of the semester.