Tuesday Sept. 27, 2011
click here to
download today's notes in a more printer friendly format
I kind of liked a song that I heard during a Lowe's commercial on
TV the other night. Turns out it was "Don't Stop" and
was sung by Gin Wigmore. I downloaded a few more of her songs
for class today ("I
Do", "Oh
My" and "Hey Ho")
The quizzes have been graded and were returned in class this
morning. Please check carefully to be sure they were graded
correctly.
A new Optional
Assignment on upper level charts is now available. You can
earn extra credit and a Green Card.
It
is
due
at
the
start
of class on Thu., Oct. 6. A new 1S1P
Bonus Assignment is also now
available. It involves more analysis of a surface weather map
than writing a report. It is also due Thu., Oct. 6.
The 1S1P reports on Ozone were due today. It might be a
while before you get those back, I'm frantically trying to finish
grading the Expt. #1 reports so that I can return them on
Thursday. Then my TAs and I will get started on the 1S1P
reports. The last of the Assignment #1 reports is due next
Tuesday.
Here's a quick review of where we left off before last Thursday's
quiz. We were looking at
what can be learned once isobars (pressure contours) are drawn on a
surface weather map.
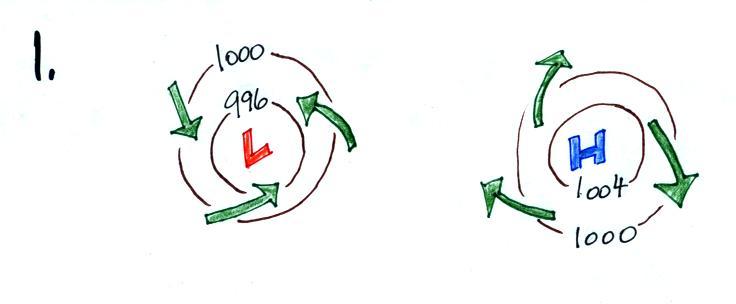
Isobars allow you to locate surface centers of High and Low
pressure. Winds spin counterclockwise around and spiral inward
toward low pressure. The converging winds rise in the
middle. Rising air expands and cools. If the air is moist
and there is sufficient cooling, clouds can form.
Winds spin clockwise and spiral ouward from high pressure. The
diverging surface winds cause sinking air motions in the center of the
high. Sinking air is compressed and warms. This keeps
clouds from forming.
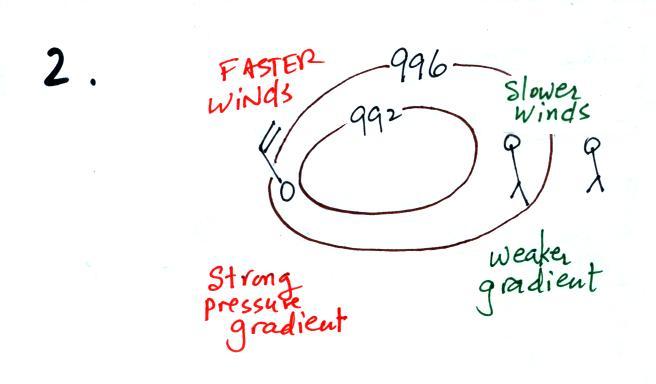
We also learned that contour
spacing provides some information about wind speed. Tightly
spaced contours indicate a strong pressure gradient and produce fast
winds. Slower winds are found where the contours are more widely
spaced (weaker pressure gradient).
Today we'll be learning about how the winds can affect large scale
temperature patterns. Winds will sometimes cause large air masses
with very different properties to collide. Fronts form along the
boundaries. We'll spend most of the class today learning about
warm and cold fronts. Before getting into that though it might be
a good idea of explain what an air mass is exactly and say something
about their properties and how they are named.
Just as wine can be red, white, dry, and sweet, air can be
dry or moist, hot or cold.
An air mass is just a large body of air, usually about 1000 miles
across and only 1 mile or so thick. As you move horizontally
through the air mass you would find that its characteristics remain
fairly constant.
The 4 main air mass types are named by combining the characteristics
above:
continental
Polar
(cP) air masses are cold and dry and form over land at
high latitude
(the ground may be covered with
snow or ice)
maritime Polar (mP) air
masses form over ocean water at high latitude.
continental Tropical (cT)
air masses are warm (hot) and dry (not as dry as cP)
maritime
Tropical
(mT) air masses form over warm ocean water.
As we will see warm air can
contain more moisture than cooler air, thus mT air masses can produce
large amounts of precipitation.
We'll mainly be interested in the collisions between two different air
masses along fronts (a continental Polar (cP) air mass might collide
with warm moist martime Tropical (mT) air along a cold front, for
example, and produce strong tornadic thunderstorms)
The 4 main air masses are perhaps
best illustrated on a map. The figure above shows typical source
regions for the main air mass types. Note the continental US is
not a good source region - its terrain is too varied. The US
however is where different air masses can collide.
Now back to surface weather maps.
3.
The
pressure pattern on a surface map determines the wind direction and
wind
speed. Once the winds start to blow they can affect and change
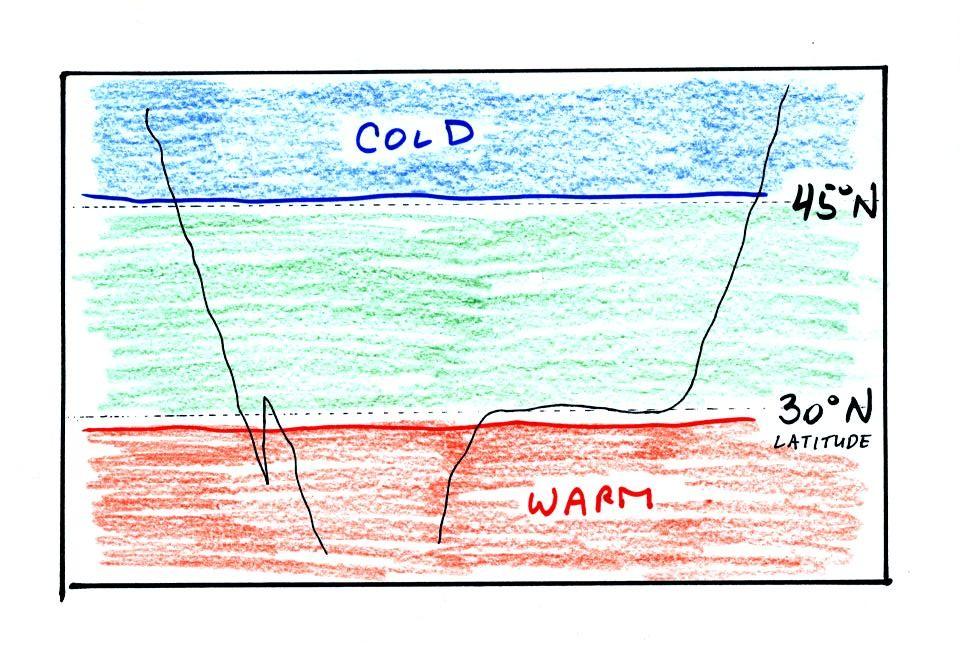
the temperature pattern. The figure below shows the
temperature pattern you would
expect to see if the wind wasn't blowing at all or if the wind was
just blowing straight from west to east. The bands of different
temperature are aligned parallel to the lines of latitude.
Temperature changes from south to north but not from west to
east.
This
picture
gets a
little
more interesting if you put centers of high or low pressure in the
middle.
The clockwise spinning winds
move warm air to
the north on
the western
side of the High. Cold air moves toward the south on the eastern
side of the High. The diverging winds also move the warm and cold
air away from the center of the High. Now you would experience a
change in temperature if you traveled from west to east across the
center of the picture.
Here's what happens with low pressure. Counterclockwise
winds move cold
air toward the south
on the
west side
of the Low. Warm air advances toward the north on the eastern
side of the low.
The converging winds in the case of low pressure will move the air
masses of different temperature in toward the center of low pressure
and cause them to collide with each other. The boundaries between
these colliding air masses are called fronts. Fronts are a second
way
of causing rising air motions (that's important because rising air
expands and cools, if the air
is moist clouds can form).
Cold air is moving from north toward the south on the
western side of
the low. The leading edge of the advancing cold air mass is a
cold front. Cold fronts are drawn in blue on weather maps.
The small triangular symbols on the side of the front identify it as a
cold front and show what direction it is moving. The fronts are
like spokes on a wheel. The "spokes" will spin counterclockwise
around the low pressure center (the axle).
A warm front (drawn in red with half circle symbols) is shown on
the
right hand side of the map at the advancing edge of warm air. It
is also rotating counterclockwise around the Low.
The storm system
shown in the picture above (the Low together with the fronts) is
referred to
a middle latitude storm or an extratropical cyclone
(extratropical means outside the tropics, cyclone means winds spinning
around low pressure). These storms form at middle latitudes
because that is where air masses coming from the polar regions to the
north and the more tropical regions to the south can collide.
You mostly just find warm air in the tropics. Large
storms also
form there; they're called tropical cyclones or, in our part of the
world, hurricanes.
Clouds can form along fronts (often
in a fairly narrow band along
a
cold front and over a larger area ahead of a warm front). We need
to look at the crossectional structure of warm and cold fronts to
understand better why this is the case.
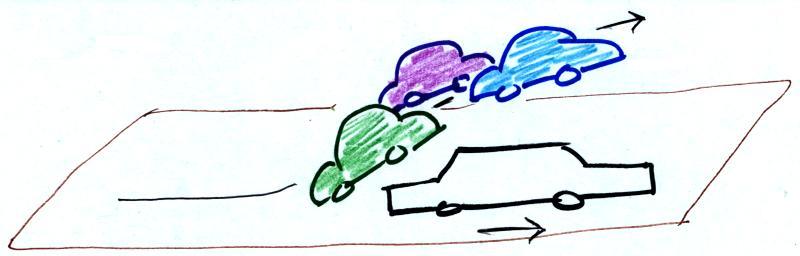
The top picture below shows a crossectional
view of a cold front
At the top of the figure, cold
dense air on the left is
advancing into
warmer lower density air
on the right. We are looking at the front advancing edge of the
cold air
mass, note the blunt shape. The front edge of the cold
air mass "bunches up" like this because of friction as it moves across
the
ground. The warm low density air is lifted
out of the way
by the cold air. The warm air is rising.
The lower figure shows an analogous situation, a big heavy
Cadillac
plowing into a bunch of
Volkswagens. The VWs are thrown up into the air by the Cadillac.
We watched a couple of short video segments at this point.
The
first used colored liquids with slightly different densities (a
water/glycerin mixture) to show
how a cold air mass can lift a warmer, less dense air mass. The
video
segment also tried to show how warm air overruns a receding mass of
colder denser air. The second video was a time lapse movie of an
actual cold front that passed through Tucson on Easter Sunday, April 4,
in 1999. It actually snowed for a short time during the passage
of the cold front. Click here
to see the cold front video (it may take a minute or two to transfer
the data from the server computer in the Atmospheric Sciences Dept., be
patient). Remember the video shows a time
lapse movie of the frontal passage. The front seems to race
through Tucson in the video, it wasn't moving as fast as the video
might lead you to believe. Cold fronts typically move 15 to 25
MPH.
Let's have a quick look at how warm fronts work just to try to
begin to understand how they differ from cold fronts.
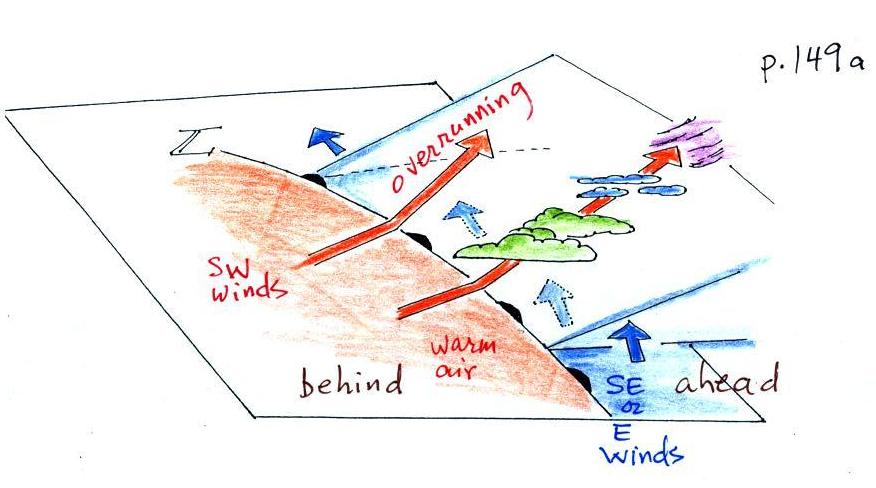
Here's a warm front in crossection (top) and the
Volkswagen/Cadillac analogy. First we see it is the warm air that
is invading and catching up to some colder air that might be slowly
moving out of the way. We're looking at the back, retreating edge
of the cold air mass now.
The warm air still has lower density than the cold air. So when
the warm air catches the colder air it won't wedge its way underneath
and lift the colder air. The VWs are not going to throw the
Cadillac into the air when they collide.
The VWs run up and over the
Cadillac. The warm air overruns the colder air mass.
Something else to notice is the shape of the back edge of the cold
air mass which has a ramp like shape.
A picture might make clearer the distinction between the front
advancing edge of cold air that you see with a cold front and the back
retreating edge of cold air found at a warm front.
Imagine pouring something gooey
like honey or syrup onto a surface
with a slight slope. The gooey stuff will ooze downhill.
Friction
will cause the front edge to bunch up; this is what you see with
a
cold front. The back edge gets drawn out. This is the
gradual ramp
like shape we see with a warm front.
(If you were to try this experiment instead of imagining it and
were to take a picture I'd be happy to give you a Green
Card for your efforts)
Now we'll go back to cold fronts and try to understand better what
kinds of weather changes might occur as they approach and pass through.
Here's a 3-D/crossectional view of a cold
front is shown below (we've jumped to p.
148a in the photocopied ClassNotes)
The person in the figure is positioned ahead of an approaching cold
front. It might be the day before the front actually passes
through.
The warm air mass ahead of the front has just been sitting there and
temperatures are pretty uniform throughout. The air behind the
front might have originated in Canada. It might have started out
very cold but as it travels to a place like Arizona it can change
considerably. The air right behind the front will have traveled
the furthest and changed the most. That's the reason for the
cool, cold, and colder temperature gradient behind the front.
Here are some of the specific weather changes that might precede and
follow a cold front
Weather
variable
|
Behind
|
Passing
|
Ahead
|
Temperature
|
cool, cold, colder*
|
|
warm
|
Dew Point
|
usually much drier
|
|
may be moist (though that
is often
not the case here in the desert southwest)
|
Winds
|
northwest
|
gusty winds (dusty)
|
from the southwest
|
Clouds,
Weather
|
clearing
|
rain clouds, thunderstorms
in
narrow band along the front
(if the warm air mass is moist)
|
might see some high clouds
|
Pressure
|
rising
|
reaches a minimum
|
falling
|
*
the
coldest
air
might
follow
passage
of a cold front by a day
or two. Nighttime temperatures often plummet in the cold dry air
behind a cold front.
A temperature drop is probably the most obvious change associated with
a cold front. Here is southern Arizona, gusty winds and a wind
shift are also often noticeable when a cold front passes.
The pressure changes that precede and follow a cold front are not
something we would observe or feel but are very useful when trying to
locate a front on a weather map.
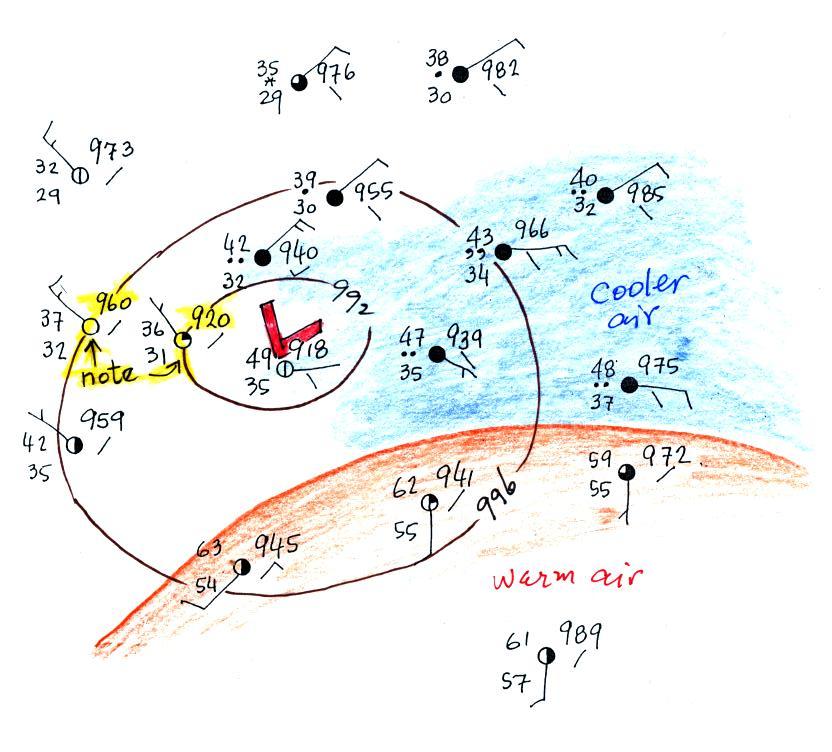
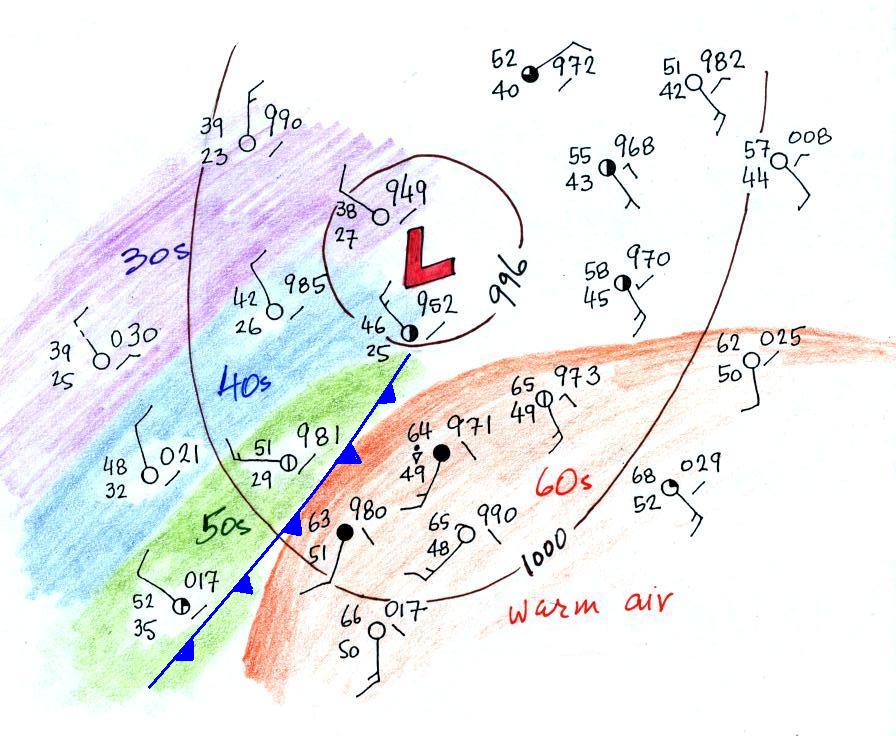
In the next figure we started with
some weather data
plotted on a
surface map using the station model notation. We'll try to make a
little more sense of this data.

Before trying to locate a cold front, we needed to draw in a few
isobars and map out the pressure pattern. In some respects fronts
are like spokes on a wheel - they rotate counterclockwise around
centers of low pressure. It makes sense to first determine the
location of the low pressure center.
Isobars are drawn at 4 mb increments above and below a starting value
of 1000 mb. Some
of the allowed values are shown on the right side of the figure (992,
996, 1000, 1004, 1008 etc).
The highest pressure on the map is 1003.0 mb, the lowest is 994.9
mb. You must choose from the allowed list of isobar values and
pick only the values that fall between the high and low pressure values
on the map. Thus we have drawn in 996 mb and 1000 mb
isobars (you can get a better idea of how to actually draw in the
isobars by looking at the 1S1P Bonus Assignment
Example Analysis.

The cold front on the map seems to be properly postioned. Note
how
the
cold
front
is
positioned
at
the leading edge of the cold air mass, not necessarily in
front of the coldest air in the cold air mass.
3
of
the
stations
from
the
bottom portion of the map have been redrawn
below.
The air
ahead of the front (Pts. B & C) is warm, moist, has winds blowing
from the S or SW,
and the pressure is falling. These are all things you would
expect to find ahead of a cold front.
Overcast skies are found at Pt. B. very near the front.
The air behind the front at Pt. A is colder, drier, winds are blowing
from the
NW, and the pressure is rising.
Now we'll do the same for a warm
front. Here's the 3-D/crossectional view
Here ae the weather
changes in advance of and following the frontal
passage.
Weather
Variable
|
Behind
(after)
|
Passing
|
Ahead
(before)
|
Temperature
|
warmer
|
|
cool
|
Dew point
|
may be moister
|
|
drier
|
Winds
|
from S or SW, maybe W
|
|
from S, SE, even the E
|
Clouds, Weather
|
clearing
|
|
wide variety of clouds that
may precede arrival of the front by a day or two
may be a wide variety of types of precipitation also (snow, sleet,
freezing rain, and rain)
|
Pressure
|
rising
|
minimum
|
falling
|
Probably the key
difference between warm and cold fronts (other than a cold-to-warm
rather than a warm-to-cold change) is the wide variety of clouds that a
warm front cause to form cover a much larger area out ahead of the
front. Clouds associated with a cold front are usually found in a
fairly narrow band along the front.
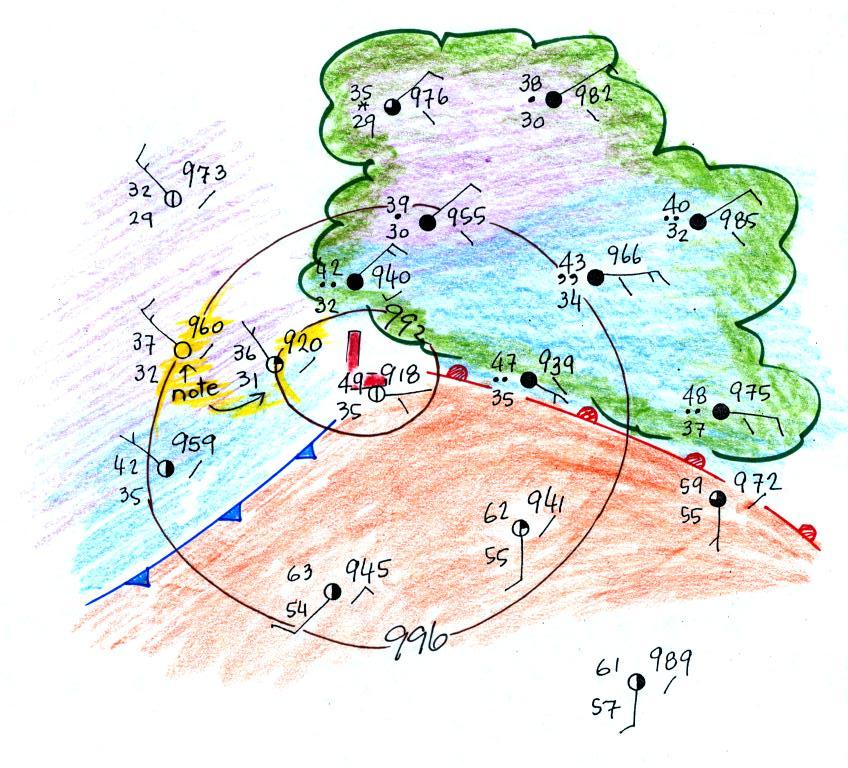
Now let's try to locate a warm
front on the following surface map
We start by locating the highest
and lowest pressure values on the map. Then we choose allowed
isobar values that fall between these limits. In this case we'll
need to draw 992 mb and 996 mb isobars.
Note that the 992 and 996 mb
isobars each went through a station with pressures of exactly 992.0 and
996.0 mb (highlighted in yellow). The warm air mass has been
colored in orange. Cooler air east of the low pressure center is
blue. Can you see where the warm front should go?
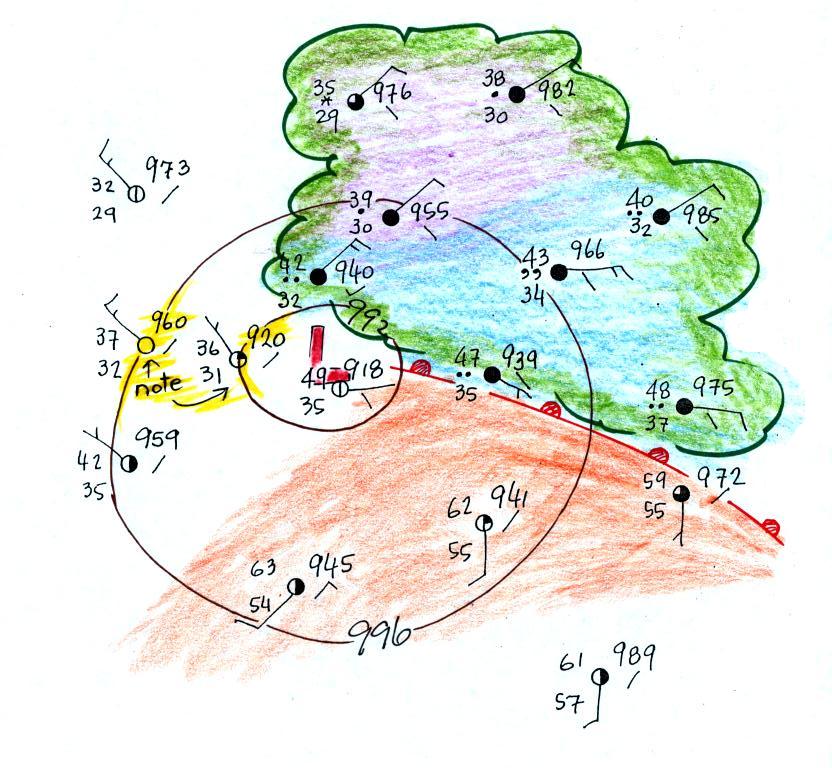
The station north of the front has cooler and drier air, winds are
from the east, skies are overcast and light rain is falling. The
pressure is falling as the warm front approaches. These are all
things you'd expect to find ahead of a warm front. Behind the
front at the southern station pressure is rising, the air is warmer and
moister, winds have shifted to the south and the skies are starting to
clear.
Here's the picture again with something more drawn in.
There's pretty good evidence of a cold front on the left portion
of the map.
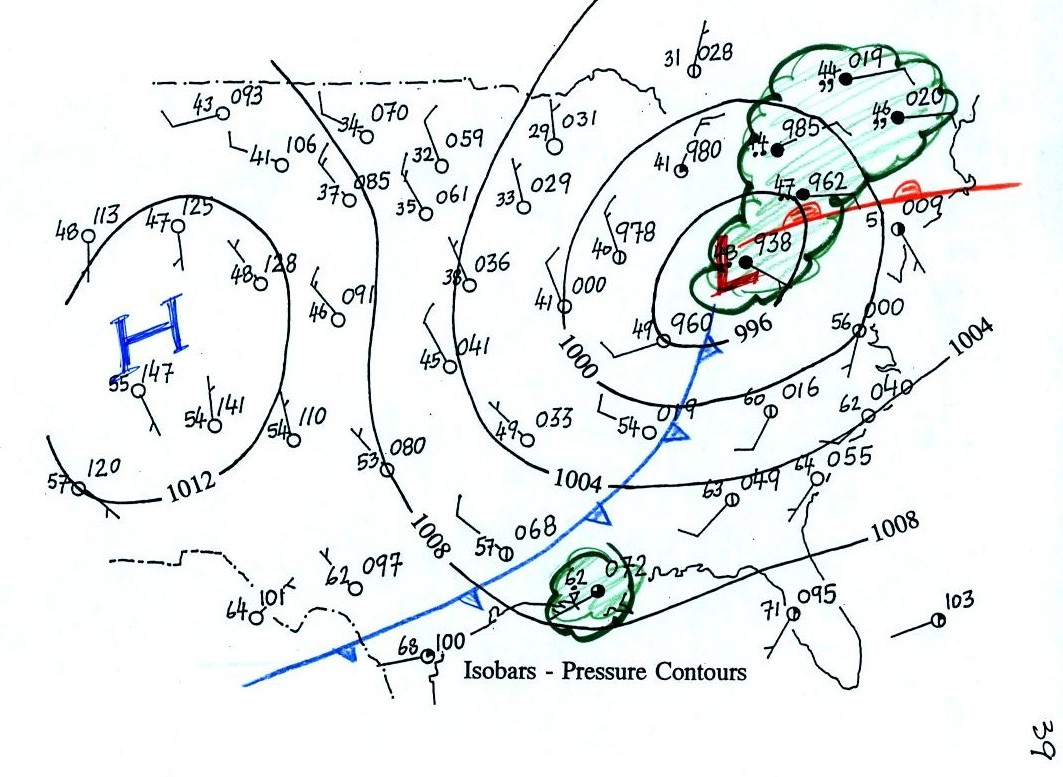
One last picture and this is something that wasn't shown in
class. We go back to the map on p. 39 in the ClassNotes.
One of the questions we had was what might be causing the clouds,
rain, and drizzle in the northeastern part of the country, and the rain
shower along the Gulf Coast. The cold front is almost certainly
the cause of the rain shower and much of the wet weather in the NE is
probably being caused by the warm front.
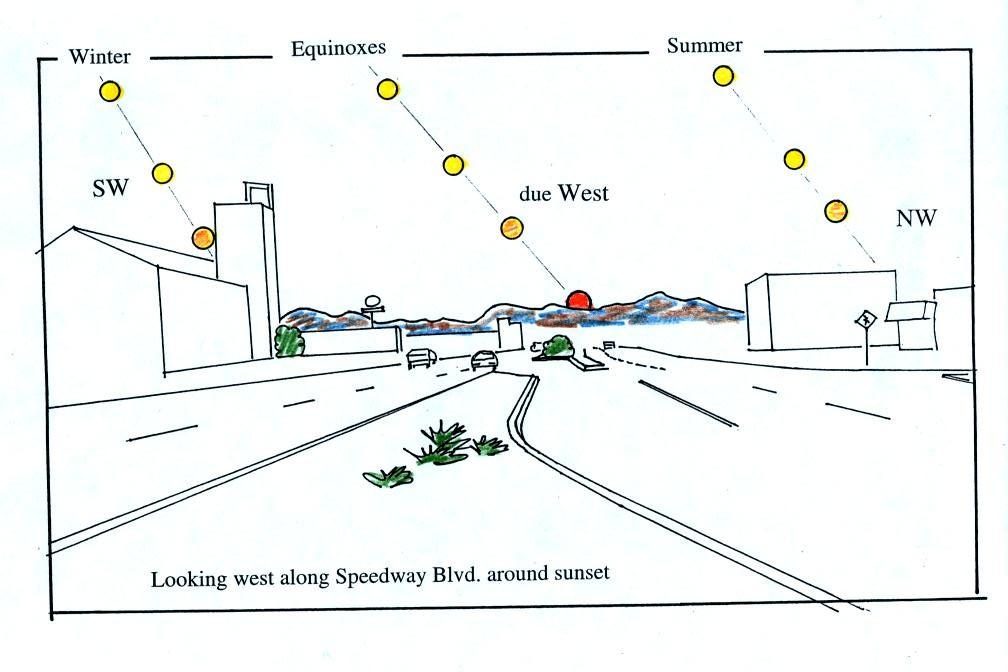
Finally a little information about
the Fall Equinox which was last Friday (Sept. 23). One of the
things that happens on the Equinoxes (there's also a Spring Equinox on
or about Mar. 21) is that the sun rises exactly in the east and sets
exactly in the west. This is the 8 am class. You might be
up in time to see the sunrise. Most of you are able to see the
sun set. The figure below shows you about what you would see if
you
looked west on Speedway (from Treat Ave.) at sunset. In the
winter the sun will set south of west, in the summer north of west
(probably further south and north than shown here). On the
equinoxes the sun sets exactly in the west.
Several years ago I
positioned myself in the median near the
intersecton of Treat and Speedway and pointed my camera west. I
took a multiple exposure photograph of the sun over a 2 hour period
that ended at sunset. I'll bring the slide photograph to
class one of these days.
Something else to note in this figure and something I didn't
mention in class. Note how the sun is changing
color. It changes from a bright yellow white to almost red by the
time it sets.. This is due to scattering of sunlight by
air. The shorter wavelengths (violet, blue, green) are scattered
more readily than the longer wavelengths. At sunset the rays of
sunlight take a much longer slanted path through the atmosphere and
most of the shorter wavelengths are scattered and removed from the beam
of sunlight.
If you aren't
careful, you can get yourself seriously
injured,
even
killed,
on
or around the equinoxes. Here's
an article that appeared in the Arizona Daily Star last Thursday (Sep.
22).
There
were a few parents in the Sect. 1 class last Friday because it was also
the start
of Parent's Weekend. One of the parents came up to the front
after class and mentioned seeing the sun right at the end of 77th St.
in New York City around this time of year. That got me thinking
that a picture of sunset at the end of one of the long streets with all
the tall buildings might be spectacular.
When I started looking however I found that the major streets in
Manhattan aren't oriented EW and NS. You can see this on a Google
map
of
Manhattan. 77th St. is oriented in more of a NW-SE
direction. You won't see the sun set at the west end of 77th St
on the equinox. However between the Spring and Fall Equinoxes
sunset will move north of west. It will be furthest north on the
summer solstice (June 21). Then I stumbled on the this Manhattanhenge
map which shows the direction of sunset (the left, west,
side of the map) and sunrise (the right, east, side of the map) at
various times of the year. On May 31 this year the sun did set
right at the west end of 77th St. (and any other street with the same
NW-SE orientation). It happened again on July 12 or 13 (maybe
both nights). And apparently it is quite an event. An
article with several Manhattanhenge
photographs from the May 31 event appeared in a story on
the Business Insider webpage. The "henge" part of the
name comes from Stonehenge where the rising and setting sun aligns with
stones on the solstices.
The other thing that happens on the Equinoxes is that the days and
nights are each 12 hours long. I didn't mention
this or show the following figure in class.
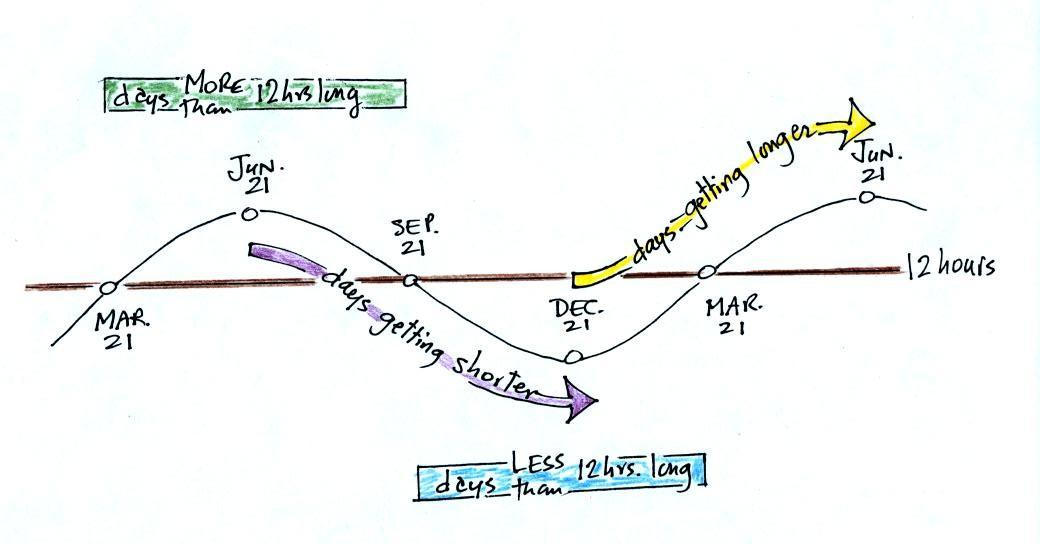
June 21, the
summer solstice, is the longest
day
of the
year (about 14 hours of daylight in Tucson). The days have slowly
been getting shorter since then. The rate of change is greatest at the
time of the equinox.
This will continue up until December
21,
the winter solstice, when there will be about 10 hours of
daylight. After that the days will start to lengthen as we make
our way back to
the summer solstice.


