Thursday Sep. 5, 2013
click here to download today's notes in a more printer friendly format

I was reminded of Lake Street Dive, today's featured artists, while looking through some notes from the Spring 2013 semester.  You heard 3 of the following 4 songs before class today:  HenrietteYou Go Down SmoothElijah, and  Use Me Up.

The Practice Quiz is 1 week from today and a Practice Quiz Study Guide is now online.  You should expect a study guide to appear about 1 week before each of this semester's quizzes.  Reviews are currently being scheduled for Tuesday and Wednesday afternoon before next Thursday's quiz.

A 3rd topic has been added to 1S1P Assignment #1.  You can write up to 2 reports as part of this assignment.  I'm hoping to get a Bonus Assignment online in the next day or so.


A large city like Tucson is required to continuously measure concentrations of several air pollutants.  The main ones are shown below (see the top of p. 8 in the ClassNotes).


The concentration of lead in air has decreased significantly since lead was removed from gasoline (the following quote is from a Wikipedia article on gasoline: "In the US,standards to phase out leaded gasoline were first implemented in 1973 ..... In 1995, leaded fuel accounted for only 0.6% of total gasoline sales ...... From 1 January 1996, the Clean Air Act banned the sale of leaded fuel for use in on-road vehicles. Possession and use of leaded gasoline in a regular on-road vehicle now carries a maximum $10,000 fine in the US.")

In Tucson, carbon monoxide, ozone, and particulate matter are of primary concern and daily measurements are reported in the city newspaper.  Let suppose a CO concentration of 4.5 ppm (8 hour average) was measured yesterday in Tucson.  Would this be an acceptable or hazardous value?  Most people wouldn't be able to answer that question.  So rather than report the actual measured values, an Air Quality Index value is reported instead.    The AQI is the ratio of the measured to accepted concentrations multiplied by 100%.


If we plug in the 4.5 ppm value mentioned above for carbon monoxide, the AQI value would be


The air quality in this case would be good.  Air becomes unhealthy when the AQI value exceeds 100%.
  The units "ppm", by the way, stand for "parts per million."  A CO concentration of 4.5 ppm would mean that in 1 million air molecules 4.5 of them would be carbon monoxide.


Current Air Quality Index values for Tucson are available online.


Carbon monoxide is a serious hazard indoors where is can build to much higher levels than would ever be found outdoors.  This next link is to a newspaper article describing
an incident at Virginia Tech (that occurred near the beginning of the school year in 2007).   Carbon monoxide from a malfunctioning hot water heater sickened 23 Virginia Tech students in an apartment complex.  The CO concentration is thought to have reached 500 ppm. 
You can get an idea of what kinds of symptoms and effects that concentrations this high could cause from the figure. on p. 9 in the photocopied ClassNotes.


You would begin to show symptoms of carbon monoxide exposure (headache, dizziness, nausea) after breathing 400 ppm CO concentration after about 1 hour.  After several hours exposure you would approach the level where CO would cause coma and death.  At Virginia Tech several students were found unconscious and one or two had stopped breathing but they were revived.

Carbon monoxide alarms are relatively inexpensive (~$50) and are available at most hardware stores.  They will monitor CO concentrations indoors and warn you when concentrations reach hazardous levels. Indoors CO is produced by gas furnaces and water heaters that are either operating improperly or aren't being properly vented to the outdoors.  A few hundred people are killed indoors by carbon monoxide every year in the United States.  An operating carbon monoxide alarm probably saved the lives of the 6 Tucson residents in December 2010.  You can learn more about carbon monoxide hazards and risk prevention at the Consumer Product Safety Commission web page.


Time now to turn a 3rd air pollutant - sulfur dioxide (SO2 ).


Sulfur dioxide is produced by the combustion of sulfur containing fuels such as coal.  Combustion of fuel also produces carbon dioxide and carbon monoxide.  People probably first became aware of sulfur dioxide because it has an unpleasant smell.  Carbon dioxide and carbon monoxide are odorless.  That is most likely why sulfur dioxide was the first pollutant people became aware of. 

I double checked on the smell of sulfur dioxide after class and found two descriptions: one described it as the smell of rotten eggs (I associate that with hydrogen sulfide,
H2S, which is also poisonous) but also a pungent irritating odor which is what I remember.  Apparently sulfur dioxide is one of the smells in a freshly struck match.

Volcanoes are a natural source of sulfur dioxide.


Sulfur dioxide has been involved in some of the world's worst air pollution disasters.  If not the deadliest, The Great London Smog of 1952 is in the top two or three.  Because the atmosphere was stable, SO2 emitted into air at ground level couldn't mix with cleaner air above.  The SO2 concentration was able to build to dangerous levels.  4000 people died during this 4 or 5 day period.  As many as 8000 additional people died in the following weeks and months.

Some of the photographs below come from articles published in 2002 on the 50th anniversary of the event.
 

from:
http://news.bbc.co.uk/1/hi/uk/2542315.stm


from:
http://news.bbc.co.uk/1/hi/health/2545747.stm

from:
http://news.bbc.co.uk/1/hi/england/2543875.stm


from:
http://www.npr.org/templates/story/story.php?storyId=873954

The sulfur dioxide didn't kill people directly. 
Rather it would aggravate an existing condition of some kind.  The SO2 probably also made people susceptible to bacterial infections such as pneumonia.  Here's a link that discusses the event and its health effects in more detail.

Some other air pollution disasters also involved high SO2 concentrations.  One of the deadliest events in the US occurred in 1948 in Donora, Pennsylvania.


"This eerie photograph was taken at noon on Oct. 29, 1948 in Donora, PA as deadly smog enveloped the town. 20 people were asphyxiated and more than 7,000 became seriously ill during this horrible event." 

The photograph below shows some of the mills that were operating in Donora at the time.  The factories were not only emitted pollutants into the air but probably also discharging pollutants into the river.
from: http://oceanservice.noaa.gov/education/kits/pollution/02history.html


from: http://www.eoearth.org/article/Donora,_Pennsylvania

"When Smoke Ran Like Water," a book about air pollution is among the books that you can check out, read, and report on to fulfill part of the writing requirements in this class (though I would encourage you to do an experiment instead).  The author, Devra Davis, lived in Donora Pennsylvania at the time of the 1948 air pollution episode.  Another book that I've just learned about "Killer Smog: The World's Worst Air Pollution Disaster" by William Wise is an account of the London Smog of 1952 (I don't yet have a copy of that book)

Sulfur dioxide is one of the pollutants that can react with water in clouds to form acid rain (some of the oxides of nitrogen can react with water to form nitric acid).  The formation and effects of acid rain are discussed on p. 12 in the photocopied Class Notes.


Acid rain is often a problem in regions that are 100s even 1000s of miles from the source of the sulfur dioxide that forms the acid rain.  Acid rain in Canada could come from sources in the US, acid rain in Scandinavia came from industrialized areas in other parts of Europe. 

Note at the bottom of the figure above that natural "pristine" rain has a pH less than 7 and is slightly acidic.  This is because the rain contains dissolved carbon dioxide gas.  The acid rain demonstration described below and done in class should make this point clearer.


Some of the problems associated with acid rain.

Click on this acid rain demonstration link for a detailed description of the demonstration done in class.


The last pollutant that we will cover is Particulate Matter (PM) - small solid particles or drops of liquid (but not gas) that remain suspended in the air (particulates are sometimes referred to as aerosols). 

The designations PM10 and PM2.5 refer to particles with diameters less than 10 micrometers and 2.5 micrometers, respectively.  A micrometer (µm) is one millionth of a meter (10-6 m).   You'll find some actual pictures of micrometer sized objects and more information at this interesting source.  Red blood cells are 6-10
µm in diameterA nanometer (nm) is 1000 times smaller than a micrometer (10-9 m).  An atom is apparently 0.1 to 0.3 nm across, depending on the particular element.


Particulate matter can be produced naturally (wind blown dust, clouds above volcanic eruptions, smoke from lightning-caused forest and brush fires).  Human activities also produce particulates.  Gases sometimes react in the atmosphere to make small drops or particles (this is what happened in 
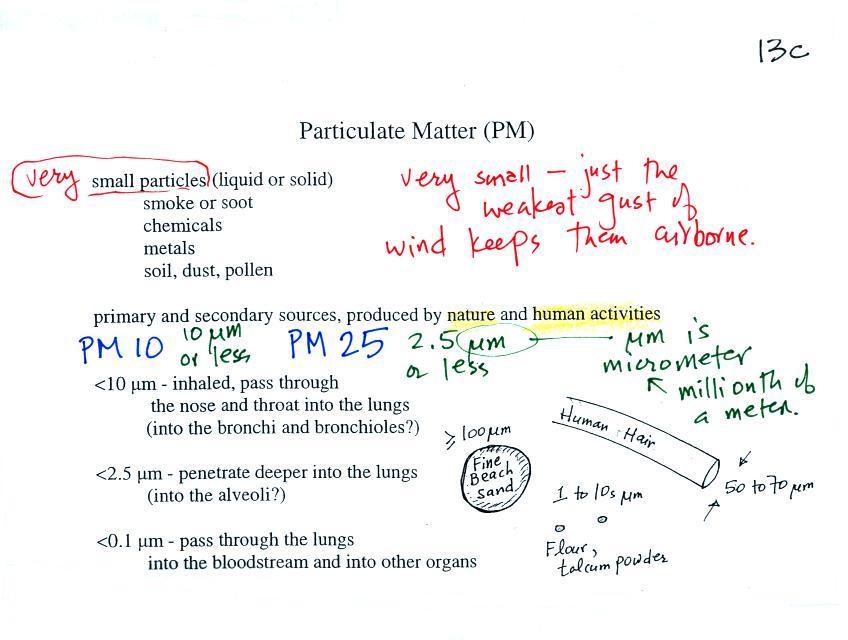
the photochemical smog demonstration).  Just the smallest, weakest gust of wind is enough to keep particles this small suspended in the atmosphere.

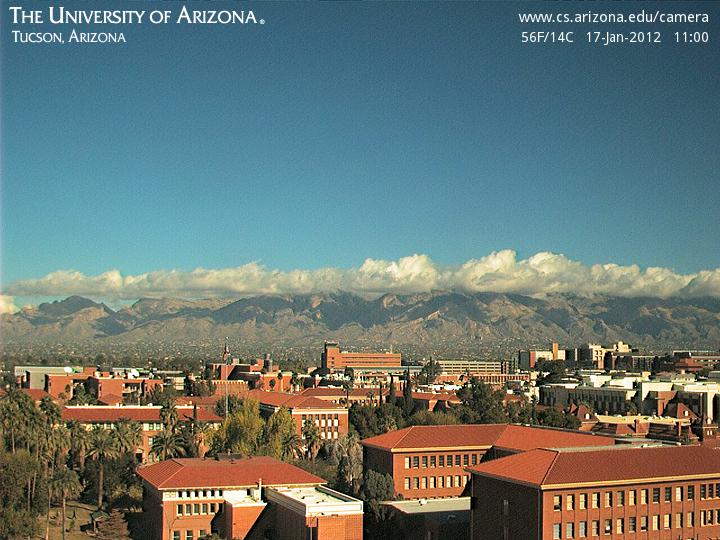
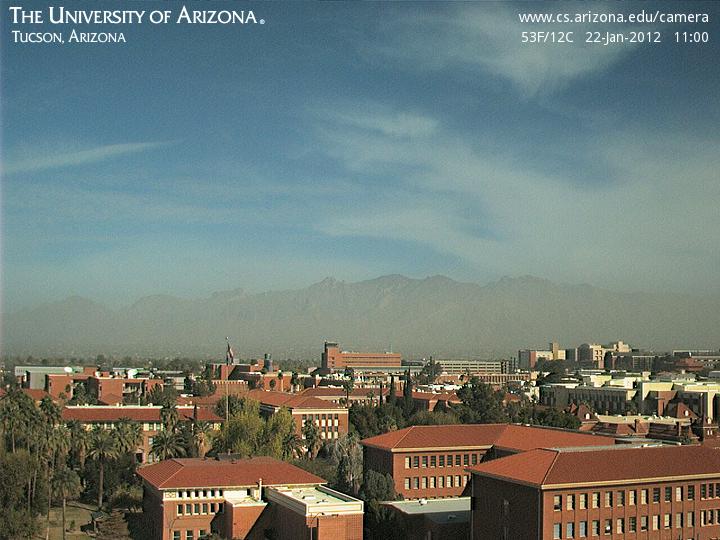
One of the main concerns with particulate pollution is that the small particles might be a health hazard ( a health advisory is sometimes issued during windy and dusty conditions in Tucson)

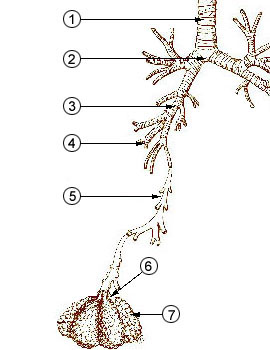
Particles with dimensions of 10 µm and less can be inhaled into the lungs (larger particles get caught in the nasal passages).  These inhaled particles may be poisonous, might cause cancer, damage lung tissue, or aggravate existing respiratory diseases.  The smallest particles can pass through the lungs and get into the blood stream (just as oxygen does) and damage other organs in the body.

The figure below identifies some of the parts of the human lung mentioned above. 


Crossectional view of the human lungs
from: http://en.wikipedia.org/wiki/Lung

1 - trachea
2 - mainstem bronchus
3 - lobar bronchus
4 - segmental bronchi
5 - bronchiole
6 - alveolar duct
7 - alveolus
from http://en.wikipedia.org/wiki/Image:Illu_quiz_lung05.jpg


The next couple of figures weren't covered in class.

Note the PM10 annual National Ambient Air Quality Standard (NAAQS) value of 50 micrograms/cubic meter (µg/m3) at the bottom of p. 13c in the photocopied ClassNotes. 

The following list (p. 13d in the ClassNotes) shows that there are several cities around the world where PM concentrations are 2 or 3 times higher than the NAAQS value.


The World Health Organization recommends that PM2.5 concentrations be kept below 25 µg/m3.  Particulate concentrations during an air pollution event in Beijing earlier this year apparently reached 886
µg/m3 at the US Embassy. (source).

In 2008 the Summer Olympics were in Beijing and there was some concern that the polluted air would affect the atletes performance.  Chinese authorities restricted transportation and industrial activities before and during the games in an attempt to reduce pollutant concentrations.  Rainy weather during the games may have done the greatest amount of good.


Clouds and precipitation are the best way of cleaning pollutants from the air.   We'll see later in the semester that cloud droplets form on small particles in the air called condensation nuclei.  The cloud droplets then form raindrops and fall to the ground carrying the particles with them.


The second main concern with particulates is the effect they may have on visibility (esthetics below should actually be spelled aesthetics - i.e. qualities that might make something appear beautiful or not).


Here's a view of the Catalina mountains taken from the Gould Simpson Building on the south side of campus.


Some rainy weather had occurred just a day to two earlier and the visibility was very good.

Windy weather a few days later stirred up a lot of dust that was carried into town. 


This photo was taken the day after the windy weather.  There is still a lot of dust in the air and the visibility is pretty bad.

Here are some pretty good pictures of the pollution in Beijing earlier this year and the effect it had on visibility.