Tuesday, Nov. 20, 2018
Wilsen "House on
a Hill" (0:30-5:26 = 5:00), "Sirens"
(4:13), Mandolin Orange "House of
Stone" (3:23), "There Was
a Time" (3:51), Mandy Fer & Dave McGraw "Seritony"
(4:53),
Black Prairie "Nowhere
Massachusetts" (3:32), Crooked Still "American
Tune" (3:25), Laura Marling "Blackberry
Stone" (3:31)
We'll be using page 155 and page 156 from the
Thunderstorms notes packet distributed last Thursday (copies will
again be available in class) and page 159a, page 159b, & page 160a from a new
Tornadoes notes packet that will be available in class on
Tuesday.
Here's a video
from a summer 2012 dust storm captured from the front window
of a vehicle that drove through the storm. Check the last
minute or two of the video where visibility drops to near zero
(about 9:00 minutes into the video). Officials recommend
that you drive off the highway under conditions like this, turn
off your lights, and take your foot off the brake so that your
brake lights are not on (otherwise someone might follow your
lights thinking you're still on the highway and run into you from
behind).
Microbursts
Thunderstorm downdraft winds can be a serious hazard whether they
stir up dust or not.
A narrow intense
thunderstorm downdraft is called a microburst. At the
ground microburst winds will sometimes reach 100 MPH or more
(over a limited area). As we will see most tornadoes have
winds of 100 MPH or less. Microburst winds can damage
homes (especially mobile homes that aren't tied to the ground),
uproot trees, and seem to blow over a line of electric power
poles at some point every summer in Tucson (the downed power lines may
remain energized). Wind damage from a microburst is
often incorrectly attributed to a tornado.
Microbursts
are a serious threat to aircraft especially during taking off or
landing when they are close to the ground. Microburst
associated wind shear was largely responsible for the crash of Delta
Airlines Flight 191 while landing at the Dallas Fort Worth
airport on Aug. 2, 1985 (caution some of the links at the end of
the article contain audio of actual cockpit communications).

Falling rain could warn of a
wet microburst (see photo below). In other cases, dangerous dry microburst winds might be
invisible (the virga, evaporating
rain, will cool the air, make the air more dense, and strengthen
the downdraft winds).
Here are a couple of microburst
videos. The first video
was taken in the heavy rain and strong winds under a
thunderstorm in the microburst. You'll see a power pole
snapped in half by the microburst winds at about 2:26 into the
video. We'll look at portions of a 2nd longer
video in class. It was taken in or near San Tan,
Arizona. The microburst doesn't look too impressive at the
start of the footage but the storm winds soon get pretty violent
(at about the 3:15 point in the video) and winds were strong
enough to break the trunks of at least one tree (6:45 into the
video). It is probably more common to see recently planted
trees uprooted.
Severe thunderstorms, wind shear, mesocyclones,
and wall clouds
Next we'll look at some of the conditions that can lead to
severe thunderstorm formation and some of the characteristics of
these storms. Severe thunderstorms last longer, grow bigger,
and become stronger than ordinary air mass thunderstorms.
They can also produce tornadoes.

Severe storms are more likely to form
when there is vertical wind shear (the picture above is on page 157 in the
ClassNotes). Wind
shear (Point 1)
is changing wind direction and/or wind speed with
distance. In the case shown above, the wind speed is
increasing with increasing altitude, this is vertical wind
shear.
A thunderstorm that forms in this kind of an environment will move (at perhaps the
average of the speeds at the top and bottom of the cloud) (Point 2). The
thunderstorm will move to the right more rapidly than the air
at the ground which is where the updraft begins. Rising
air that is situated at the front bottom edge of the
thunderstorm will find itself at the back edge of the storm
when it reaches the top of the cloud.
This produces a tilted updraft (Point 3). The downdraft
is situated at the back of the cloud. The updraft is
continually moving to the right and staying away from the
downdraft. The updraft and downdraft coexist and do not
"get in each others way." If you remember in air mass
thunderstorms, the downdraft gets in the way of the updraft
and leads to dissipation of the storm.
Sometimes
the tilted updraft will begin to rotate. A rotating
updraft is called a mesocyclone (Point
4). Meso
refers to medium size (thunderstorm size) and cyclone means
winds spinning around low pressure (tornadoes are sometimes
called cyclones). Low pressure in the core of the mesocyclone creates an inward pointing
pressure gradient force needed to keep the updraft winds
spinning in circular path.
The cloud that extends below the cloud
base and surrounds the mesocyclone
is called a wall cloud
(Point 5). The
largest and strongest tornadoes will generally come from the
wall cloud.
Note (Point 6)
that a tilted updraft also provides a way of keeping growing
hailstones inside the cloud. Hailstones get carried up
toward the top of the cloud where they begin to fall. But they then fall back into the strong core
of the updraft and get carried back up toward the top of the
cloud.
Here is a link to an exceptional time lapse video (http://www.mikeolbinski.com/timelapse/)
of a supercell thunderstorm in Texas from Mike Olbinski
again. Find the Supercell near Booker, Tx frame near the
bottom of the page. In time lapse you can see the rotation
of the wall cloud. If you watch closely you'll see another
interesting feature: moisture from air in the downdraft that
reaches the ground is drawn into the thunderstorm updraft
(starting at about 0:38 in the video up until the end of the first
segment of video). As the downdraft air moves upward cloud
begins to form.
It is worth trying to understand why the wall cloud surrounds the
mesocyclone and why it extends below the rest of the cloud.

Clouds form when air rises, expands, and cools as shown
above at left. The rising air expands because it is
moving into lower pressure surroundings at higher
altitude. Only when the air has risen high enough,
moved into low enough pressure, expanded and cooled enough
will a cloud form. Just for the purposes of
illustration we'll assume that once air has traveled from
the ground to 900 mb pressure higher up it will have
expanded and cooled enough for a cloud to form.
Air in the center of the rotating updraft has a little
lower pressure than the air surrounding it at the same
altitude. I've assumed that the pressure in the middle
of the mesocyclone at cloud base altitude is 890 mb. In
this part of the picture 900 mb pressure is found a little bit
closer to the ground. Thus air that rises into the
rotating updraft doesn't have to go as high before it
encounters 900 mb pressure and has expanded and cooled enough
to form a cloud.
A similar kind of thing happens in the formation of a tornado
cloud.
Weather radar and "hook
echoes"
Thunderstorms with rotating updrafts and supercell thunderstorms
often have a distinctive radar signature called a hook echo.
This is one of the ways that scientists are now able to
better detect and warn of tornadic thunderstorms
We haven't discussed
weather radar in this class. In some ways a radar image of
a thunderstorm is like an X-ray photograph of a human body.

An X-ray image of a person doesn't usually
show the entire body, often just the bones and skeleton
inside.

The
radio signals emitted by radar pass through the cloud itself
but are reflected by the much larger precipitation
particles. The radar keeps track of how long it takes for the
emitted signal to travel out to the cloud, be reflected, and
return to the radar antenna. The radar can use this to
determine the distance to the storm. It also knows the
direction to the storm and can locate the storm on a
map. The intensity of the reflected signal (the echo) is
often color coded. Red means an intense reflected signal
and lots of large precipitation particles. The edge of
the cloud isn't normally seen on the radar signal.
The amount and intensity of the precipitation is sometimes used
in Tucson during the summer to issue a severe thunderstorm
warning.
A Doppler radar (something we don't
usually discuss in class) can detects small
shifts in the frequency of the reflected radar signal caused by
precipitation moving toward or away from the radar
antenna. This can be used to determine the direction and
speed of the wind inside a thunderstorm (and
sometimes in a tornado).
Below is an actual radar image with a prominent hook
echo. The hook is evidence of large scale rotation inside
a thunderstorm and means the thunderstorm is capable of, and may
already be, producing tornadoes.

This is the radar image of a thunderstorm that
produced a very strong tornado that hit Oklahoma
City in May 1999
. The hook echo is visible near the lower left
hand corner of the picture. Winds in the tornado
may have exceeded 300 MPH. You can read more about this
tornado here.
And here is some storm chase
video of the tornado.
Tornadoes
The
United States
has roughly
1000 tornadoes
in an average
year, more
than any other country in
the world.
A
year's worth of tornado activity plotted
on a world map. Note
the name at bottom left: T.T. Fujita,
"Mr. Tornado." The
scale used to rate tornado strength and
intensity is named after him. A
comparable, more recent map can be found
at https://www.ncdc.noaa.gov/climate-information/extreme-events/us-tornado-climatology
This is mostly just a
consequence of geography.
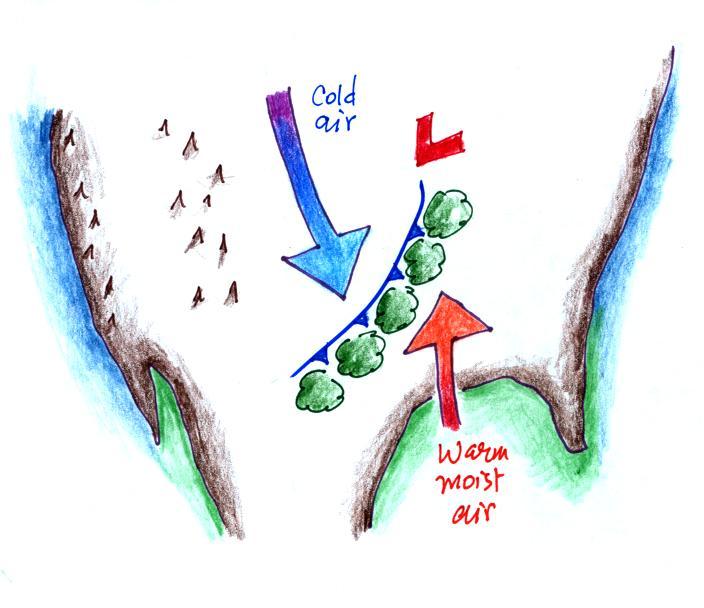
Without
any mountains in the way, cold dry air can move in
the spring all the way from Canada to the Gulf
Coast. There it collides with warm moist air
from the Gulf of Mexico to form strong cold fronts
and thunderstorms. There are some other
meteorological conditions that come into play that
create thunderstorms capable of producing
tornadoes.
Tornadoes have been observed in every state, but
tornadoes are most frequent in
the Central Plains, a region referred to as
"Tornado Alley" (highlighted in red,
orange, and yellow above).

The figure above shows tornado deaths per
million people (from: https://blog.nssl.noaa.gov/nsslnews/2009/03/us-annual-tornado-death-tolls-1875-present/).
You can see a steady decline in fatalities beginning
around 1925. The number of deaths appears to have
leveled off at roughly 0.2 deaths per million in the past
decade or so (note the y-axis is a logarithmic
scale). This is roughly a factor of 10 less
than it was a century ago and is due to much improved
methods of detecting and sending out warnings of tornadoes
and severe thunderstorms.
The currently population of the US is about 325 million,
so 0.2 deaths/million x 325 million is 65 deaths per year.
Here are some data for the past several years (a link to
the 2018 data is included below). You can see that
every so often the United States experiences a
particularly deadly year. That was the case in
2011. An EF5 tornado struck Joplin, Missouri,
on May 22 and killed 158 people (EF refers to the Enhanced
Fujita Scale rating).
Tornado
statistics for past few years
|
Year
|
No. of confirmed
tornadoes
|
No. of deaths
|
2018
(ongoing)
|
810
|
9
|
2017
|
1418
|
35
|
2016
|
976
|
18
|
2015
|
1178
|
36
|
2014
|
928
|
47
|
2013
|
903
|
55
|
2012
|
939
|
69
|
2011
|
1697
|
553*
|
* second largest
death total in US history
You'll find a graphical display of the average annual
tornado frequency that extends back to 1995 at https://www.statista.com/statistics/203682/number-of-tornadoes-in-the-us-since-1995/
Tornado characteristics
Here are
some basic tornado characteristics (the figure above is
also on page 159a
in the ClassNotes)
1. Probably the most recognizable feature
of a tornado is the narrow cylinder of rapidly rotating
winds. About 2/3rds (maybe 3/4) of tornadoes are F0
or F1 tornadoes (this is referring to the Fujita Scale,
which we'll learn more about later) and have spinning
winds of about 100 MPH or less. Microburst winds can
also reach 100 MPH. Microbursts are much more common
in Tucson in the summer than tornadoes and can inflict the
same level of damage.
2. A very strong inwardly directed
pressure gradient force is needed to keep winds spinning
in a circular path. The pressure in the center core
of a tornado can be 100 mb less than the pressure in the
air outside the tornado. This is a very large
pressure difference in such a short distance. The
PGF
is
much
stronger
than
the
Coriolis
Force
(CF)
and
the
CF
can
be
neglected.
The same pressure drop can be found in strong hurricanes
but it takes place over a much larger distance. The
PGF isn't as strong and the CF does play a role.
3. Because the Coriolis force doesn't
play a role, tornadoes can spin clockwise or
counterclockwise (there's an inward pointing PGF force in
both cases). Counterclockwise rotation is more
common. This might be because larger scale motions
in the cloud (where the CF is important, might determine
the direction of spin in a tornado).
4, 5, 6. Tornadoes usually last only a few
minutes, leave a path on the ground that is a few
miles long, and are usually a few 100s of meters in
diameter (perhaps somewhat larger near the top of the
tornado).
7. Most tornadoes move from the SW toward
the NE. This is because tornado-producing
thunderstorms are often found just ahead of a cold front
where winds often blow from the SW. Tornado
motion is usually a few 10s of MPH.
8. As mentioned
earlier the United States has more tornadoes per year than
any other country in the world. Tornadoes
are
most
frequent
in
the
Spring.
The
strongest
tornadoes
also
occur
at
that
time
of
year.
You
don't need to remember the specific months.
Tornadoes are most common in the late afternoon when the
atmosphere is most unstable.
The 1925 Tri State Tornado
This figure traces out the path of
the 1925 "Tri-State
Tornado" . The tornado path (note the SW
to NE orientation) was 219 miles long, the
tornado lasted about 3.5 hours and killed 695
people. The tornado was
traveling over 60 MPH over much of its path. It is
still today the deadliest single tornado ever in
the United States (you'll find a
compilation of tornado records here).
The Joplin
Missouri tornado (May 22, 2011) killed 158 people
making it the deadliest since 1947 and the 7th deadliest
tornado in US history.
Tornado
outbreaks
Tornadoes often
occur in "outbreaks." The paths of 148 tornadoes
during the April 3-4, 1974 "Jumbo
Tornado Outbreak" are shown above. Note
the first tornadoes were located in the upper left
corner of the map and
all of the tornado
paths are oriented from SW to NE.
The April
25-28, 2011 outbreak is now apparently the largest
tornado outbreak in US history (358 tornadoes, 346 people
killed)
Here is some
information about a November 2015 High Plains tornado
outbreak. November tornado
outbreaks are fairly unusual.
As we learn more about tornadoes I'm
hoping you'll look at tornado videos with a more
critical eye than you would have
otherwise. So we took a moment, at this
point, to have a look at some tornadoes caught
on video (on video tape). If you click on the
links below you'll see the same or a similar video
that I found online. The videos shown in class
were from a tape called "Tornado Video
Classics".
The numbers in the left column identified the tornado
on the tape. The next column shows the Fujita
Scale rating (the scale runs from F0 (weakest) to F5
(strongest). The locations and date are shown
next. The last column has comments and things to
look for when watching the video segment.
Video
ID
|
Fujita
Scale
rating
|
Location
|
Date
|
Comments
|
54a
|
F3
|
Grand Isle NE
|
Mar. 13, 1990
|
tornado cloud is
pretty thick and vertical |
61f
|
F3
|
McConnell
AFB
KS
|
Apr. 26, 1991
|
this is about as
close to a tornado as you're ever likely to get.
Try to judge the diameter of the tornado cloud.
What direction are the tornado winds spinning?
|
52
|
F5
|
Hesston
KS
|
Mar. 13, 1990
|
Watch closely, you
may see a tree or two uprooted by the tornado winds
|
51
|
F3
|
North
Platte
NE
|
Jun. 25, 1989
|
Trees uprooted and
buildings lifted by the tornado winds. The
online video is longer than the one shown in class and
has some good closeup video. See especially the
last couple of minutes of the video
|
65
|
F1
|
Brainard
MN
|
Jul. 5, 1991
|
It's a good thing
this was only an F1 tornado
|
57
|
F2
|
Darlington
IN
|
Jun. 1, 1990
|
Tornado cloud
without much dust
|
62b
|
F2
|
Kansas
Turnpike
|
Apr. 26, 1991
|
It's sometimes hard
to run away from a tornado. Watch closely you'll
see a van blown off the road and rolled by the
tornado. The driver of the van was killed!
|
47
|
F2
|
Minneapolis, MN
|
Jul. 18, 1986
|
Tornado cloud
appears and disappears. The online video
compares features seen in this tornado with one
created in a laboratory.
|
A highway underpass is actually a very dangerous place to
take shelter from a tornado, here is a little more
information from the Ohio Committee for Severe Weather
Awareness.
Tornado life cycle
Hopefully the next time you see a tornado either in person or
on video you'll be able to say whether it is early or late in
its life cycle and whether it appears to be a stronger or
weaker than average tornado. The following figure is on
page 159b in the
ClassNotes.
Tornadoes begin in and descend from a thunderstorm.
You would usually see a funnel cloud dropping from the
base of the thunderstorm. Spinning winds will
probably be present between the cloud and ground before
the tornado cloud becomes visible. The spinning
winds can stir up dust at ground level. The spinning
winds might also be strong enough at this point to produce
some minor damage.
In Stage 2, moist air moves horizontally toward the low
pressure in the core of the tornado. This sideways
moving air will expand and cool just as rising air does
(see figure below). Once the air cools enough (to
the dew point temperature) a cloud will form.
Tornadoes can go from Stage 2 to Stage 3 (this is what
the strongest tornadoes do) or directly from stage 2 to
stage 4 or 5. Note a strong tornado is usually
vertical and thick as shown in Stage 3. "Wedge
tornadoes" actually appear wider than they are tall.
Here is video of the Laverne
Oklahoma tornado that was shown in class and that
shows the initial dust swirl stage up to the mature stage
very well.
The thunderstorm and the top of the tornado will move
faster than the surface winds and the bottom of the
tornado. This will tilt and stretch the
tornado. The rope like appearance in Stage 5 is
usually a sign of a weakening (though still a dangerous)
tornado.

Tornado
intensity and the Fujita Scale
It
is very hard to actually measure
the speed of the rotating winds in
a tornado. Researchers
usually survey the damage caused
by the tornado and assign a Fujita
Scale rating. The
original scale, introduced in 1971
by Tetsuya (Ted) Fujita. A
simplified, easy to remember
version is shown below. A
very basic and grossly
oversimplified idea of the damage
that each level can produce is
included. This is simple
enough that I can remember it and
can use it to estimate tornado
intensity when I see damage on the
television news (without having to
turn on my computer and look up
the Fujita scale online).
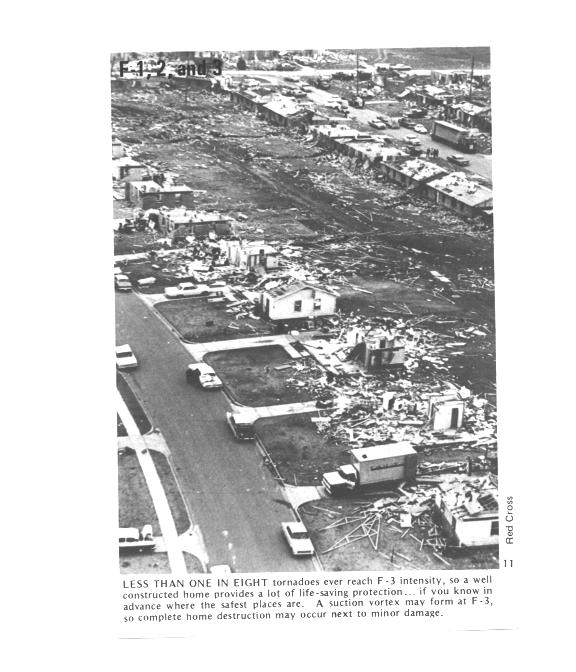
The fact that the interior walls in
a home as the last to go in a tornado means this is
probably the best location to seek shelter from a
tornado if a better location (such as an underground
storm cellar) is not available.
At some point it became apparent that the Fujita (F) Scale
was probably overestimating the wind speeds in
tornadoes. The original scale has been replaced by the
Enhanced Fujita (EF) scale.
Here are simplified, easy to remember, versions of both
scales.
Here is a comparison of the
actual scales
There's
also a much more detailed set of guidelines for
determining the EF scale rating from a survey of tornado.
Different objects and structures react differently when
subjected to tornado (or microburst) strength winds.
The EF scale has 28
"damage indicators" that can be
examined to determine tornado intensity. You can
think of these as being different types of structures or
objects that could be damaged by lightning..
Examples include:
Damage
Indicator
|
Description
|
2
|
1 or 2 family
residential home
|
3
|
Mobile home (single
wide)
|
10
|
Strip mall
|
13
|
Automobile showroom
|
22
|
Service station
canopy
|
26
|
Free standing light
pole
|
27
|
Tree (softwood)
|
Then for each indicator is a
standardized list of "degrees of
damage" that an
investigator can look at to estimate the
intensity of the tornado. For a 1 or
2 family home for example
degree
of damage
|
description
|
approximate
wind speed (MPH)
|
1
|
visible damage
|
65
|
2
|
loss of roof
covering material
|
80
|
3
|
broken glass in
doors & windows
|
95
|
4
|
lifting of roof
deck, loss of more than 20% of roof material, collapse
of chimney, garage doors collapse inward, destruction
of porch roof or carport
|
100
|
5
|
house slides off
foundation
|
120
|
6
|
large sections of
roof removed, most walls still standing
|
120
|
7
|
exterior walls
collapse (top story)
|
130
|
8
|
most interior walls
collapse (top story)
|
150
|
9
|
most walls in bottom
floor collapse except small interior rooms
|
150
|
10
|
total destruction of
entire building
|
170
|
You'll find the entire set of damage
indicators and lists of degrees of damage here.
Here's some recent
video of damage being caused by a tornado as it
happened (caught on surveillance video).
It shows a house roof being lifted intact off a
house. If you listen to the news commentators, there
was someone in a pickup truck in the street that survived
the tornado. The tornado struck West Liberty,
Kentucky, on March 2, 2012.
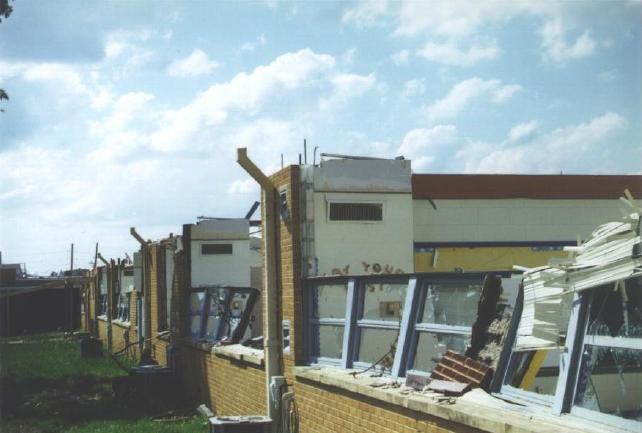
Here are photographs of some actual tornado damage
and the EF Scale rating that was assigned to each
EF2
Damage
roof is gone, but all walls still standing
|
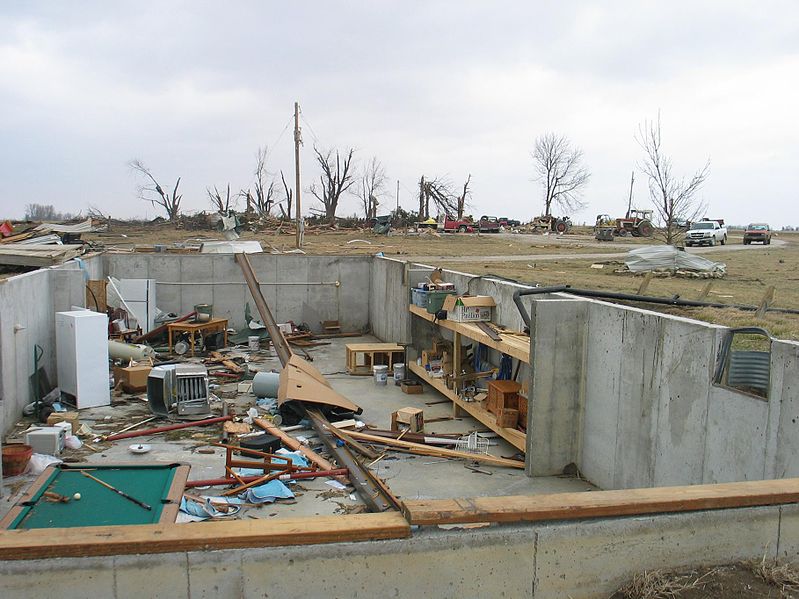
EF4
Damage
only the strong
reinforced concrete basement walls (part of the
wall was below ground) are left standing. It
doesn't look like there would have been anywhere
in this building that would have provided
protection from a tornado this strong.
|
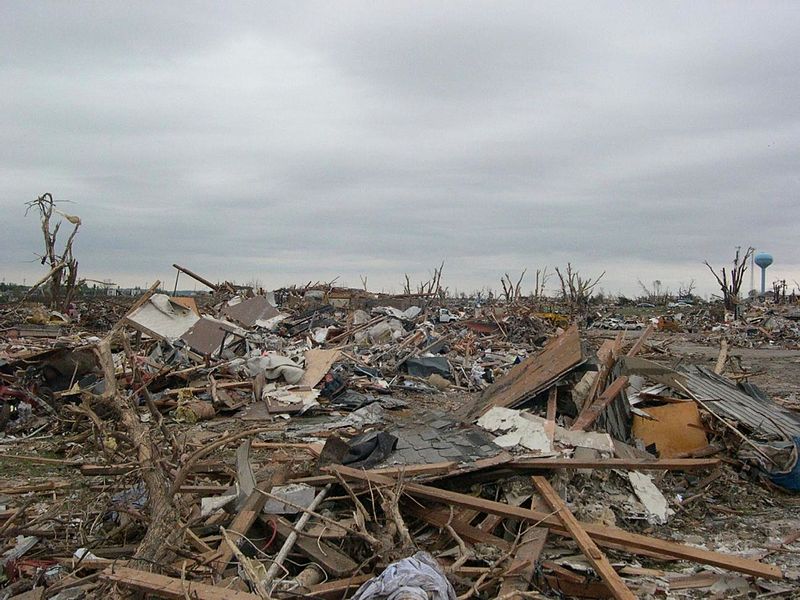
EF5
Damage
complete destruction of the structure
|
|
|
|
At this point we watched the
last of the tornado video tapes. It showed a
tornado that occurred in Pampa, Texas. Here is a
pretty similar video that I found online.
It's missing the commentary that was on the video
shown in class. Near the end of the segment,
video photography showed several vehicles (pick up
trucks and a van) that had been lifted 100 feet or so
off the ground and were being thrown around at 80 or
90 MPH by the tornado winds (the large dark objects
seen between about 5:40 and 6:10 on the video).
Winds speeds of about 250 MPH were estimated from the
video photography (though the wind speeds were
measured above the ground and might not have extended
all the way to the ground).
Multiple
vortex tornadoes
And finally, something
that was initially something of a puzzle to tornado
researchers.
 |
|
|
One of the better examples that I've
seen of very different levels of damage in close
proximity. This is damage from an EF4 tornado
that hit Northwood ND on Aug. 26, 2007.
(National Weather Service photo, source
click on the Track Segments and Photos link)
|
Several levels
of damage (EF1 to about EF3) are visible in the
photograph above. It was puzzling initially
how some homes could be nearly destroyed while a
home nearby or in between was left with only light
damage. One possible explanation is shown
below.
|
|
Sketch of multiple vortices in a large
tornado and the damage pattern they could leave on the
ground
|
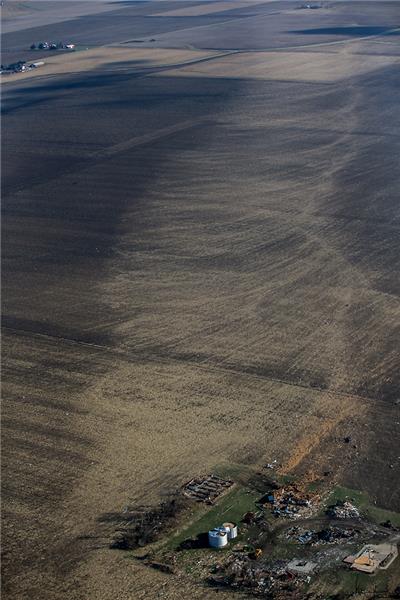
An actual aerial survey of tornado
damage. This was an EF 4 tornado that hit
Washington Illinois on Nov. 17, 2013 (here is YouTube
video of the tornado and the damage left
behind). Photo by Zbigniew Bzdak for the Chicago
Tribune (source)
|
Some big strong
tornadoes may have smaller more intense "suction
vortices" that spin around the center of the
tornado (they would be hard to see because of
all the dust in the tornado cloud. Tornado
researchers have actually seen the damage
pattern shown above scratched into the ground by
the multiple vortices in a strong tornado.

The
homes marked in red would be damaged
severely. The others would receive
less damage. Just one suction vortex
was used here, there are usually
several. But the tornado diameter is
also probably larger than shown here.


