| Year |
US
Deaths |
Total
Damage
(US) (billions $ ) |
Total number of deaths basin wide |
Total damage basin wide (billions US$) |
| 2000 |
0 |
<
1 |
105 |
1.3 |
| 2001 |
24 |
5.2
|
187 |
11.7 |
| 2002 |
51 |
1.4
|
50 |
2.5 |
| 2003 |
14 |
1.9
|
92 |
6.3 |
| 2004 |
34 |
19.6
|
3260 |
61.2 |
| 2005 |
1016 |
95 |
3960 |
181 |
| 2006 |
0 |
<
1 |
14 |
< 1 |
| 2007 |
1 |
<
1 |
478 |
3.4 |
| 2008 |
12 |
8 |
1047 |
49.5 |
| 2009 |
2 |
<
1 |
9 |
< 1 |
| 2010 |
0 |
<
1 |
392 |
7.4 |
| 2011 |
9 |
<1 |
112 |
17.4 |
| 2012 |
4 |
<1 |
155 |
72 |
| 2013 |
1 |
<1 |
54 |
1.5 |
| 2014 |
0 |
<1 |
21 |
< 1 |
| 2015 |
14 |
<1 | 89 |
< 1 |
| 2016 |
11 |
3 |
748 |
16.1 |
| 2017 |
43 |
23 |
3361 |
280 |
| 2018 |
7 |
16 |
173 |
50 |
| 2019 |
statistics
not yet available |
98 |
12 |
|
| Average |
65 |
720 |
||
|
|
|
|
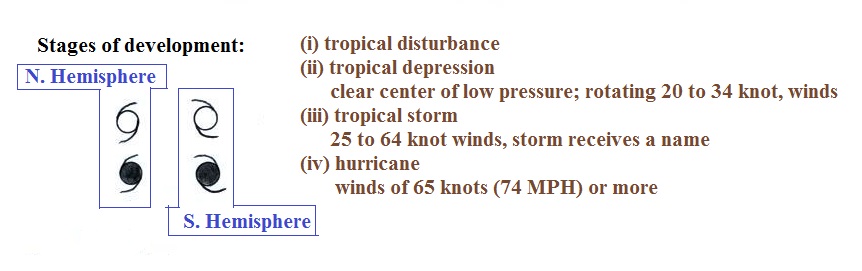
| Similarities |
| both types of storms
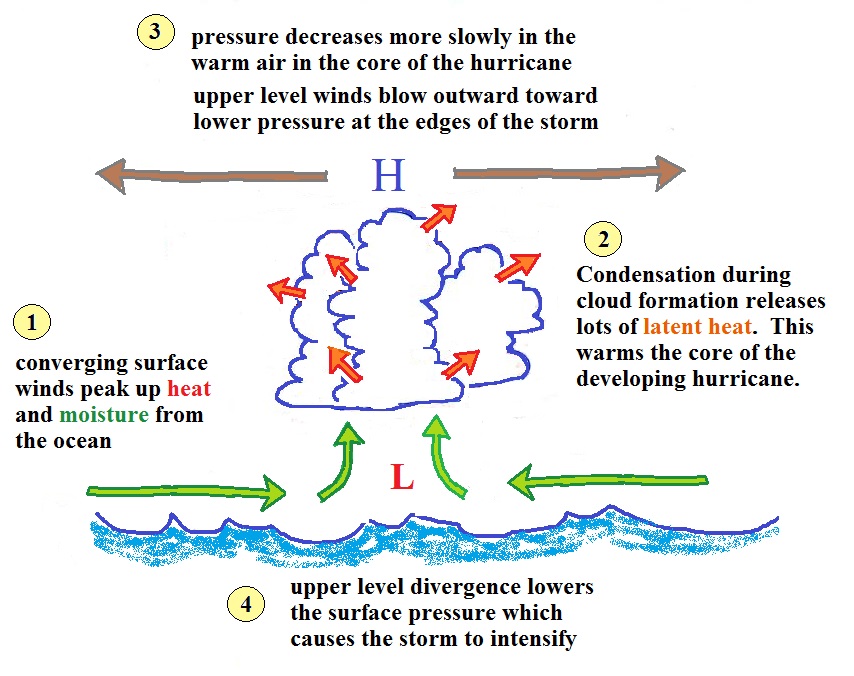
have low pressure centers (the term cyclone refers to winds blowing around low pressure) |
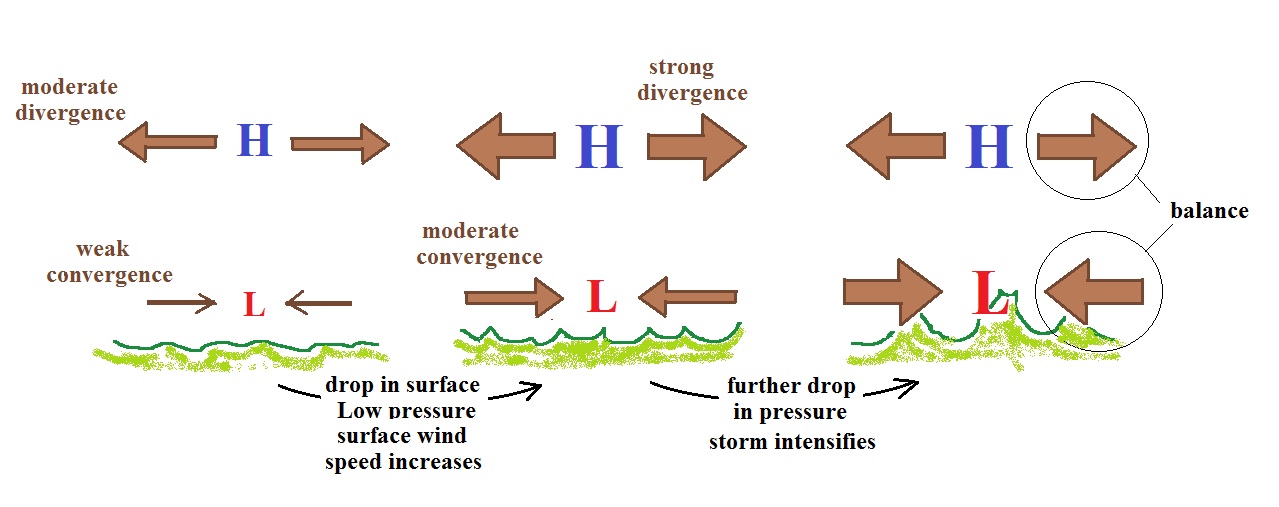
| upper level divergence
is what causes both types of storms to intensify (intensification means the surface low pressure gets even lower) |
| Differences
(the order may differ from that given in class) |
|
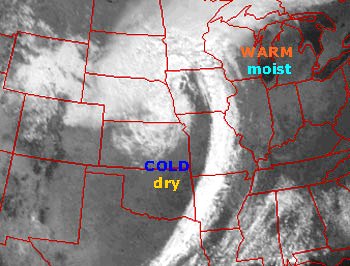
| 1. Middle latitude
storms are bigger, perhaps 1000 miles in diameter (half the US) |
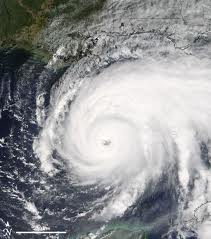
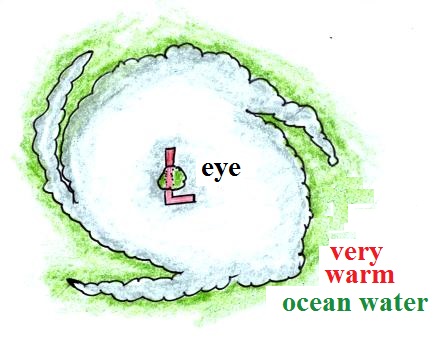
1. Hurricanes are
smaller, 100s of miles in diameter (fill the Gulf of Mexico) |
| 2. Formation can occur
over land or water |
2. Can only form over
warm ocean water weaken rapidly when they move over land (increased friction slows the winds) or cold water |
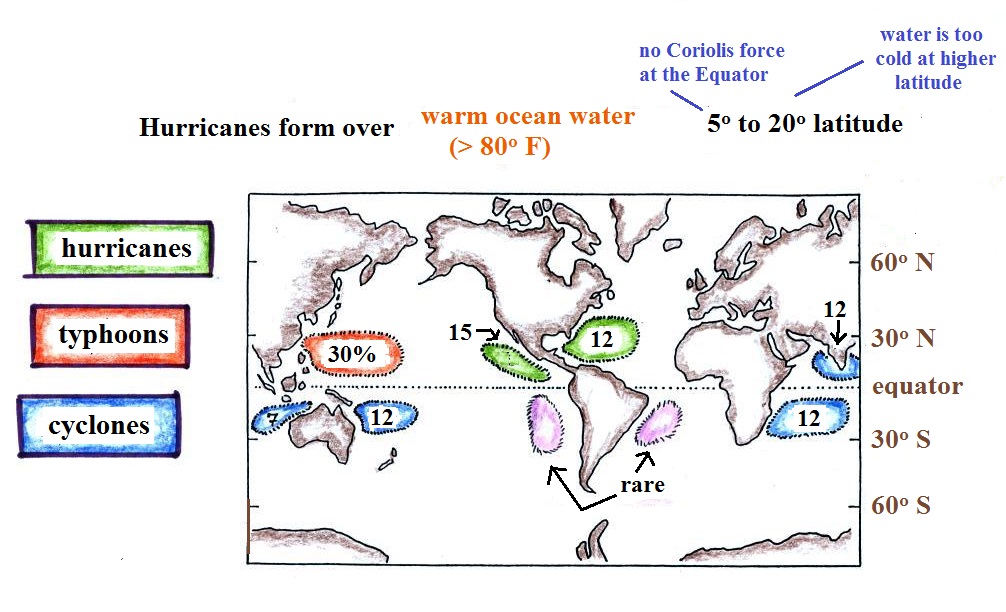
| 3. Form at middle (30o
to 60o) latitudes |
3. Form in the sub
tropics, 5o to 20o latitude |
| 4. Prevailing westerlies
move these storms from west to east |
4. Trade winds move
hurricanes from east to west |
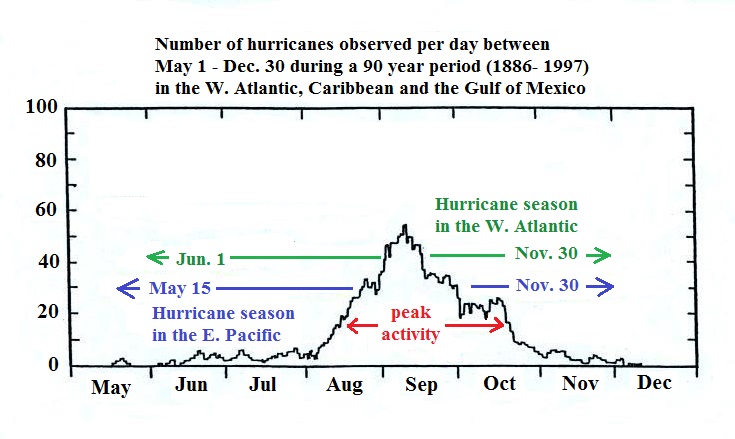
| 5. Storm season: winter
to early spring |
5. Storm season: late
summer to fall (when ocean water is warmest) |
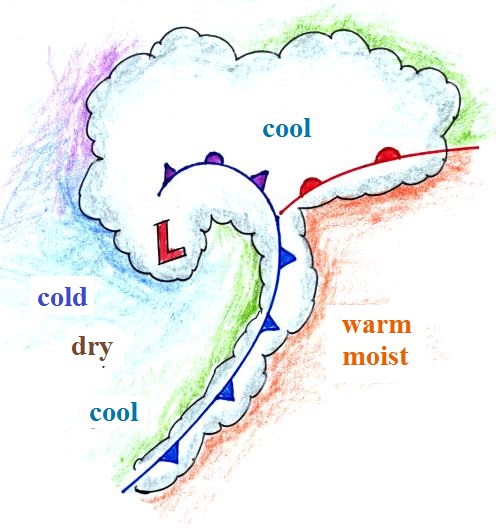
| 6. Air masses of
different temperatures collide along fronts |
6. Single warm very
moist air mass |
| 7. All types of
precipitation: rain, snow, sleet freezing rain |
7. Mostly just rain,
lots of rain (a foot or more) |
| 8. Only an occasional
storm gets a name (becoming a little more common) ("The
Perfect Storm", "Storm of the Century", etc.) |
8. Tropical storms &
hurricanes gets names |
| Normal hurricane activity in the Pacific | Normal hurricane activity in the Atlantic |
| 16
tropical storms per year 8 reach hurricane strength 0 hit the US coastline |
10
tropical storms per year 6 reach hurricane strength 2 hit the US coastline |
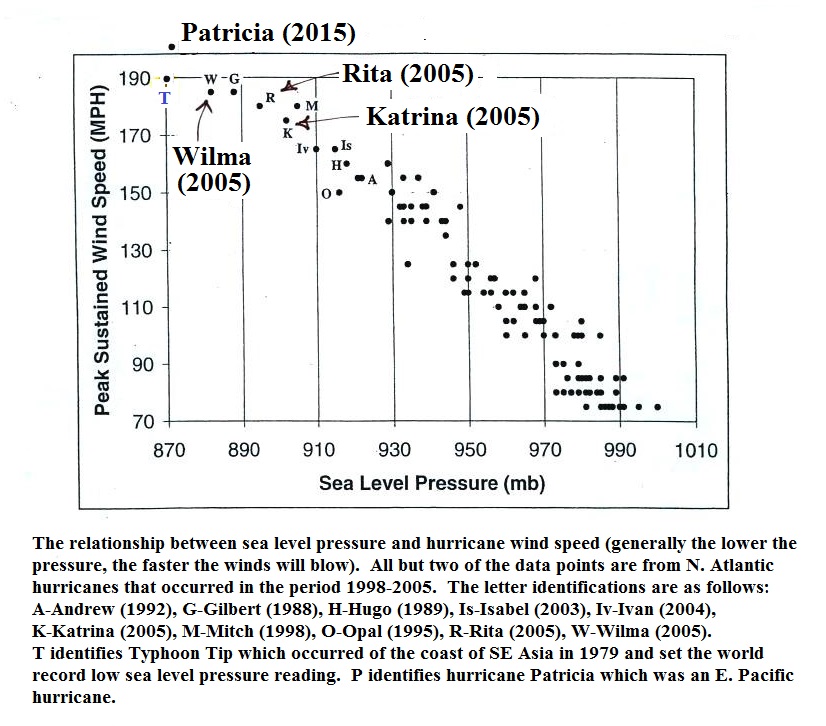
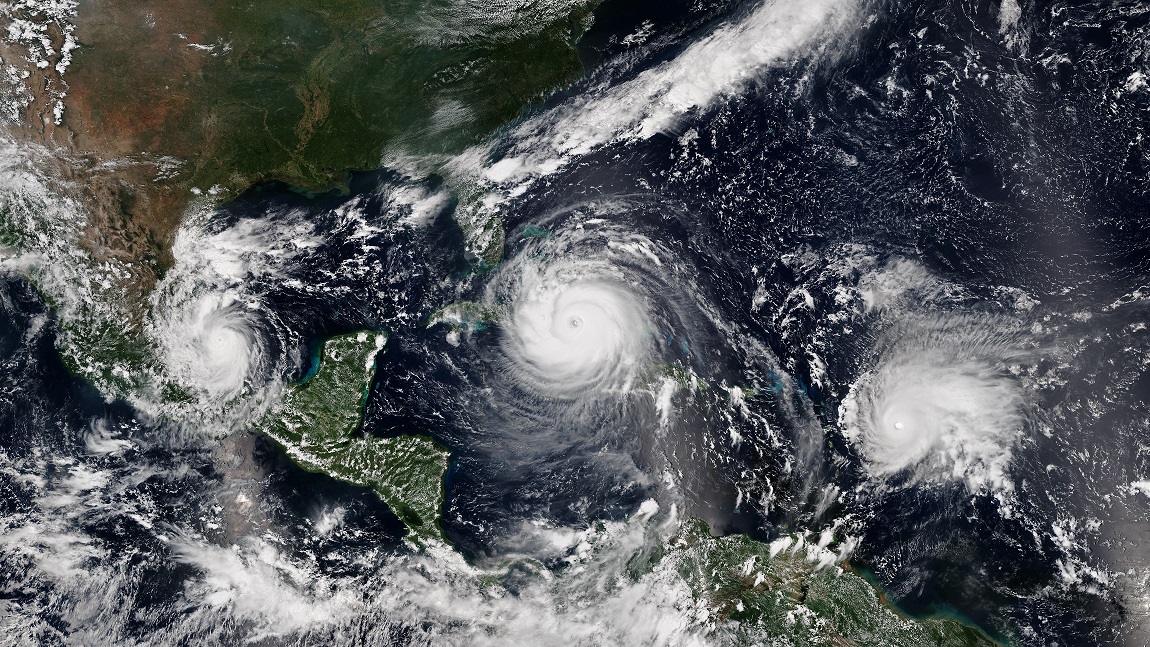
| 2005 Atlantic hurricane season (Katrina, Rita, Wilma) |
| 28 named storms (previous record was 21) 15 became hurricanes (7 major hurricanes) |
| 2017 Atlantic hurricane season (Harvey, Irma, Maria) |
2018 Atlantic hurricane season (Michael) |
2019 Atlantic hurricane
season (Dorian) |
| 17 named storms 10 became hurricanes (6 major hurricanes) |
15 named storms 8 became hurricanes (2 major hurricanes) |
18 named storms 6 became hurricanes (3 major hurricanes) |

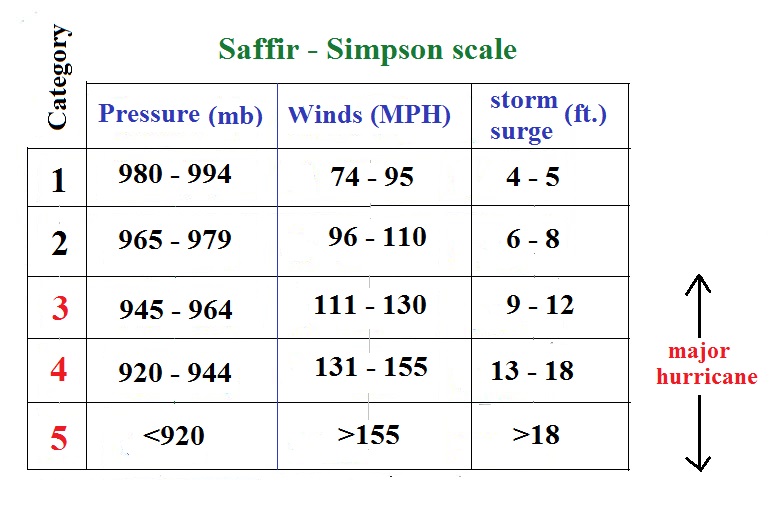
| Scale |
Phenomenon |
| Beaufort* |
Wind speed |
| Fujita |
Tornado intensity |
| Kelvin |
Temperature |
| Richter* |
Earthquakes |
| Saffir-Simpson |
Hurricane intensity |
 |
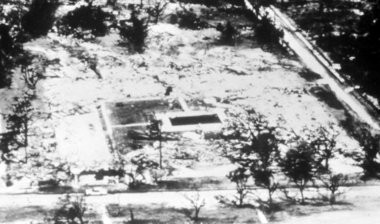 |
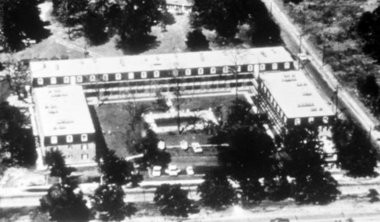
| The Richelieu
Apartments in Pass Christian, Mississippi, before and
after being destroyed by a storm surge produced by
Hurricane Camille in August, 1969 (source of these
pictures: https://www.nola.com/hurricane/2014/08/hurricane_camille_party_what_h.html |
|