Tuesday Apr. 30, 2013

Today was the last day of classes and we wrapped up the semester with somewhat superficial coverage of several different topics.  Much in the notes that follow was assembled after the end of the semester and you'll find a lot of additional detail that wasn't covered in class.

1. Ball Lightning
Ball lightning is still an unexplained phenomenon.  Most reports describe it as a luminous ball about the size of a baseball or softball that moves along the ground or through the air with an appearance, sound, and odor that suggest an electrical nature and origin.  Ball lightning is generally produced during a thunderstorm.  Wikipedia has several interesting historical accounts and observations of ball lightning and discusses many of the attempts to produce ball lightning in the laboratory.  Chapter 15 in Martin Uman's book "All About Lightning" also has a number of more recent observations. 

Until a complete explanation is found I am quite happy with Uman's suggestion "Ball lightning has been seen by 5 to 10% of the population.  Although it is generally thought that ball lightning is a rare phenomenon, recent research has shown that the numbers of ball lightning observers are not much different from the numbers who have observed lightning impact points.  The implication is that ball lightning is usually created at or near the lightning channel and that an appreciable fraction of all cloud-to-ground lightning flashes may give birth to ball lightning.  Since the balls generally last for only a few seconds, they cannot get too far from the mother channel.  Thus ball lightning may well be common, but rarely seen."


A final note, I did come across a recent publication "Birth of Ball Lightning" by Lowke et al. (2012) that I haven't yet had a chance to read.

2. Volcanic Lightning
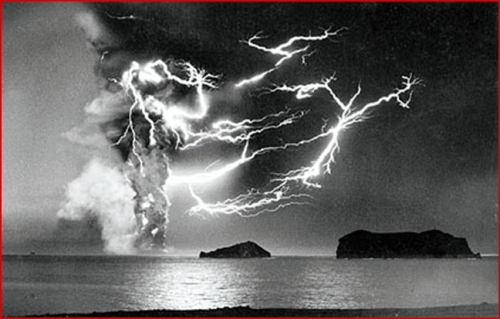
I wanted to spend a short time in class on volcanic lightning.  Images of volcanic lightning are often quite spectacular.  The channels are generally shorter (100s of meters long) and more randomly oriented than normal thunderstorm lightning.  Also electrification of the ash cloud at least must involve a different process than the Reynolds, Brook, Gourley mechanism discussed earlier in the semester. 


The photo above shows the eruption of Surtsey south of Iceland (source of this image).  The eruption began below sea level on Nov. 14, 1963 and reached the ocean surface and began to form a new island about 10 days later.  Activity continued until 1967 by which time the island had grown to a size of about 1 square mile. 

Surtsey is one of the first instances where careful and close atmospheric electrical measurements were made of a volcanic eruption.  Observations made in February 1964 have been presented by Anderson et al. (1965).  Strong increases in the potential gradient coincided with high velocity emissions of black tephra carried upward by super heated steam (ocean water was able to pour into the volcano).  Tephra is, I think, just a general term for fragments of solid material ejected by a volcano.  The sign of the potential gradient indicated positive charge overhead.

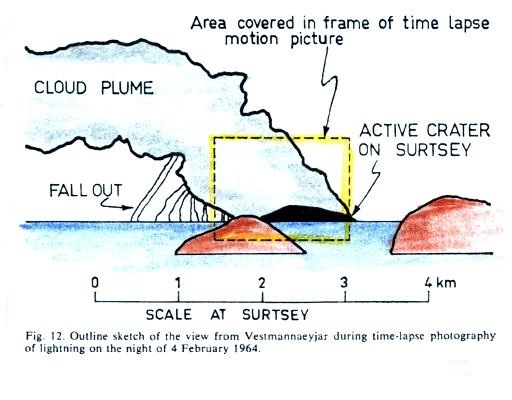
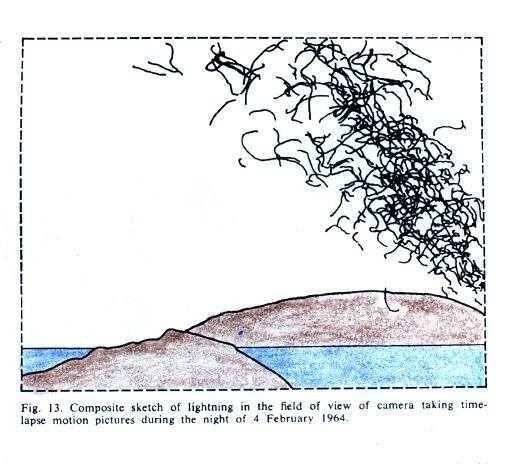
Lightning activity was recorded using a time lapse movie camera.  The field of view of the camera is shown in the left figure below.  Tracings of the lightning channels recorded on the movie are shown at right.  Both figures are from the Anderson et al. (1965) article.


The channels were generally short (100s of meters) and close to the ground.  Both in cloud lightning and strikes to the ground and ocean were observed.  The thunder was also noted to be different and consisted of a "short sharp crack similar to the sound produced by a single spark from a large Van de Graaff generator."

More detailed observations and measurements of a 2nd Icelandic volcano (Heimaey) are described by Brook et al. (1974).  Strong electrification and lightning was observed when the lava flowed into the harbor and produced large clouds of steam.  The clouds were found to be positively charged and electric field values at the ground as high as 7000 V/m were recorded.

It is interesting to compare these early studies of volcanic lightning with some recent field experiments using using the New Mexico Tech Lightning Mapper Array (LMA).  Thomas et al. (2007) describe measurements made during the 2006 Mount St. Augustine eruption in Alaska (2 station network).  Observations indicated two types of electrical activity: "disorganized" discharges that occur in the highly (positively) charged plume near the volcano cone and associated with violent eruptions of the volcano and more conventional discharges that occur in the water cloud produced by the volcano, often well downwind of the eruption.  The latter type of lightning activity means that charging generation is occurring in what might be described as a "dirty" thunderstorm cloud. 

    A larger network of 4 LMA stations was installed (in winter in Alaska) about 80 km east of the Redoubt volcano (see Behnke et al. (2012) and also this NMT webpage).  The electrical activity observed in Redoubt was similar to that seen in the St. Augustine eruption.


Planetary Lightning

In this next section we'll look at some of the evidence for lightning on other planets in our solar system.

Together with Mars, Venus is probably the most visited planet in our solar system. (source of the information below)

Missions to Venus
Flybys
Mariner 2 (1962); Zond1 (1964); Mariner 5 (1967) & 10 (1973); Venera 11 (1978), 12 (1978), 13 (1981) & 14 (1981); Vega 1 (1984) & 12 (1984), Galileo (1989), Cassini-Huygens (1997) , Messenger (2004), Ikaros (2010), and Akatsuki (2010)
Orbiters
Venera 8 (1972) & 10 (1975), Pioneer Venus 1 (1978), Venera 15 (1983) & 16 (1983), Magellan (1989), Venus Express (2005)
Probes
Venera 3 (1965), 4 (1967), 5 (1969) & 6 (1969); Pioneer Venus 2 (1978)
Landers
Venera 7, 8, 9, 10, 11, 12, 13 & 14; Vega 1 & 2; Pioneer Venus 2 (1978)
launch dates are shown in parentheses

The atmosphere on Venus is approximately 97% CO2 and 3% N2.  Atmospheric pressure at the surface is about 90 bars (i.e. about 90 times the sea level pressure on earth) and the surface temperature is 740 K (hot enough to melt lead, tin and zinc).  The lowest 30 km or so of the atmosphere is clear, but a thick dense sulfuric acid cloud layer found between 45 and 70 km altitude allows very little sunlight to reach the surface. 

Electromagnetic radiation attributed to lightning was detected by the Venera 11, Venera 12 and the Pioneer Venus 1 orbiter spacecraft (see C.T. Russell et al. (2011)).  Optical impulses that could have been produced by lightning were detected by Galileo as it flew by Venus (see R.A. Kerr (1991)).  The most recent evidence of lightning comes from detection of whistler signals by the Venus Express Orbiter (see A.P. Ingersoll (2007)). 
C.T. Russell et al. (2011) is a good current review of the search for and evidence of lightning on Venus.

I'm including a list of missions to Mars for comparison (source).  There is no reason to suspect that lightning occurs on Mars, the atmosphere is too thin and there isn't much evidence of current volcanic activity.  It is possible that dust storms on Mars might create electrical discharges of some sort.

Missions to Mars
Flybys
Dawn (2007),  Mariner 4 (1964), Mariner 6 (1969), Mariner 7 (1969), Mars 2MV-4 No1, Mars 4, Mars 6, Mars 7, Rosetta, Zond 2, Zond 3
Orbiters
Mars Reconnaissance Orbiter (2005), Mars Express (2003)Mars Odyssey (2001)
Landers
Mars 3 (1971), Mars  Pathfinder (1996), Phoenix (2007), Viking 1 (1975), Viking 2 (1975)
Rovers
Curiosity (2011), Opportunity (2003), Sojourner (1997), Spirit (2003)
launch dates are shown in parentheses, missions that failed are not included in the table

Whistlers
    We have seen that lightning discharges emit electromagnetic radiation over a very wide range of frequencies.  This produces the static that you hear on AM radio during a lightning storm.  Whistlers are produced when radio waves at audio frequencies travel upward through the ionosphere and couple to lines of the earth's magnetic field.  The signals can then follow the field lines from the northern to the southern hemisphere (and sometimes back again).  Higher frequencies propagate more quickly than the lower frequencies so the signals are dispersed as they travel from hemisphere to hemisphere. 

    An example of a VLF spectrogram of a whistler signal recorded by the Stanford University VLF research group is shown below.  The lightning discharge that produced this signal occurred at relatively high latitude in the northern hemisphere and was recorded at Palmer Station in Antarctica (source).


The whistler is the curved signal that begins just before 03:55:30 with the arrival of the high frequency (7 kHz) portion of the signal.  The frequency decreases to less than 1 kHz over the next 2 seconds.  Because whistler signals are already at audio frequencies they are relatively easy to detect (no RF mixer circuits needed to convert AM  or shortwave radio frequencies to audio frequencies) and were apparently first heard in the late 1800s when receivers were connected to long phone lines (ref1, ref2).

The radio and plasma wave research group at the University of Iowa includes an audio recording of whistlers on their web page.

Lightning on Jupiter

There is convincing evidence that lightning exists on Jupiter.  We will mainly discuss observations made by Galileo, the first spacecraft to orbit Jupiter.   Galileo entered into orbit in December 1995.  The Galileo probe was released in July 1995 before the orbiter arrived at Jupiter and was equipped with a Lightning and Radio Emission Detector (LRD) instrument.  The LRD detected whistlers and recorded lightning-like RF signals but did not detect any optical impulses.  It is thought that the probe carrying the LRD may have descended into a relatively clear part of the Jupiter atmosphere.  The LRD instrument has been described by Lanzerotti et al. (1992) and data collected with the LRD are summarized and discussed in Lanzerotti et al. (1996) and Rinnert et al. (1998).

Missions to Jupiter
Flybys
Pioneer 10 (1972) & 11 (1973), Voyager 1 (1977) & 2 (1977), Ulysses (1990), Cassini (1997), New Horizons (2006)
Orbiters
Galileo (1989)
Probes
Galileo probe
launch dates are shown in parentheses

We'll discuss the Cassini mission shortly, it entered into orbit around Saturn.  The New Horizons spacecraft will fly by and study Pluto and its moons.

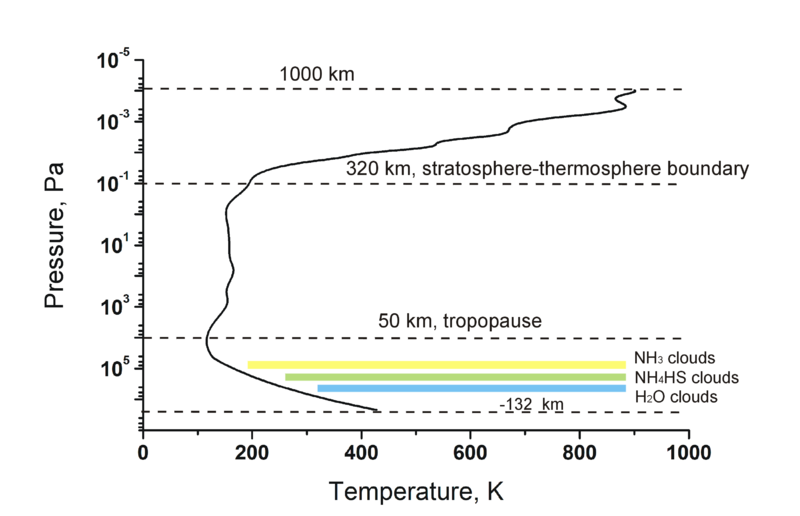
The atmosphere of Jupiter is approximately 90% hydrogen and 10% helium.  The vertical structure of the Jovian atmosphere is shown below (source).


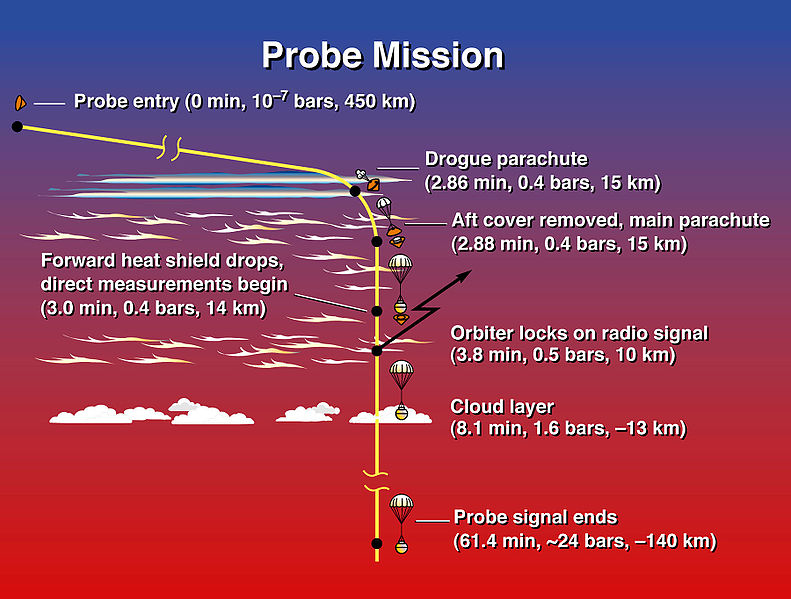
Altitude is arbitrarily set equal to 0 km at the 1 bar pressure level, i.e normal atmospheric pressure at sea level on the earth (standard sea level pressure on the earth is 1013.25 millibars = 101,325 Pascals = 1.01325 bars).  Data transmissions from the Galileo probe stopped at an altitude of -132 km where the ambient temperature and pressure were 307 F and 23 bars, respectively.  The descent of the probe is shown below (source)


Three cloud layers are thought to be found on Jupiter (because the Galileo probe descended through a dry part of the atmosphere it only detected one).  The cloud layers are shown in more detail in the figure below (Fig. 2 in Lanzerotti et al. (1992)).


Jovian lightning is presumably produced in the water (and ice) cloud by the same electrification processes as on earth.  Because the ambient pressure is higher than on earth a more intense electric field will be needed for breakdown.  The clouds are also thicker and lighting on Jupiter is more energetic and brighter than on earth.  Using data from the LRD probe Rinnert et al. (1998) estimated that Jovian lightning was occurring at a rate of about 1/100 th on earth (within a 15000 km radius of the probe).  

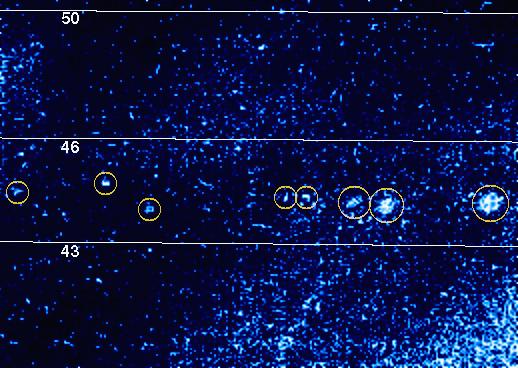
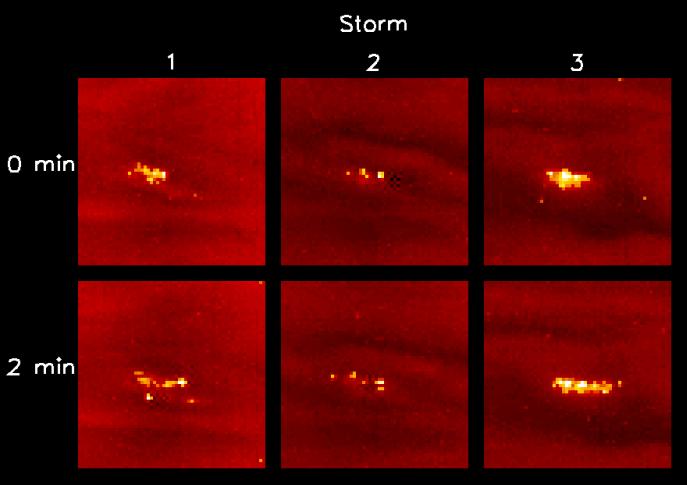
Several images of lightning captured by the Galileo orbiter from a NASA Galileo Lightning Image Gallery are shown below.   You'll find additional commentary on that web page.  The Galileo missions was ended on September 21, 2003 by sending the orbiter into the atmosphere in order to avoid contaminating the moons of Jupiter.


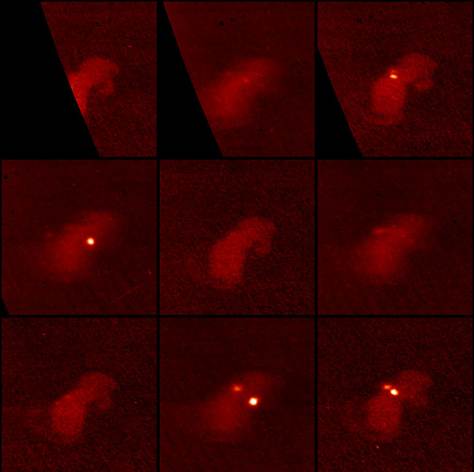
Photograph taken on Nov. 9, 1996 by the Galileo orbiter.  The spacecraft was in Jupiter's shadow and 2.3 million km above the planet.  The circled features are probably lightning.  The largest of the circled spots is more than 500 km across.


Three storms at three different locations photographed on Jupiter's night side (the flashes would be undetectable on the day time side).  "The lightning originates in Jupiter's water cloud, which is 50 to 75 kilometers (30 to 45 miles) below the ammonia cloud. The latter acts as a translucent screen, diffusing the light over an area comparable to the depth. The individual strikes are unresolved in these images, which have a resolution of 133 kilometers (80 miles) per picture element."  Clouds are made visible by light being reflected from Io, one of Jupiter's moons.

The lightning strikes are 100s of times brighter than normal lightning on earth.  Only terrestrial "super bolts" are comparable to the lightning observed on Jupiter (see B.N. Turman, "Detection of Lightning Superbolts," J. Geophys. Res., 82, 2566-2568, 1977 for more information).


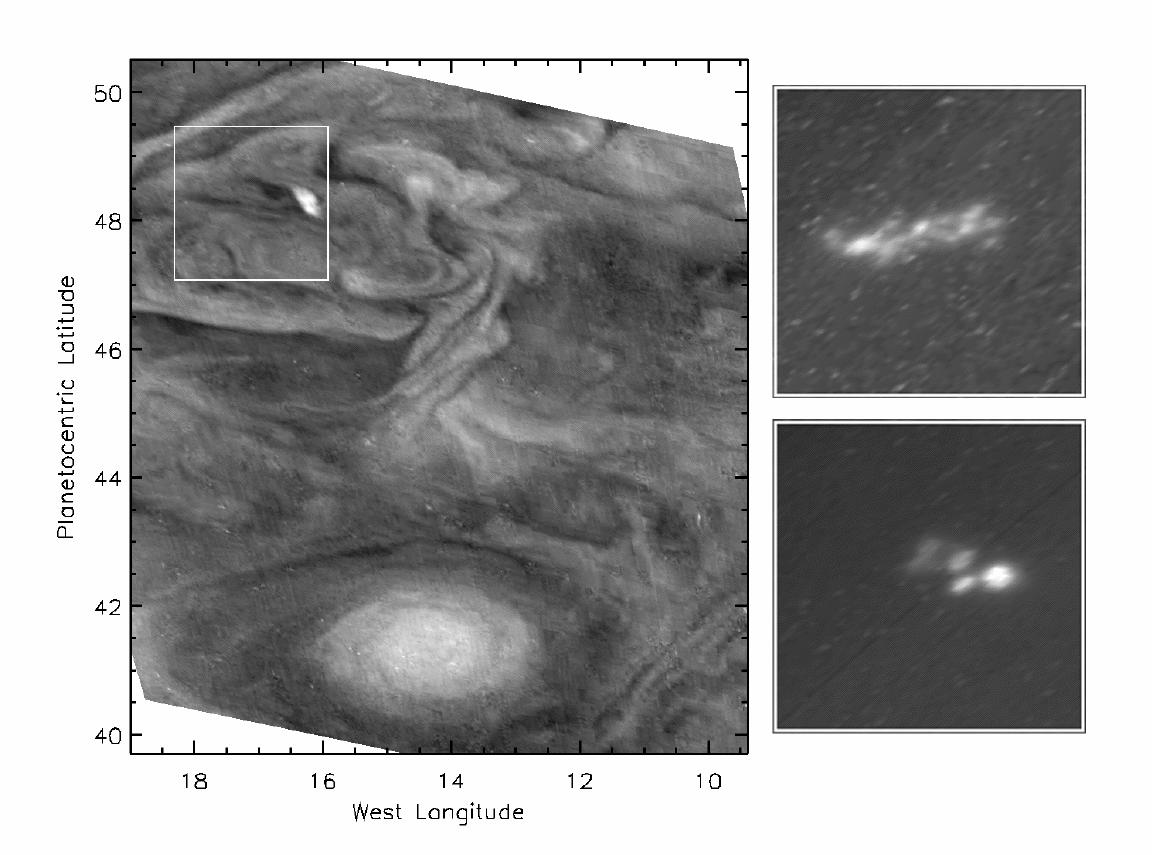
The photograph at left shows a storm system photographed during the day.  The two panels at right show lightning originating from the same location almost 2 hours later at night (factor of 2 expansion.  The box shown at upper left is approximately 2400 km on a side.


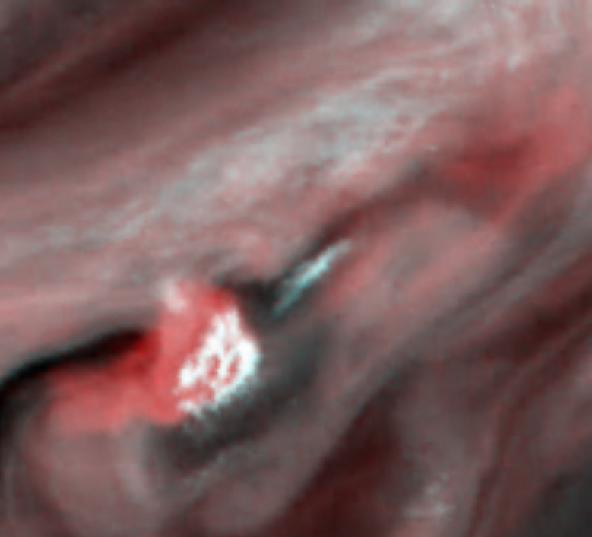
A Jovian thunderstorm 1000 km across and extending about 25 km above surrounding clouds.  The base of the cloud (red and to the left in the image) was about 50 km below the surrounding clouds (i.e. a 75 km tall thunderstorm).  By comparison on earth the largest anvil top on a thunderstorm is 200 km across and the tallest thunderstorms are 18 km high.


Lightning on Saturn

Missions to Saturn
Flybys
Pioneer 11 (1973), Voyager 1 (1977) & 2 (1977)
Orbiters
Cassini-Huygens (1997)
Probes
Huygens probe (atmosphere of Titan)
launch dates are shown in parentheses

Cassini-Huygens entered orbit around Saturn on July 1, 2004.  It was the 4th space craft to visit Saturn and the first to enter orbit.  The Huygens probe separated from the orbiter and landed on Titan, one of Saturn's moons, on Jan 14, 2005The original mission (i.e. funding) was extended in 2008 until 2010 and again in 2010 until 2017.  The plan is then to initiate a controlled fall into Saturn's atmosphere.

Storms on Saturn are sometimes very large and can last several months.


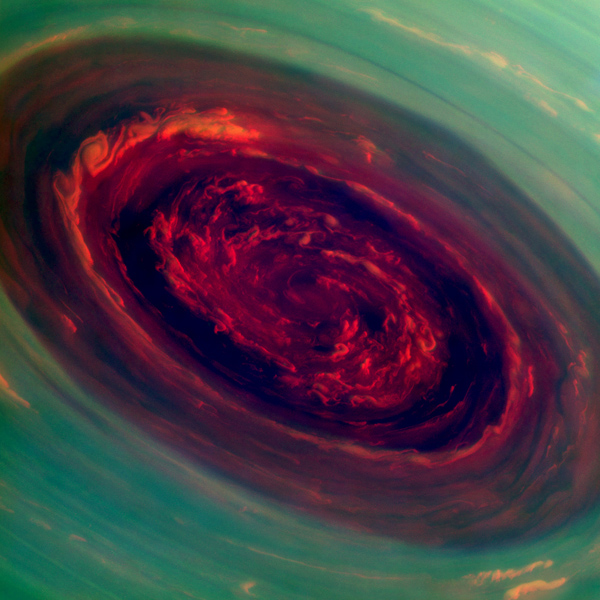
This false color image of a storm at the north pole of Saturn resembles a hurricane on earth (photo credit NASA/Jet Propulsion Laboratory-Caltech Space Science Institute, see this NASA/JPL site for additional information).  The image was taken on Nov. 27, 2012 when the Cassini spacecraft was 261,000 miles from Saturn (the north pole was in darkness when the spacecraft arrived at Saturn in 2004).


The image above at left shows a storm developing on Saturn in Dec. 2010.  The storm measured approximately 1900 km from east to west and
1300 km from north to south.  Radio emissions produced by lightning were detected from the storm at this time.  The image at right shows the storm in Feb. 2011 after it had completely circled the planet.  The storm continued for several more months. (credit for both photographs NASA/JPL-Caltech/SSI, see this site for additional information)

Lightning has been photographed on both the daytime and nighttime sides of Saturn.


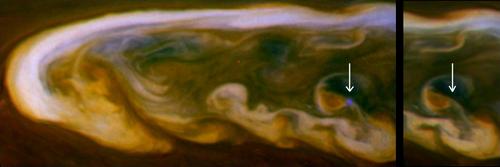
Lightning is shown in blue near the right edge of the left image (false color image).  The right image was taken 30 minutes later when the storm was producing lightning.  Both photographs were taken on the daytime side of Saturn (credit: NASA/JPL-Caltech/SSI).  The spacecraft was approximately 2 million miles from Saturn.


The photograph above shows lightning photographed on the nighttime side of Saturn at a time when the rings of Saturn were in shadow (see Dyudina et al. (2010)) for more details (photo credit: NASA/JPL-Caltech/SSI).  Ordinarily light reflected by the rings make the clouds bright enough, even on the nighttime side of Saturn, to make detection of lightning difficult.

X-ray production during triggered and natural lightning discharges

Coming soon: some mention of the fairly recent observations and measurements of X-rays and gamma ray production during natural and triggered lightning discharges.