Monday Jan. 25, 2016
Some Cajun music from the Lost Bayou Ramblers "Blue Moon
Special" (6:27) from a concert in Sweden, "Moi J'Connais
Pas" (4:34) from a performance in France
This photo of Central Park in New York City (Astrid Riecken/Getty
Images) is from the online
coverage of the 2016 Blizzard on Slate.com. 26.8
inches of snow was measured in Central Park just 0.1 inches short
of the all time record (26.9 inches fell on Feb. 11, 2006
according to this
reference). Slate.com also has a nice
collection of photographs from the weekend blizzard.
The first Optional Assignment of the semester, concerning El Niño,
has been graded and was returned in class today.
Acid rain
Sulfur
dioxide is one of the pollutants that can react with
water in clouds to form acid rain (some of the
oxides of nitrogen can also react with water to form
nitric acid). The formation and effects of
acid rain are discussed on p. 12 in the photocopied
Class Notes.
Acid rain is often a problem in regions that
are 100s even 1000s of miles from the source of the sulfur
dioxide. Acid rain in Canada could come from sources in
the US, acid rain in Scandinavia came from industrialized areas
in other parts of Europe.
Note at the bottom of the figure above that natural
"pristine" rain has a pH less than 7 and is slightly
acidic. This is because the rain contains dissolved carbon
dioxide gas. The acid rain demonstration described below
and done in class should make this point clearer.
Some of the problems associated with acid rain are
listed above.
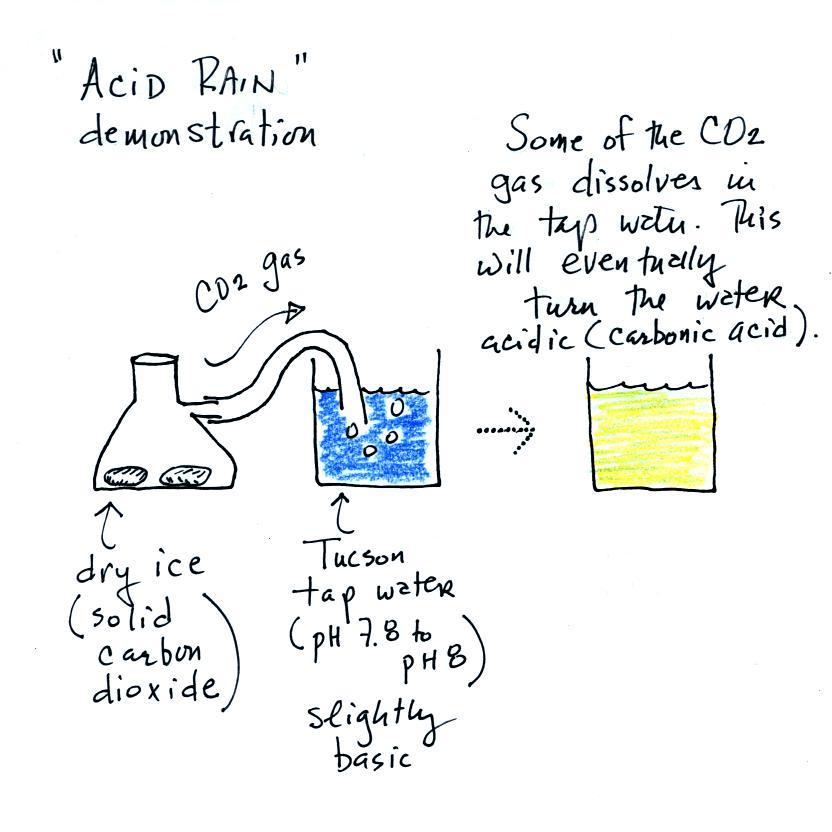
Acid Rain Demonstration
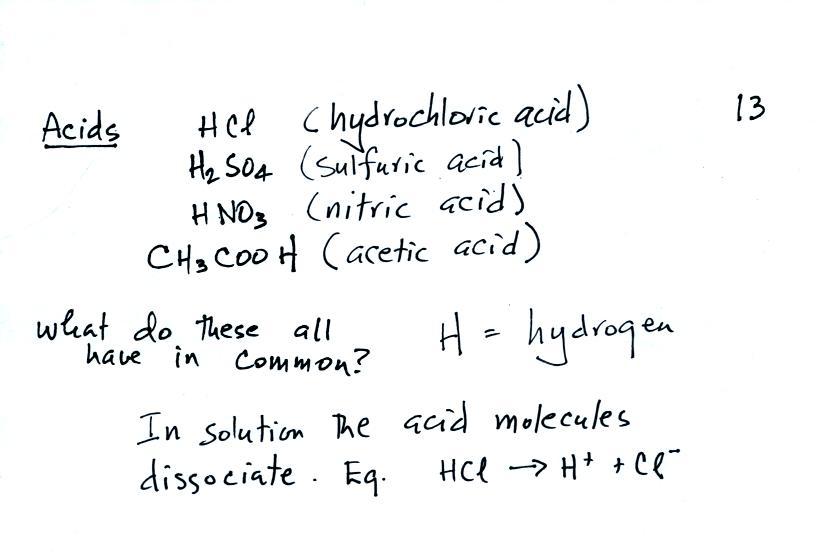
Some common acids are listed below. In
solution the acid molecules dissociate (split) into pieces.
The presence of H+ ions is what makes these materials
acids.
And
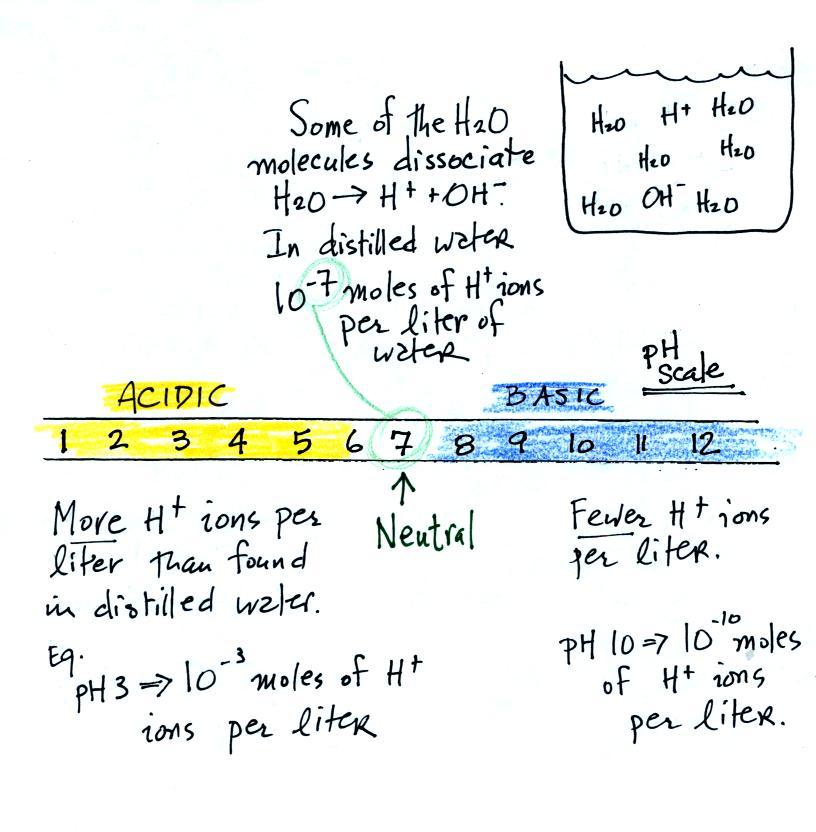
actually it isn't enough to just have H+ ions for
something to be an acid. There are H+
ions in pure distilled water and it's not an acid. To be an
acid the H+ ion concentration must be
greater than is found in distilled water. The H+
ion concentration in distilled water is 10-7 moles
of H+ ions per liter of
water. A mole is
just a number, a very large number (6 x 10²³).
It's the same idea as dozen. A dozen means you've got 12 of
something. 10-7 moles
of H+ ions per liter is
10-7 times
6 x 1023 = 6 x 10¹⁶
H+ ions per liter of water.
The pH scale
We often use the pH scale to measure acid concentration. An
H+ ion concentration of 10-7 moles/liter corresponds to
pH 7 (the pH value is computed by taking the -log10
of the H+
ion concentration). Other than remembering the pH
value of distilled water is pH7, these are all details
you don't need to worry about.
It is also possible to have fewer H+
ions in a solution than would be found in distilled water. A
solution like this is basic.
Pouring some acid into water would increase the H+ ion concentration (from 10-7moles/liter to 10-3moles/liter, perhaps as shown
in the example above). Adding a base to water will decrease
the H+ ion
concentration (from 10-7moles/liter
to 10-10moles/liter,
perhaps).
Now we can proceed with the demonstration. We will start
with three 1000 mL beakers each filled with distilled water.
Some vinegar (contains acetic acid) was added to the left beaker.
Some ammonia (a base) was added to the right beaker.
Acid/Base indicator solution
Then we added some bromothymol blue,
a color indicator solution, to all three beakers.
Bromothymol blue has the amazing property of changing color
depending on whether it is mixed with an acid (golden yellow) or a
base (deep blue).
So far we have just reviewed the pH scale and introduced
acid/base indicator solutions.
When sulfur dioxide is released into the air it reacts with the
water in clouds to produce acid rain. I really can't use SO2
in class because it's poisonous. I'll use carbon dioxide, CO2,
instead.
We added some Tucson tap water to a large 2000 mL beaker.
This represents a cloud. We added some bromothymol
blue to the tap water and it turned blue. So we know that
Tucson tap water is basic.
A few small pieces of dry ice are put into a flask. We close
the flask with a stopper. The end of a piece of tubing
connected to the flask is immersed in the tap water.
Dry ice sublimes. It turns directly from solid to ice
(ordinary ice melts and turns from solid to liquid). The
gaseous CO2 is invisible but
you can tell it is there because of the bubbles in the tap
water. Some of the CO2
dissolves as it bubbles through the water and slowly turns the
water acidic. You can tell that this is occurring because
the bromothymol blue indicator turns from deep blue to green and
eventually to yellow.
I call this a "sort of" acid rain demonstration. That's
because we haven't really produced acid rain. Air contains
carbon dioxide and the CO2 makes natural rain slightly acidic (pH5.6 or
so). To make true acid rain we would need a different gas,
something other than carbon dioxide, something that would lower
the pH below 5.6.
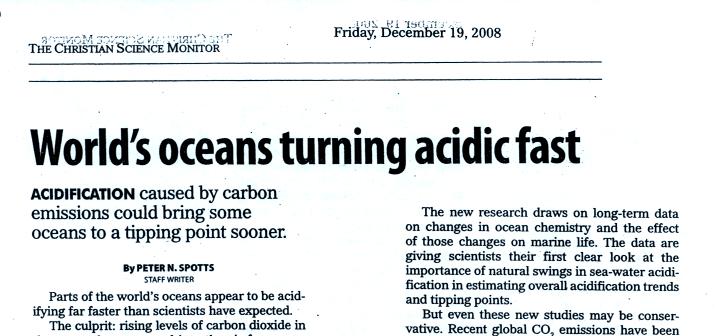
While we didn't actually produce acid rain, there is concern
that increasing atmospheric concentrations of carbon dioxide will
dissolve and acidify the world's oceans. This is discussed
in the following article from The Christian Science Monitor.
You can download a copy of the article here.
The main concern over increasing atmospheric carbon dioxide
concentrations is global warming from enhancement of the
greenhouse effect. We will discuss this topic at some point
during the semester.
Carbonated beverages contain dissolved carbon dioxide and are
acidic. Soft drinks also contain phosphoric acid which makes
them even more acidic than the dissolved carbon dioxide would
do. With time the acidity of soft drinks can damage tooth
enamel.
Particulate matter (PM)
The last pollutant that we will cover is Particulate Matter
(PM). This is small solid particles or drops of liquid, not
gases, that remain suspended in the air.
Carbon monoxide (CO), O3 , and
Particulate Matter are the three main pollutants of concern in
Tucson. PM is a year round problem in Tucson.
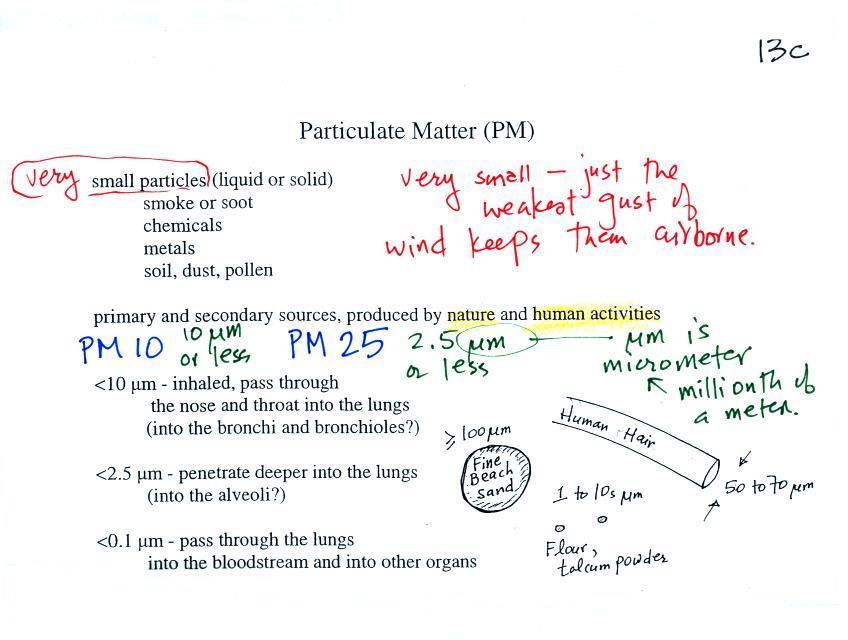
PM pollution is often split into two groups: PM10 and PM2.5.
These refer to particles with diameters less than 10 micrometers
and 2.5 micrometers, respectively. A micrometer (µm)
is one millionth of a meter (10-6
m). You'll find examples of metric distances ranging
from kilometers to nanometers at this
interesting site.
Sizes (in µm) of some common items are
sketched above. Better than sketches are some actual
photographs. The particles are so small they need to be
examined using a microscope.
Photographs of micrometer and 10s of micrometer size
objects
Electron microscope
photograph of human red blood cells..
Individual cells in this example are a little
over 5 um in diameter.
This is not
something you'd find in the atmosphere.
(image source: Dartmouth College
Electron Microscope Facility)
This is something that is commonly found in the air.
This is a photograph of a mixture of different types of
pollen.
The largest pollen grain comes from morning glory (I think) and
is about 100 um in diameter
(image source: Dartmouth
College Electron Microscope Facility)
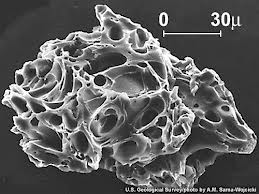
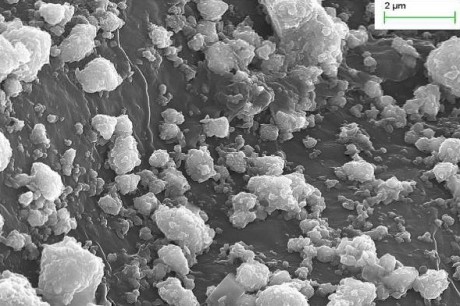
Scanning electron microscope photograph of volcanic ash
(USGS image by A.M. Sarna-Wojcick from
this source)
Airborne particulate matter
collected on the surface of a tree leaf (source).
These particles are pretty small with diameters of 1
to 2 µm.
According to the source, trees capture
appreciable amounts of particulate matter and remove it
from the air in urban areas.
Sources of particulate matter
Particulate matter can be produced naturally (wind blown
dust, clouds above volcanic eruptions, smoke from
lightning-caused forest and brush fires). Many human
activities also produce particulates (automobile exhaust for
example). Gases sometimes react in the atmosphere to make
small drops or particles (this is what happened in the
photochemical smog demonstration). Just the smallest,
weakest gust of wind is enough to keep these small particles
suspended in the atmosphere.
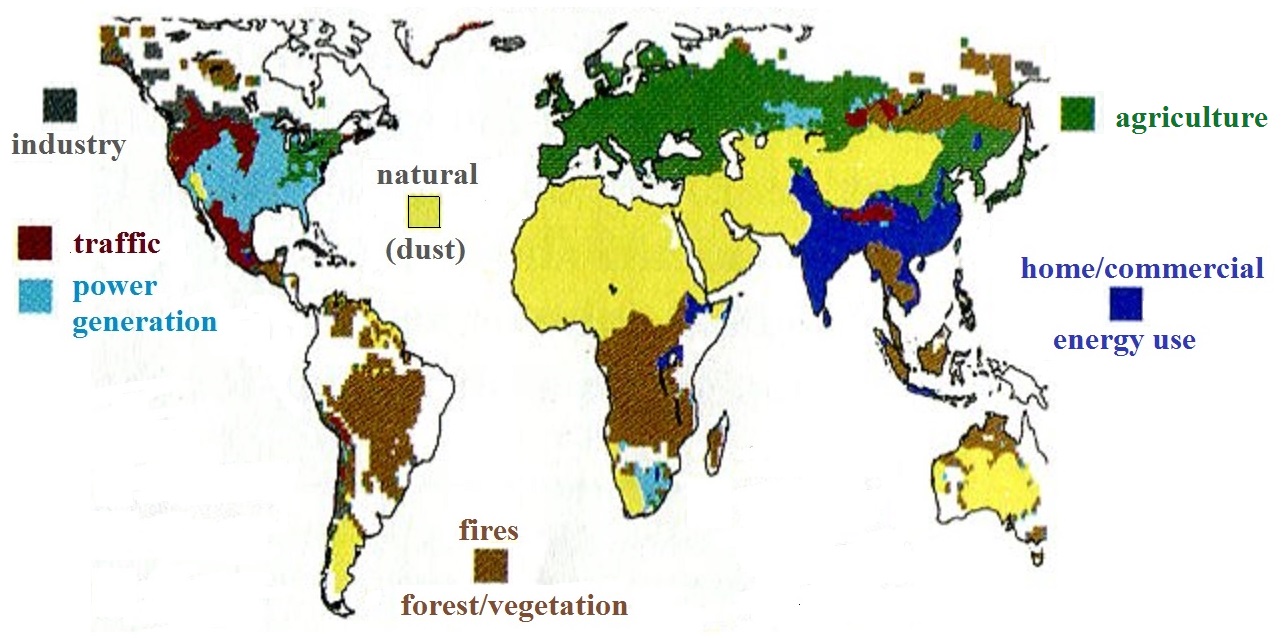
A recent study estimates that more than 3.2 million people die
each year across the globe because of exposure to unhealthy
levels of PM25 (click here
to see a summary and some discussion of the study and here
to see the study itself). The study also attempted to
determine the sources of the PM25 pollution. The figure
below summarizes their findings.
Information like this is important because you need
to know what is adding particulate matter to the air if you
want to try and reduce emissions.
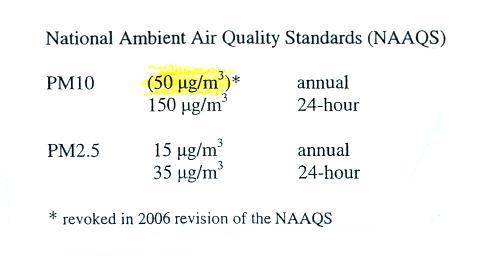
Note
the PM10 annual National Ambient Air Quality
Standard (NAAQS) value of 50 micrograms/cubic
meter (µg/m3)
at the bottom of p. 13c in the photocopied
ClassNotes.
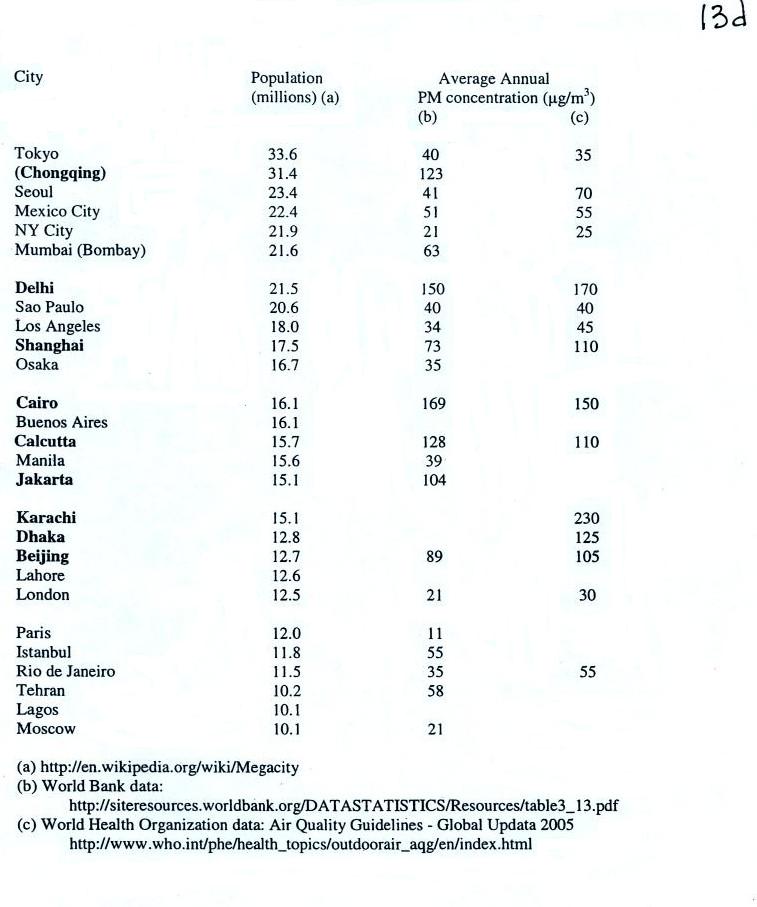
The following list (p. 13d in the ClassNotes) shows that there are
several cities (in bold font) around the world where PM
concentrations are 2 or 3 times higher than the NAAQS value.
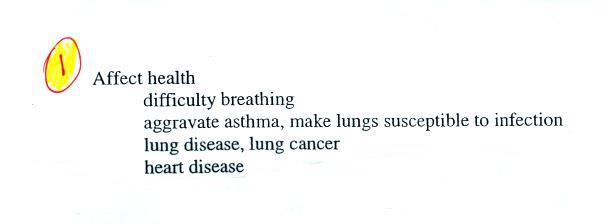
Effects of PM on health
One of the main concerns with particulate pollution is that the
small particles might be a health hazard ( a health advisory is
sometimes issued during windy and dusty conditions in Tucson).
Particles with dimensions of 10 µm
and less can be inhaled into the lungs (larger particles get
caught in the nasal passages). These inhaled particles
may be poisonous, might cause cancer, damage lung tissue, or
aggravate existing respiratory diseases. The smallest
particles can pass through the lungs and get into the blood
stream (just as oxygen does) and damage other organs in the
body.
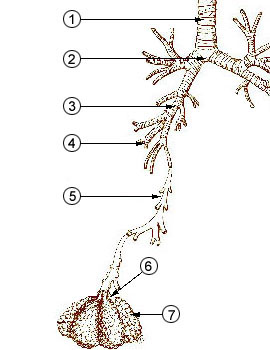
The figure below identifies some of the parts of the human
lung mentioned above. The key point is that
the passageways get smaller and smaller the deeper you move
into the lungs. The smallest particles are the most
dangerous because they can penetrate furthest into the lungs.
The 2008 Summer
Olympics were held in Beijing and there was some concern
that the polluted air would affect the athletes
performance. Chinese authorities restricted
transportation and industrial activities before and during
the games in an attempt to reduce pollutant
concentrations. Rainy weather during the games may
have done the greatest amount of good.
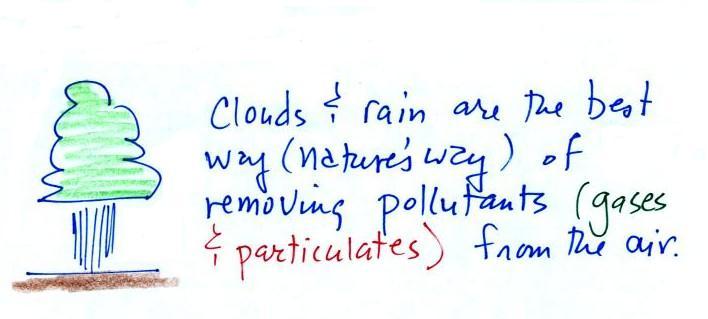
Clouds and precipitation are the best way of cleaning
pollutants from the air. We'll learn later in the semester
that cloud droplets form on small particles in the air called
condensation nuclei. The cloud droplets then form raindrops
and fall to the ground carrying the particles with them.
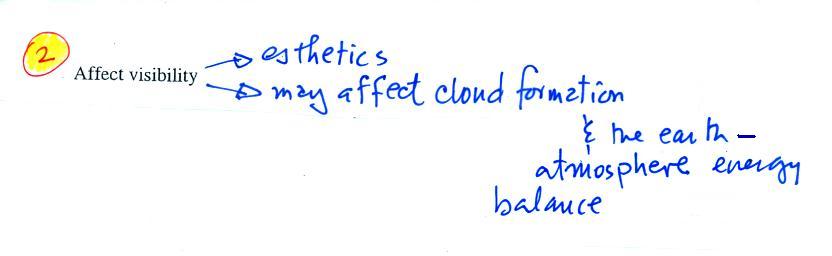
The second main concern with particulates is the
effect they may have on visibility (esthetics below should
actually be spelled aesthetics - i.e. qualities that might
make something appear beautiful or not).
Here's a view of the Catalina mountains taken from the Gould
Simpson Building on the south side of campus.
Some rainy weather had occurred just a day to two earlier, cleaned
the air, and the visibility was very good. Clouds and rain
have done a really good job of cleaning the air.
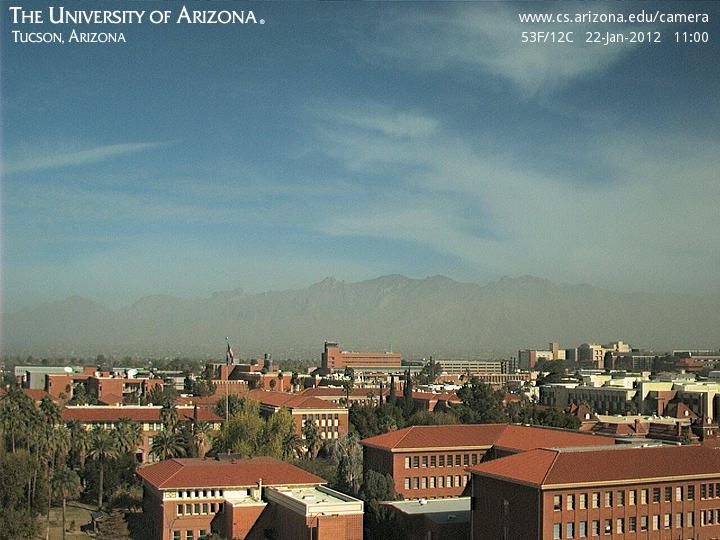
Windy weather a few days later
stirred up a lot of dust that was carried into town.
This picture was taken the day after the windy weather.
There is still a lot of fine dust particles in the air and the
visibility is pretty bad.
We looked at some photographs from Beijing
(January, 2013) last week. Here are some pictures from Harbin,
China (October, 2013). That's about as bad as visibility can
get, visibility in some cases is just a few 10s of feet.
Also a picture from Paris
(March, 2014).


