Monday, Apr. 29, 2019

Adele "Take It All" (4:13), "I'll Be Waiting" (3:55), "Someone Like You" (3:00-8:00), "Set Fire to the Rain" (3:58), "If It Hadn't Been for Love" (2:00-5:19)

The online grades have been updated.   Be  sure to have a look at your grades and let me know if you think there might have been an error.

Information about the Final Exam


The Final Exam Study Guide is now available. 
It lists the topics that will appear on the Final Exam in pretty much the order they were covered during the semester.  We reviewed Topics 6 & 7 in class today.  We'll try to get through Topics 1 - 5 in class on Wednesday.  A 2 hour review is also planned for Tuesday afternoon, May 7.  We'll try to cover the remaining material then.  I don't yet know the time and location of the Tuesday review.  As soon as I do I'll put the information on the Study Outline and also on the class web page.

Down at the bottom of the Study Outline you'll notice that 15 questions (at least) on the Final will come from this semesters quizzes.  I would suggest breaking up the material on the Study Outline into manageable pieces.  Once you've studied one of the blocks of material use this semester's quiz to test yourself.  The Study Outline has been arranged with this in mind.  Because this semester's quizzes come in slightly different versions, I will post links to copies of the quizzes that I will be using when I choose questions.

10 questions (at least) will come from a previous Final Exam.  Once you've made an initial run through the Study Guide use the old final exam to test your understanding and recall. 

5 questions on the final will come from this list of questions about hurricanes


Final Exam score needed to Raise/Preserve your grade


Here are a couple of examples showing you how to  calculate what you need on the Final Exam to either raise your overall grade or preserve the grade you already have.


In this example we assume that your current grade is 86.5% (your overall average with the lowest quiz score dropped).  How well would you need to do on the Final Exam to raise this to an A (90%)? 

Your final grade depends on current grade and the final exam score.  In a case like this where the exam score will raise your overall grade, I count the exam score as 40% of your overall grade.  Your current grade is 60%.

We set up an equation with a desired grade of 80% (B).  The sum of your current grade times 60% (0.6) plus your exam score times 40% (0.4) must equal 80%.  You solve the equation for the exam score.  The details of the calculation are shown above.  You'll need 95.2% or above on the final exam to end up with a B in the class.  That's a very attainable goal.

What if you're happy with a B and wonder how poorly you can do on the final and still keep a B?

We'll do a similar calculation.


We try to minimize the damage the final exam can do by making it only 20% of your overall grade.  You would only need 54% on the final to preserve the B that you currently have.


Office hours

Generally every afternoon  between 1:30 and 3:30 this week and Monday next week.  Morning office hours will be discontinued beginning on Thursday this week.


There was still quite a bit of time left in class so we reviewed Topics 6 & 7 on the Study Outline.  Here are cleaned up versions of what was covered in class


There will probably still be a fair amount of time left in the class period and we may very well review a couple of the topics on the Final Exam Study Outline.

Station model notation


Dew points in Tucson fall between 25 F and 45 F most of the year, those are normal or average values.  They rise into the 50s and 60s during the summer thunderstorm season (these would be relatively high values for Tucson.  I won't expect you to decode the pressure information plotted on a map, though you should be able to determine which of the two possibilities is more reasonableMeteorologists usually specify the direction the wind is coming from.

Surface weather map features


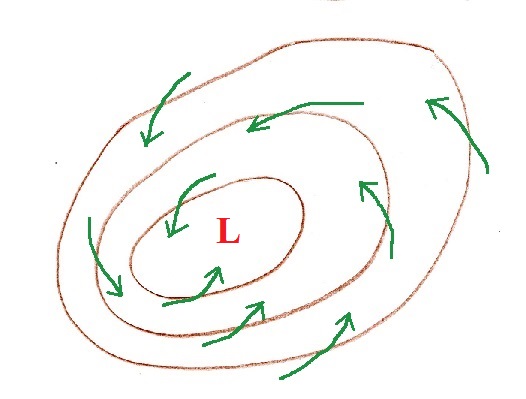
The labels on the contours are reasonable sea level pressure values. These are pressure contours, isobars.  The fact that the values decrease as you move in toward the center means this is a center of low pressure.
Surface winds blow across the isobars always toward low pressure.  That's another way of figuring out this is a center of low pressure.  The term cyclone refers to winds spinning around a center of low pressure.


You should be able to identify cold fronts (at left above) and warm fronts (right), determine where the cold and warm air would be found, and show their direction of motion.


In these crossectional views of cold and warm fronts you should be able to determine whether the cold air is advancing or retreating (bunched up shape vs a ramp like shape).  Which ever air mass is rising is the lower density warmer air mass.  Both warm and cold fronts cause air to rise.


Upper level charts


Upper level charts usually have more of a wavy pattern rather than the bulls-eye pattern of circular high and low pressure centers found on surface weather maps.

You should be able to identify the ridge (n-shape) and trough (u-shape) features.  Warmer than average air produces ridges, troughs are associated with colder than average air.  Upper level winds blow parallel to the contours and from west to east.